
By RoboForex Analytical Department
The AUD/USD pair climbed to 0.6922 on Monday, marking its highest point since February 2023. This surge was primarily triggered by China’s announcement of economic stimulus measures, which is significant given China’s status as Australia’s largest trading partner. Such support for the Chinese economy will likely increase demand for commodities and bolster major currencies tied to trade with China.
Additionally, the Australian dollar has benefited from the recent weakness in the US dollar, spurred by disappointing economic data from the US. This has heightened market expectations that the Federal Reserve will persist with rapid interest rate cuts.
At its September meeting, the Reserve Bank of Australia (RBA) opted to maintain its interest rate at 4.35% per annum, suggesting that the current monetary policy might remain unchanged for some time. The RBA’s cautious approach reflects its strategy of closely monitoring inflation and employment trends without immediate concern about aligning its pace with other global central banks.
This week is set to be significant for the Australian dollar. Australia is scheduled to release data on retail sales, construction, and various trade indicators, which could influence the currency’s trajectory.
Technical analysis of AUD/USD
Free Reports:
 Sign Up for Our Stock Market Newsletter – Get updated on News, Charts & Rankings of Public Companies when you join our Stocks Newsletter
 Get our Weekly Commitment of Traders Reports - See where the biggest traders (Hedge Funds and Commercial Hedgers) are positioned in the futures markets on a weekly basis.
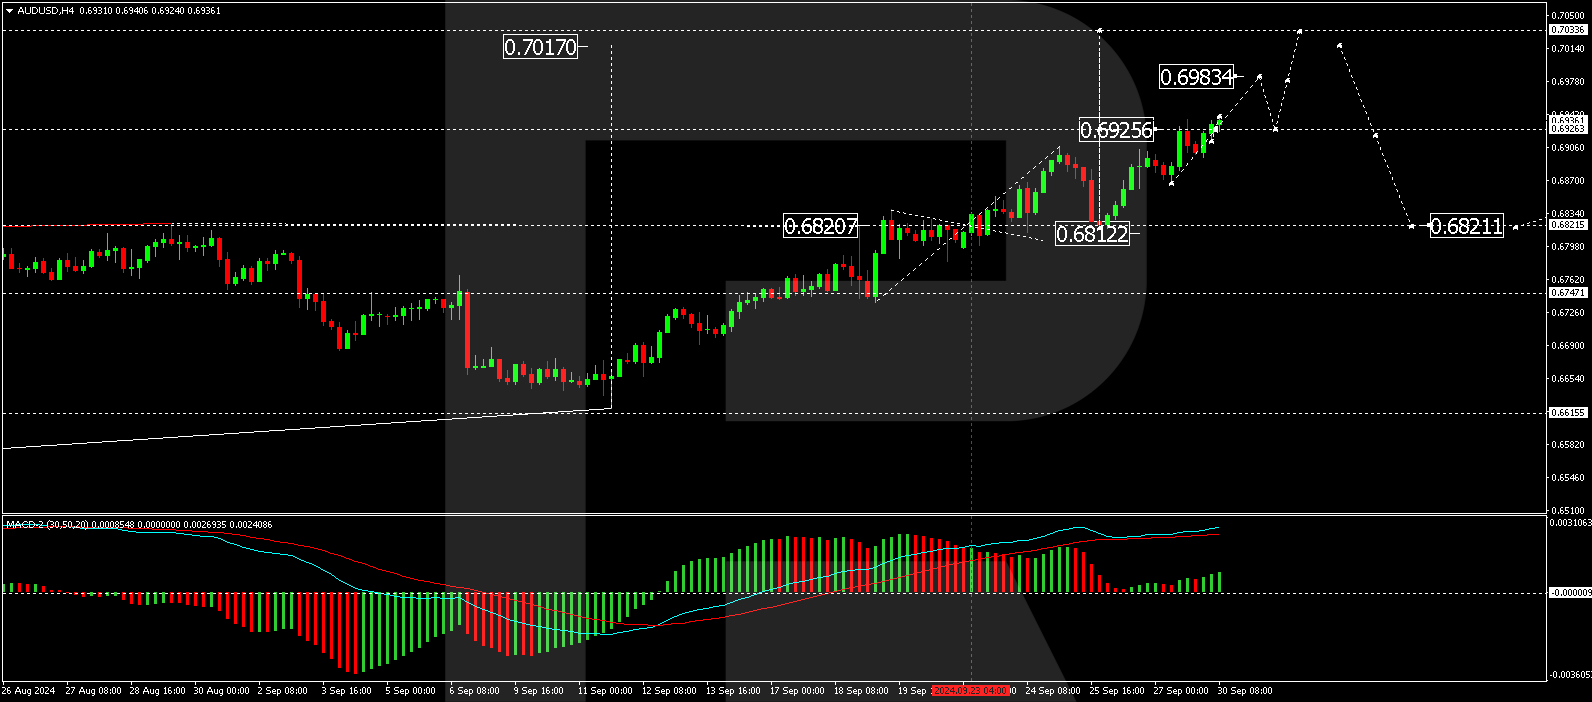
The AUD/USD market is extending the fifth wave of growth, with a consolidation range forming around the 0.6925 level. There is potential for an upward break targeting 0.6983. After reaching this level, a corrective movement to retest 0.6925 may occur. If the bullish momentum continues, the next wave could reach 0.7033. The MACD indicator supports this bullish scenario, with its signal line well above zero and upwards.
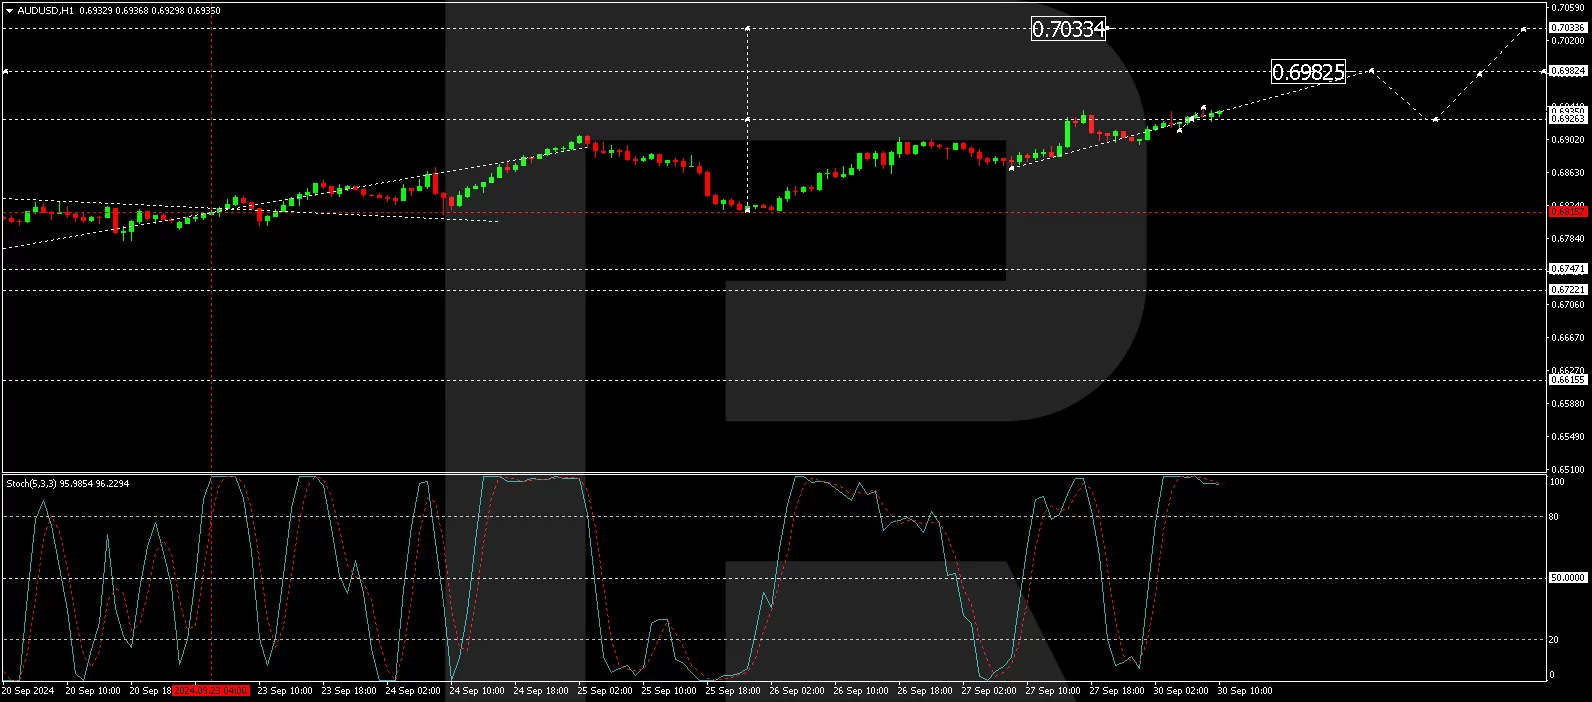
On the hourly chart, the AUD/USD has achieved a growth wave up to 0.6926 and is now consolidating just below this level. If the pair exits this range downward, a correction to 0.6877 could be expected. Conversely, a breakout above could extend the uptrend towards 0.6982, potentially reaching 0.7033. The Stochastic oscillator, currently above 80 and trending downward, suggests a short-term pullback might occur before further advances.
Disclaimer
Any forecasts contained herein are based on the author’s particular opinion. This analysis may not be treated as trading advice. RoboForex bears no responsibility for trading results based on trading recommendations and reviews contained herein.

- Investors run to safe-haven assets amid Middle East escalation Mar 6, 2026
- EUR/USD Under Pressure: Middle East Risks Outweigh All Else Mar 6, 2026
- Bitcoin shows resilience to Middle East events. Oil market stabilizes Mar 5, 2026
- GBP/USD: Market Not Expecting BoE Rate Cut in March Mar 5, 2026
- Brent headed for $100? Mar 4, 2026
- Global stock indices continue sell-off due to Middle East conflict Mar 4, 2026
- USD/JPY to Quickly Return to Growth: Momentum Favours the US Dollar Mar 4, 2026
- European equities plunge amid Persian Gulf military conflict Mar 3, 2026
- Gold Rallies for Fifth Day, With External Risks Mounting Mar 3, 2026
- Iran Crisis: A Dangerous Turning Point Mar 2, 2026