
By RoboForex Analytical Department
The NZD/USD pair has climbed to the highest level since 15 January 2024, continuing its trajectory within an ascending channel towards a target of 0.6233. The New Zealand dollar’s growth is primarily fuelled by the weakening US dollar, mirroring trends observed with other currencies such as the AUD and CAD.
Investor sentiment is buoyed by the anticipation that the US Federal Reserve will begin easing monetary policy at its September meeting. Debates about whether the rate cut will be 25 or 50 basis points are ongoing. The decision is seen as imminent given the current inflationary environment in the US and the need to support the employment market.
Conversely, the Reserve Bank of New Zealand (RBNZ) has already taken proactive steps by lowering its interest rate earlier this month. The RBNZ has also signalled a potential reduction in lending costs by up to 75 basis points by year-end, marking a fairly aggressive stance on rates. This transparent approach to monetary policy is helping to shape market expectations and bolster the NZD.
Technical analysis of NZD/USD
Free Reports:
 Get our Weekly Commitment of Traders Reports - See where the biggest traders (Hedge Funds and Commercial Hedgers) are positioned in the futures markets on a weekly basis.
 Download Our Metatrader 4 Indicators – Put Our Free MetaTrader 4 Custom Indicators on your charts when you join our Weekly Newsletter
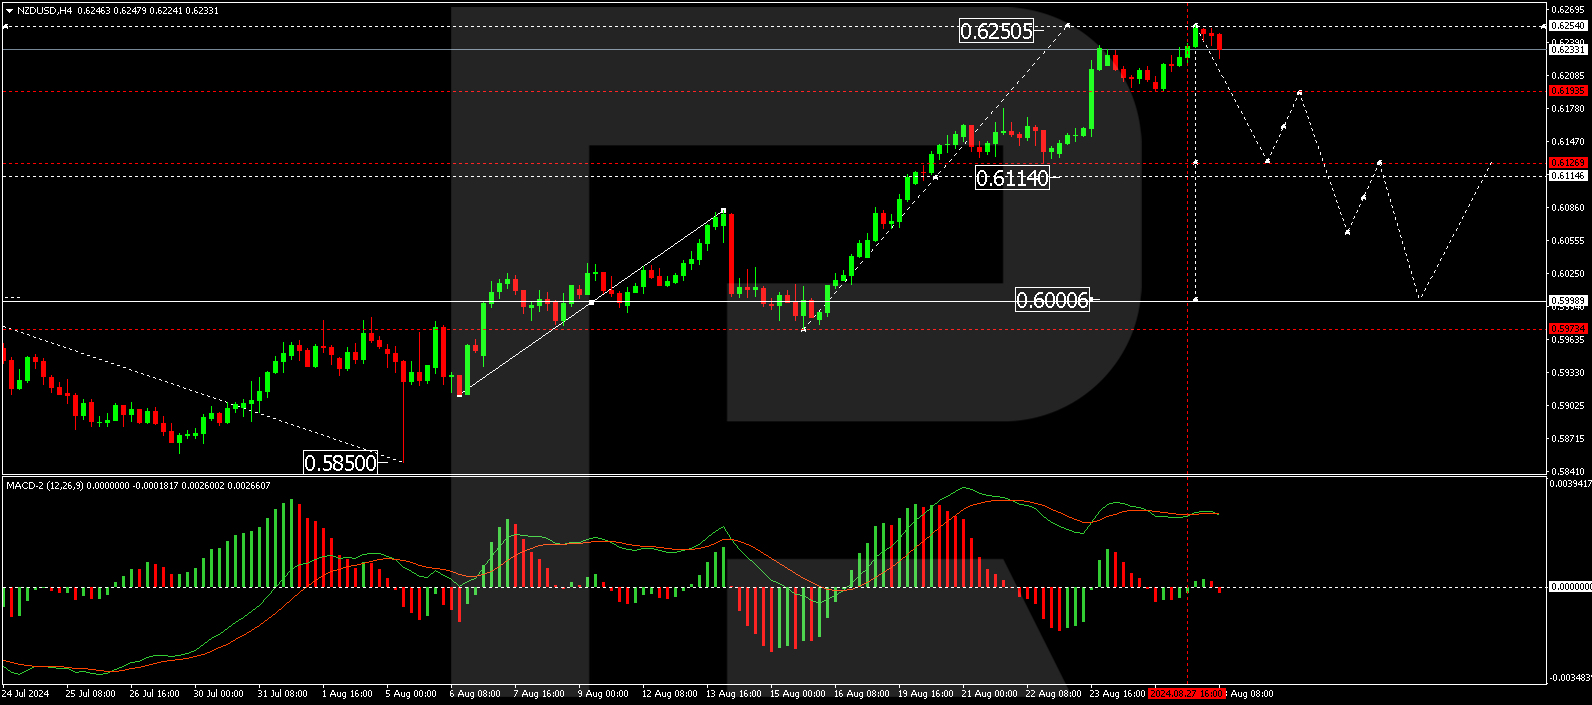
On the H4 chart, NZD/USD has completed a growth wave to 0.6250 and is now forming the initial decline phase towards 0.6128. After reaching this target, a corrective movement to 0.6191 might occur, testing it from below before initiating a further decline to 0.6065 and possibly extending to 0.6000. The MACD indicator, positioned above zero but trending downwards, supports this bearish outlook.
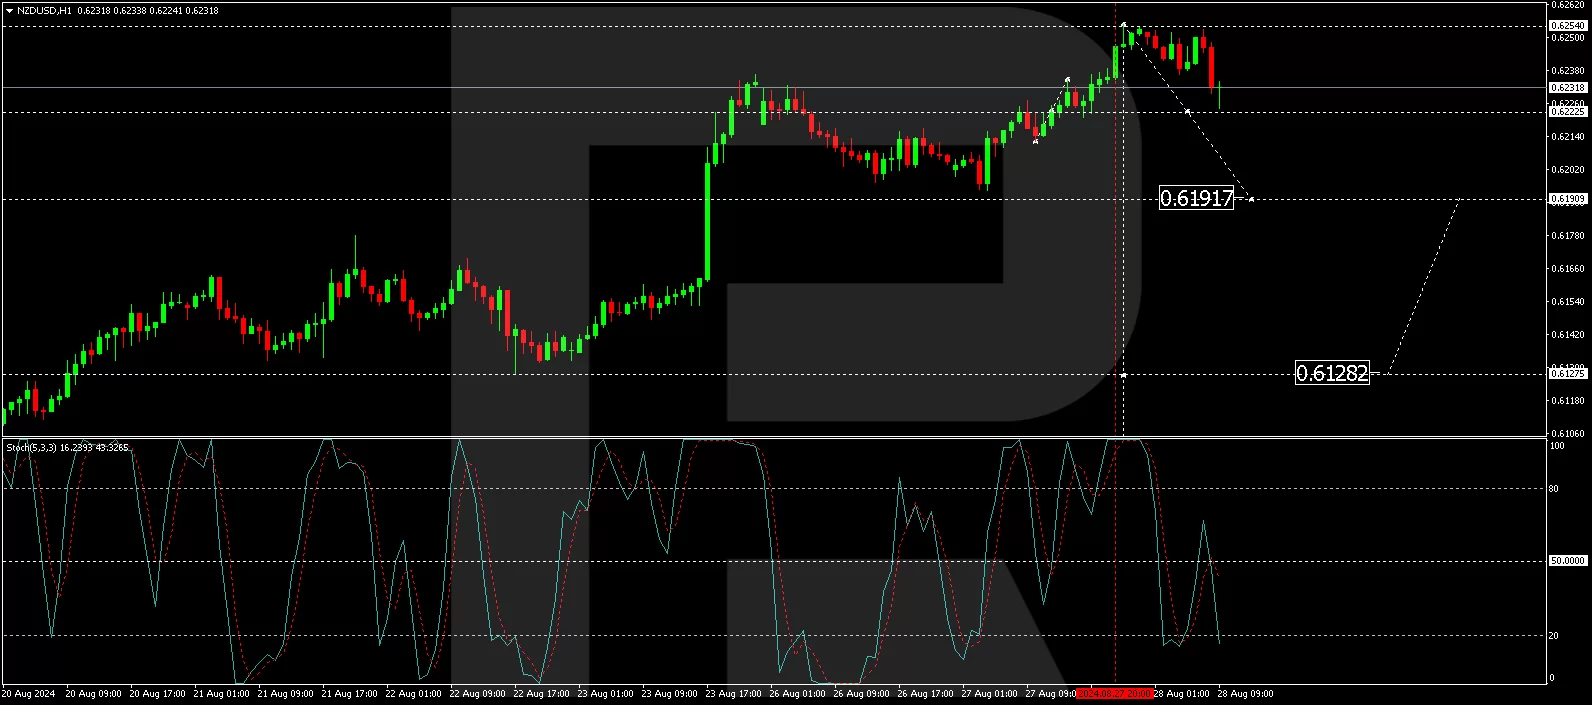
On the H1 chart, the pair is currently developing a decline structure towards 0.6222. Following this, a brief uptick to 0.6238 is expected, potentially leading to a consolidation around this level. A downward exit from this consolidation could signal the continuation of the downward trend towards 0.6128. This scenario is corroborated by the Stochastic oscillator, with its signal line below 50 and aiming towards 20, indicating a likely continuation of the downward movement.
Disclaimer
Any forecasts contained herein are based on the author’s particular opinion. This analysis may not be treated as trading advice. RoboForex bears no responsibility for trading results based on trading recommendations and reviews contained herein.

- The US and European stock indices are rising again amid renewed investor interest in the AI industry. Jul 10, 2026
- USD/JPY Falls as Yen Recovers Weekly Losses Jul 10, 2026
- Crude oil prices surged sharply by 7% in reaction to the rapid escalation of the conflict in the Middle East Jul 9, 2026
- Middle East Tensions Weigh on Gold Jul 9, 2026
- Pound Awaits Tighter Policy from Bank of England Jul 8, 2026
- The United States carried out airstrikes on Iran after Iran’s attacked tankers in the Strait of Hormuz. The RBNZ raised the interest rate to 2.5% Jul 8, 2026
- RoboForex Brings Full-Scale Trading to Telegram Jul 7, 2026
- Your Bourse Integrates TradingView Charts and Trading Platform Library with Trade Server Jul 7, 2026
- Yen Still Under Pressure: Markets Await Action from Authorities Jul 7, 2026
- Germany’s DAX Index has updated its all‑time high. OPEC+ countries have agreed to increase production Jul 7, 2026