
By RoboForex Analytical Department
The USD/JPY pair has experienced a sharp decline, currently at 152.79, following decisive monetary policy adjustments by the Bank of Japan (BoJ). In a significant shift, the BoJ raised its interest rate to 0.25% per annum and unveiled plans to scale back monthly bond purchases to approximately 3 trillion yen by Q1 2026. Further interest rate hikes and monetary policy adjustments are on the table if economic activities and inflation pressures align with projections.
This move comes as the BoJ faces increasing pressure from government and financial authorities to mitigate the yen’s weakness and curb rising inflation. The yen’s devaluation has been a pressing concern, intensifying inflationary pressures within the country.
Recent data from Japan provided mixed signals: retail sales reached a four-month high in June, indicating robust consumer activity, whereas industrial production showed a smaller-than-expected decline.
As the market continues to digest the BoJ’s new stance, the USD/JPY pair shows potential for further declines, especially if the market fully assimilates these recent adjustments from the Japanese central bank.
Technical Analysis: USD/JPY
Free Reports:
 Get our Weekly Commitment of Traders Reports - See where the biggest traders (Hedge Funds and Commercial Hedgers) are positioned in the futures markets on a weekly basis.
 Download Our Metatrader 4 Indicators – Put Our Free MetaTrader 4 Custom Indicators on your charts when you join our Weekly Newsletter
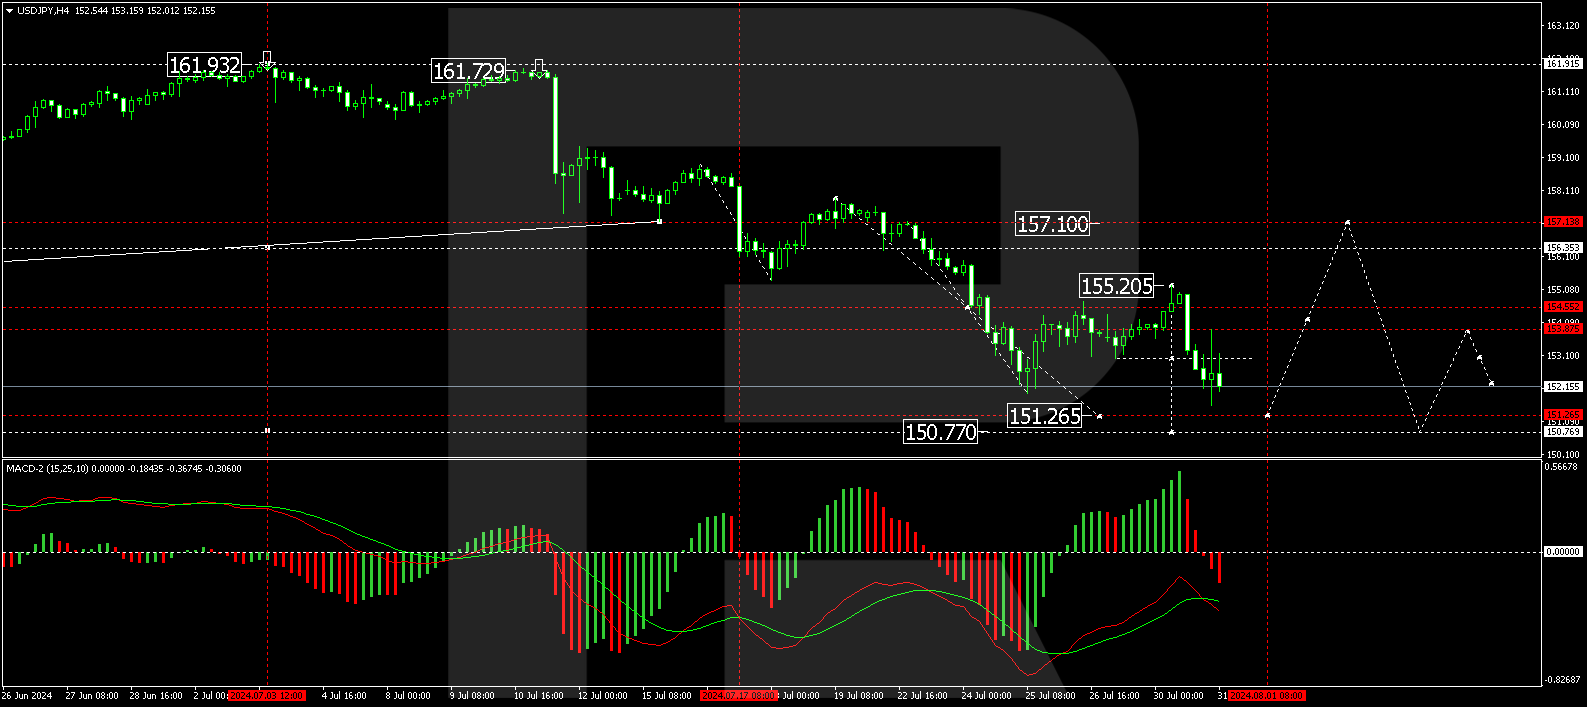
The USD/JPY pair formed a consolidation range around 153.03, extending between 155.20 and 152.10. Following a breakout below this range, there is a visible downward trajectory towards 151.26, potentially extending to 150.77. The MACD indicator, positioned below zero with a downward trajectory, supports this bearish outlook.
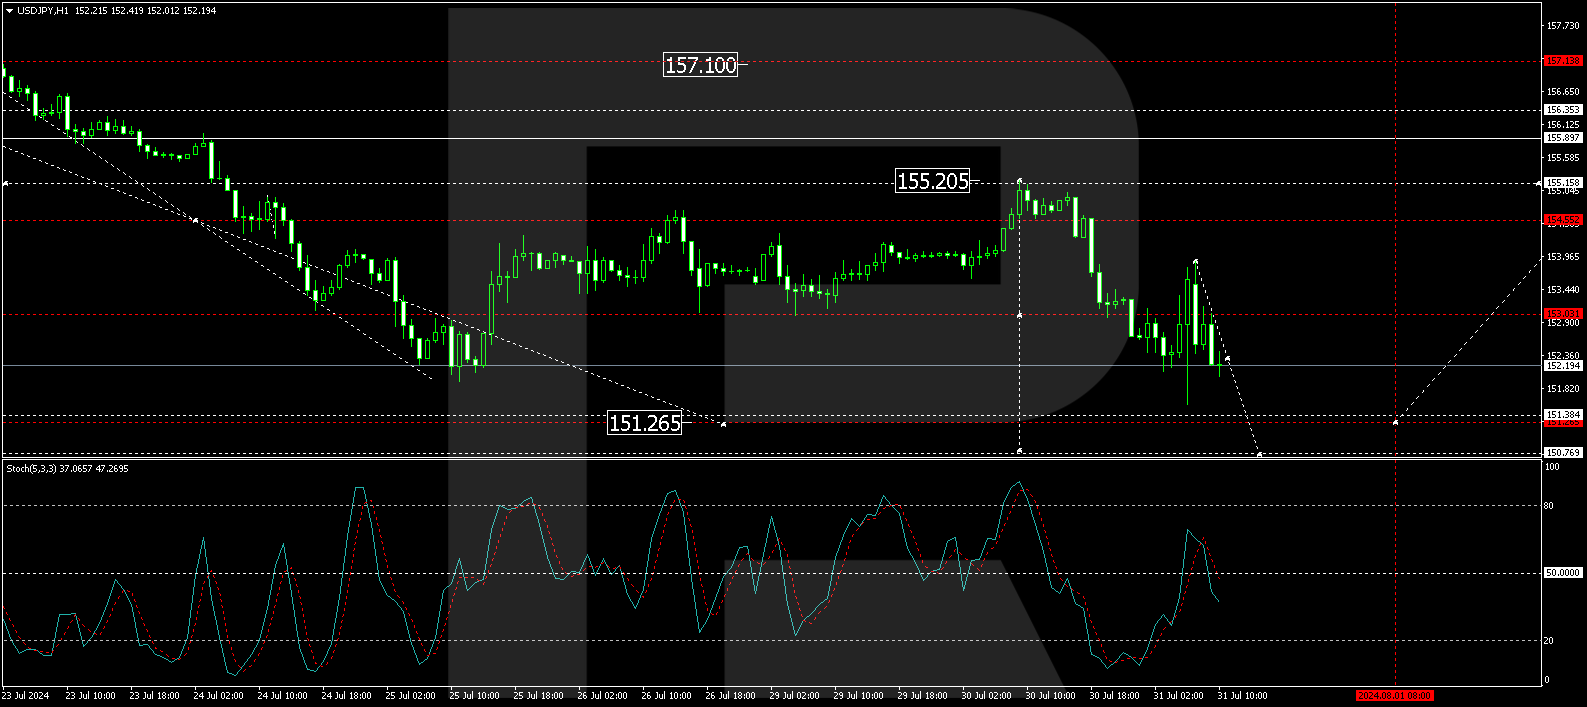
After completing a decline to 151.57 and a subsequent correction to 153.88, the market is poised for another downward movement towards 151.35, potentially continuing to 150.77. This bearish forecast is bolstered by the Stochastic oscillator, below the 50 mark and trending downwards, indicating continued selling pressure.
Disclaimer
Any forecasts contained herein are based on the author’s particular opinion. This analysis may not be treated as trading advice. RoboForex bears no responsibility for trading results based on trading recommendations and reviews contained herein.

- COT Metals Charts: Speculator Bets led by Silver, Gold & Platinum Mar 7, 2026
- COT Bonds Charts: Speculator Bets led by 10-Year Bonds & Fed Funds Mar 7, 2026
- COT Energy Charts: Speculator Bets led by Brent Oil & Heating Oil Mar 7, 2026
- COT Soft Commodities Charts: Speculator Bets led by Corn & Soybean Meal Mar 7, 2026
- Investors run to safe-haven assets amid Middle East escalation Mar 6, 2026
- EUR/USD Under Pressure: Middle East Risks Outweigh All Else Mar 6, 2026
- Bitcoin shows resilience to Middle East events. Oil market stabilizes Mar 5, 2026
- GBP/USD: Market Not Expecting BoE Rate Cut in March Mar 5, 2026
- Brent headed for $100? Mar 4, 2026
- Global stock indices continue sell-off due to Middle East conflict Mar 4, 2026