
By RoboForex Analytical Department
The AUD/USD pair is climbing towards 0.6552 on Monday. The Australian dollar is bouncing back from a 12-week low as investors await Australian inflation data.
In the past two weeks, the AUD, in the currency pair with the USD, has fallen more than 3%. This happened amid a global sell-off in risky assets and also due to weak reports from China.
This week, the release of crucial price statistics will significantly influence the Reserve Bank of Australia’s future course of action. Inflation is expected to have accelerated slightly in Australia in Q2 2024. For example, for April-June, inflation could have risen by 1.0% QoQ, the same as before. In annualised terms, it could accelerate to 3.8% from 3.6% previously. The data will be released on Wednesday.
This week, Australia’s macroeconomic calendar will be particularly active. The release of reports on last quarter’s retail sales, trade balance, exports and imports, and the producer price index will provide crucial insights into the economy. The stronger the data, the better – especially amid China’s economic weakness, Australia’s main economic partner. In this context, it is essential to remain resilient.
Currently, the market estimates the probability of the RBA interest rate hike in August to be 20%.
Free Reports:
 Download Our Metatrader 4 Indicators – Put Our Free MetaTrader 4 Custom Indicators on your charts when you join our Weekly Newsletter
 Get our Weekly Commitment of Traders Reports - See where the biggest traders (Hedge Funds and Commercial Hedgers) are positioned in the futures markets on a weekly basis.
AUD/USD technical analysis
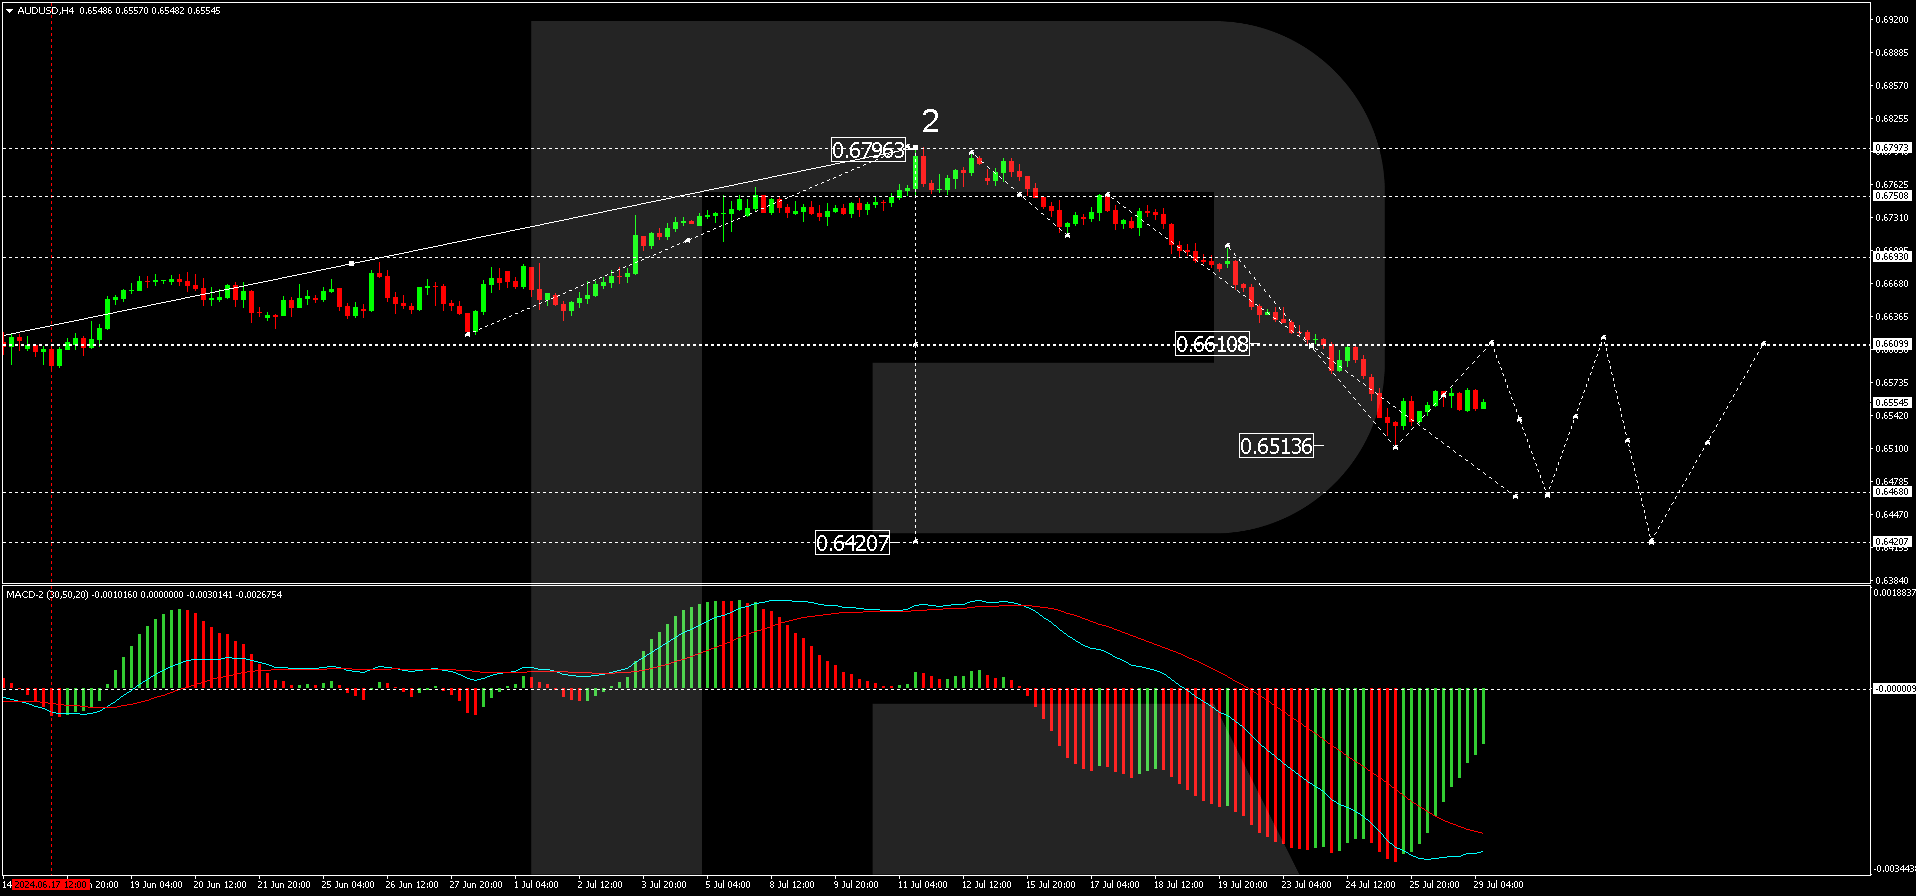
On the H4 chart of AUD/USD, the market performed a wave of decline to 0.6513. Today, it is relevant to consider the probability of correction development to the level of 0.6609. After the correction is completed, we will consider the likelihood of trend continuation to the level of 0.6468 with the prospect of trend continuation to the level of 0.6420. Technically, such a scenario is confirmed by the MACD indicator. Its signal line is under the zero mark and is directed strictly downwards.
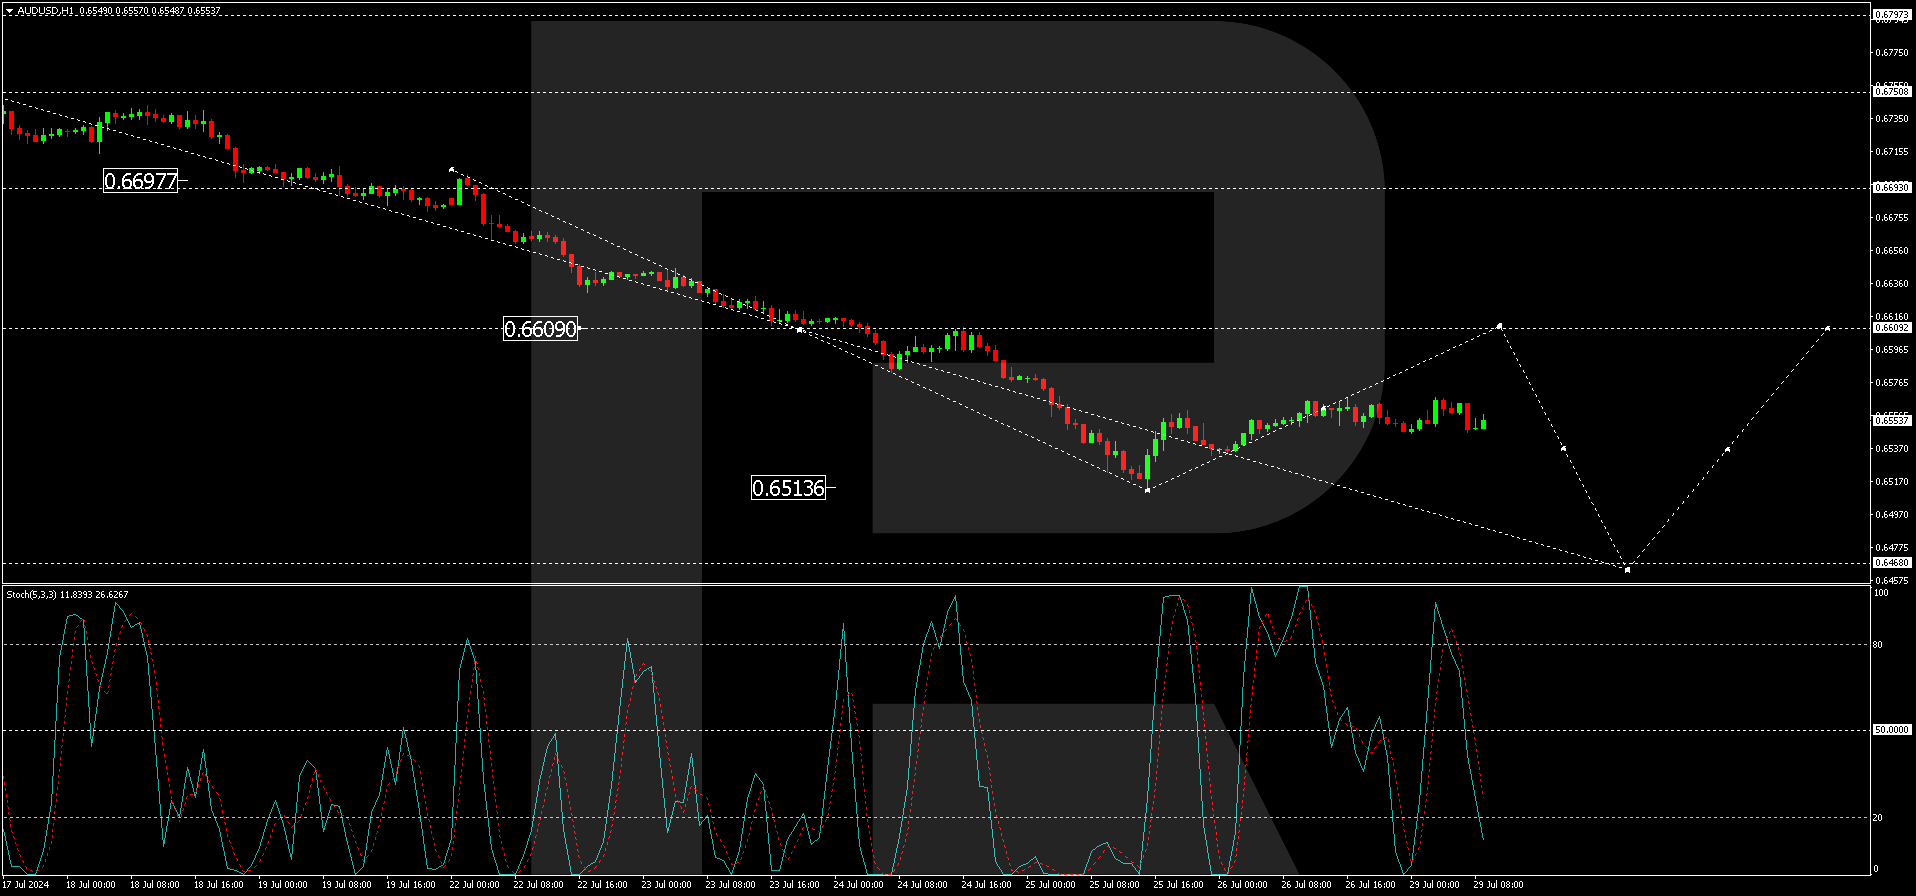
On the H1 AUD/USD chart, the market is forming a consolidation range around the level of 0.6561. In case of an upside exit, the potential of a wave to the level of 0.6609 will open. In case of a downward exit, we will consider the continuation of the wave to the level of 0.6468. The target is local. Technically, this scenario is confirmed by the Stochastic oscillator. Its signal line is under 50 and is directed strictly downwards to 20.
Disclaimer
Any forecasts contained herein are based on the author’s particular opinion. This analysis may not be treated as trading advice. RoboForex bears no responsibility for trading results based on trading recommendations and reviews contained herein.

- COT Metals Charts: Speculator Bets led by Silver, Gold & Platinum Mar 7, 2026
- COT Bonds Charts: Speculator Bets led by 10-Year Bonds & Fed Funds Mar 7, 2026
- COT Energy Charts: Speculator Bets led by Brent Oil & Heating Oil Mar 7, 2026
- COT Soft Commodities Charts: Speculator Bets led by Corn & Soybean Meal Mar 7, 2026
- Investors run to safe-haven assets amid Middle East escalation Mar 6, 2026
- EUR/USD Under Pressure: Middle East Risks Outweigh All Else Mar 6, 2026
- Bitcoin shows resilience to Middle East events. Oil market stabilizes Mar 5, 2026
- GBP/USD: Market Not Expecting BoE Rate Cut in March Mar 5, 2026
- Brent headed for $100? Mar 4, 2026
- Global stock indices continue sell-off due to Middle East conflict Mar 4, 2026