
By RoboForex Analytical Department
The GBP/USD pair is balancing around 1.2709 on Thursday, after the British pound rose in price against the US dollar for three consecutive days and finally paused.
The Bank of England will convene for its regular meeting today, at which the regulator will review all the collected statistics and decide on the interest rate level. The prevailing forecast suggests the rate will remain unchanged at 5.25% per annum. However, other options are always possible.
It will be interesting to see how the BoE will assess its success in fighting inflation. The UK consumer price index slowed to 2.0% in May from 2.3% earlier. In comparison, the indicator increased by 0.3% month-over-month, as in April, while an increase of 0.4% m/m was expected.
It can be said with confidence that the inflation trend has developed positively. It is now essential that the Bank of England also notices and applies this.
The BoE may be able to reduce the rate at least twice in 2024. The business sector, industry, and retail are ready for this.
Free Reports:
 Download Our Metatrader 4 Indicators – Put Our Free MetaTrader 4 Custom Indicators on your charts when you join our Weekly Newsletter
 Get our Weekly Commitment of Traders Reports - See where the biggest traders (Hedge Funds and Commercial Hedgers) are positioned in the futures markets on a weekly basis.
Technical analysis of GBP/USD
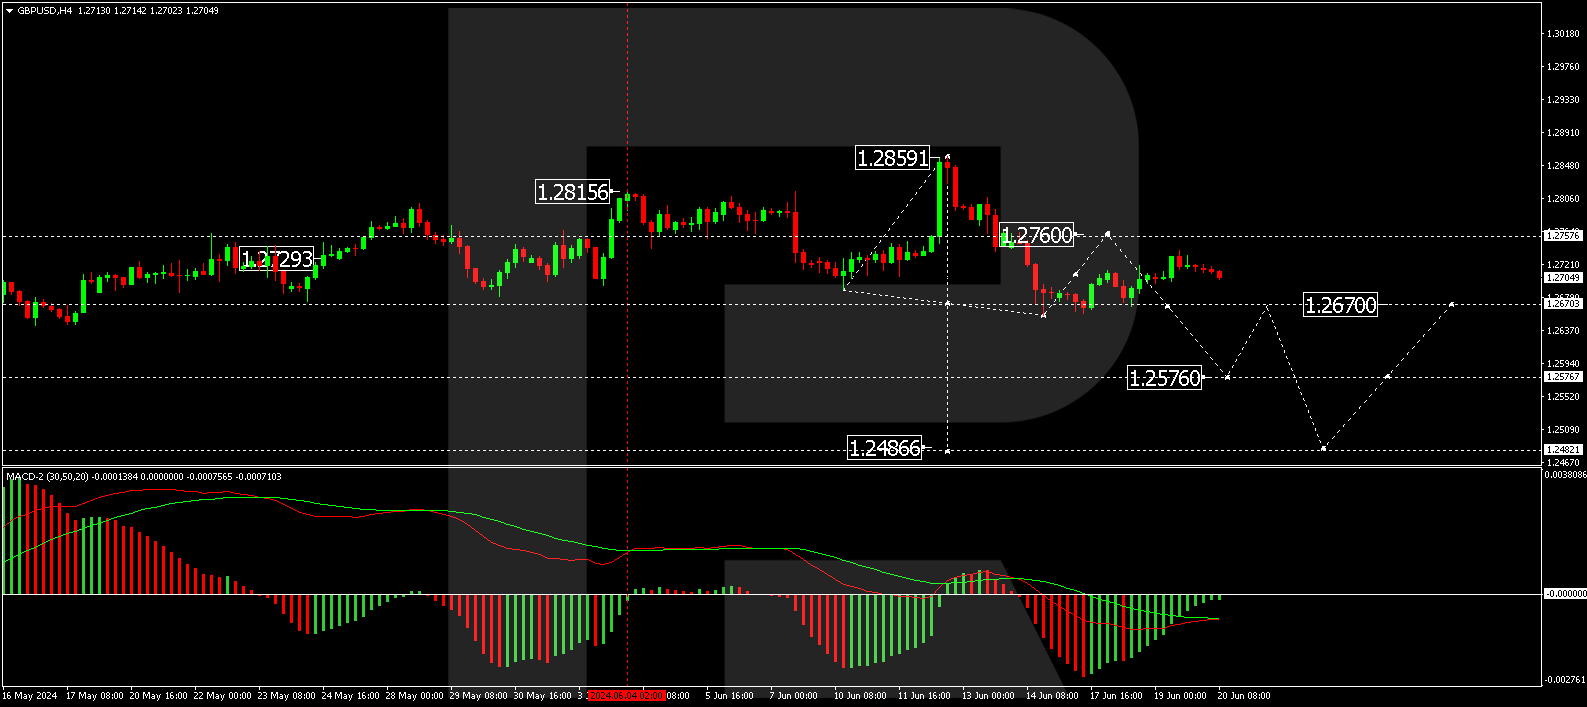
On the H4 GBP/USD chart, the first impulse of decline to the level of 1.2656 has been executed. Today, the market is forming a correction to the level of 1.2760. After reaching this level, we will consider the beginning of a decline to 1.2670. With the breakdown of this level, the potential of the wave will open to the level of 1.2576, a local target. Further, a correction wave to 1.2670 is possible (testing from below). Then, we will consider the beginning of a wave of decline to 1.2486, the main target. Technically, this scenario is confirmed by the MACD indicator. Its signal line is below the zero mark and continues developing the decline structure to new lows.
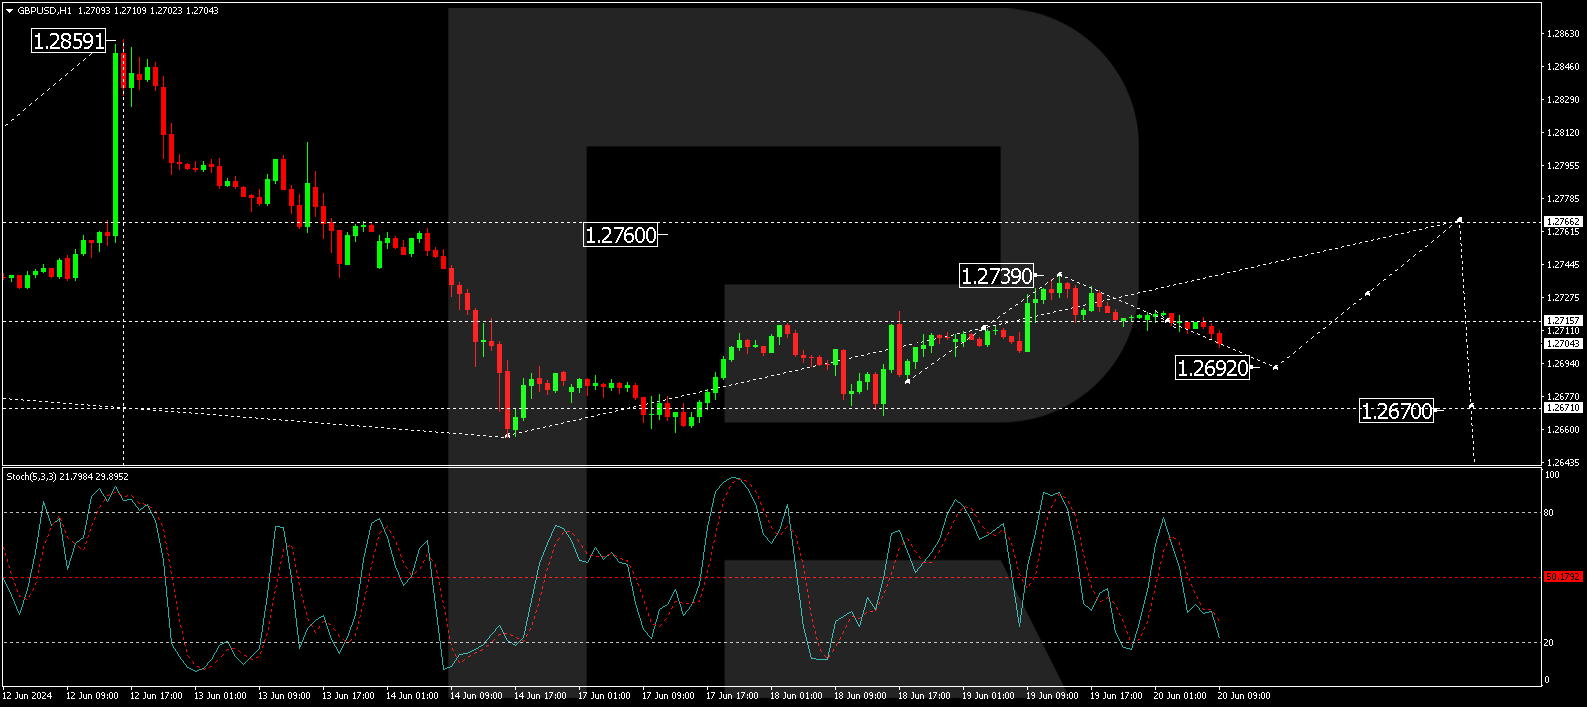
On the H1 GBP/USD chart, a correction wave was performed to 1.2739, and the decline structure to 1.2692 is forming today. After working out this level, let’s consider the growth probability towards 1.2760. At this point, the correction potential will be exhausted. After the correction is completed, we will consider the beginning of a new wave of decline to 1.2670. Technically, this scenario is confirmed by the Stochastic oscillator. Its signal line is below the zero level and continues to decline to the level of 20.
Disclaimer
Any forecasts contained herein are based on the author’s particular opinion. This analysis may not be treated as trading advice. RoboForex bears no responsibility for trading results based on trading recommendations and reviews contained herein.

- Investors run to safe-haven assets amid Middle East escalation Mar 6, 2026
- EUR/USD Under Pressure: Middle East Risks Outweigh All Else Mar 6, 2026
- Bitcoin shows resilience to Middle East events. Oil market stabilizes Mar 5, 2026
- GBP/USD: Market Not Expecting BoE Rate Cut in March Mar 5, 2026
- Brent headed for $100? Mar 4, 2026
- Global stock indices continue sell-off due to Middle East conflict Mar 4, 2026
- USD/JPY to Quickly Return to Growth: Momentum Favours the US Dollar Mar 4, 2026
- European equities plunge amid Persian Gulf military conflict Mar 3, 2026
- Gold Rallies for Fifth Day, With External Risks Mounting Mar 3, 2026
- Iran Crisis: A Dangerous Turning Point Mar 2, 2026