
By RoboForex Analytical Department
The Australian dollar has momentarily halted its downward trajectory against the US dollar, stabilizing around the 0.6565 mark. With a lack of significant domestic data from Australia, the AUD’s movements are largely influenced by the performance of the Chinese yuan and economic developments from China. Recently, the offshore yuan weakened to its lowest in a week at 7.2 against the US dollar, following a series of macroeconomic updates from China.
China’s industrial output showed an impressive year-on-year increase of 7.0%, exceeding both the anticipated 6.5% growth and the previous rate of 4.6%. Capital investment also outperformed expectations, registering a 4.2% year-on-year rise compared to the forecasted 3.2%. Retail sales growth in February was reported at 5.5% year-on-year, albeit a slowdown from January’s 7.4% increase. Additionally, the January employment report indicated a slight uptick in unemployment, rising to 5.3% from the prior 5.1%.
Despite these positive indicators from China, the yuan’s valuation remains pressured by robust US inflation data, which complicates the Federal Reserve’s pathway to easing monetary policy. The prevailing market expectation now leans towards a potential 25 basis point rate cut by the Fed in June, with around a 60% probability of this outcome, a shift from earlier predictions of a spring rate cut.
Given Australia’s close economic and trade ties with China, these statistics from China are particularly significant for the AUD’s performance.
Technical analysis of AUD/USD
Free Reports:
 Download Our Metatrader 4 Indicators – Put Our Free MetaTrader 4 Custom Indicators on your charts when you join our Weekly Newsletter
 Get our Weekly Commitment of Traders Reports - See where the biggest traders (Hedge Funds and Commercial Hedgers) are positioned in the futures markets on a weekly basis.
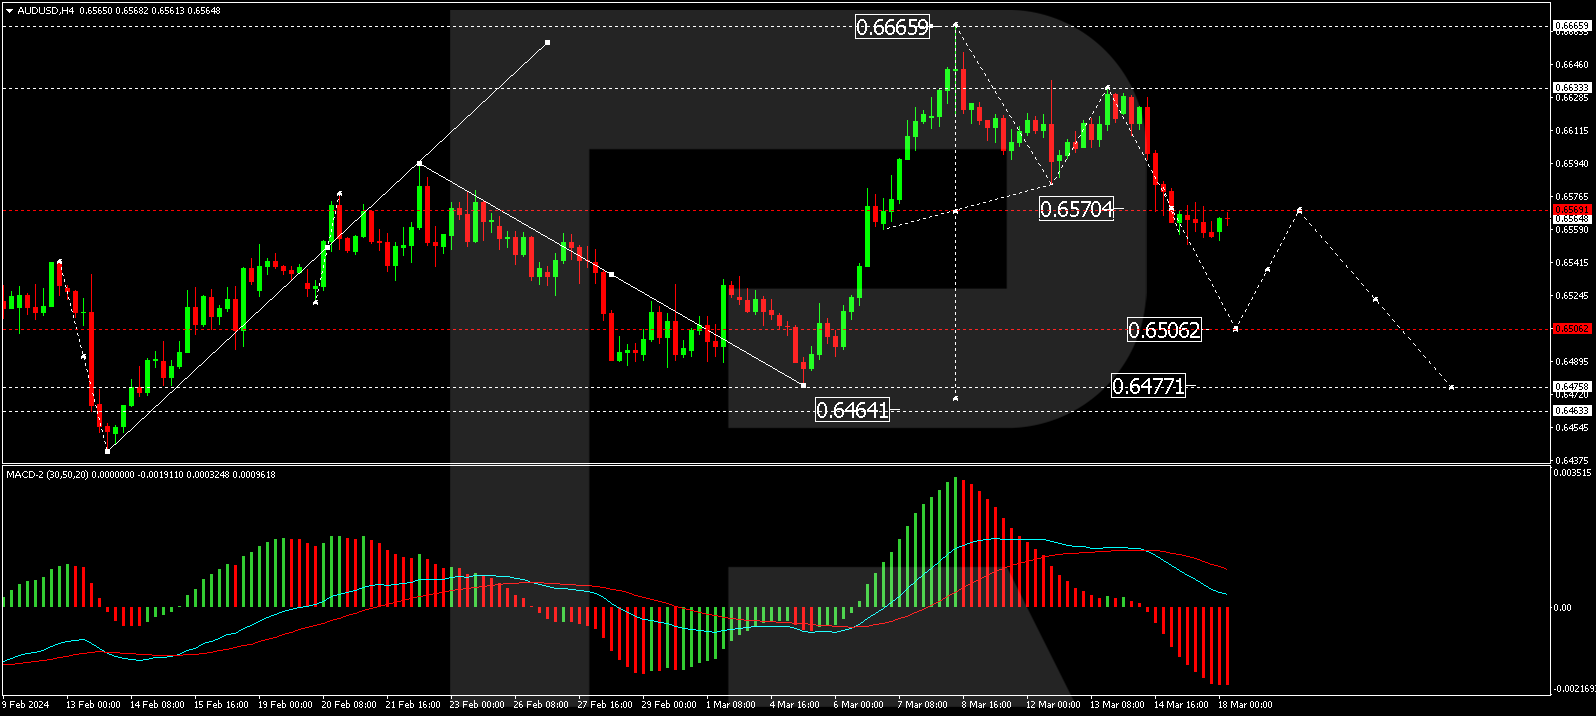
The H4 chart analysis of AUD/USD indicates a consolidation phase around the 0.6570 level, with expectations of a downward breakout leading to the continuation of the decline towards the local target of 0.6506. After reaching this target, a potential corrective movement to 0.6570 (testing from below), followed by a further drop to 0.6477, is anticipated. The MACD indicator, with its signal line pointing downwards, supports this bearish scenario.
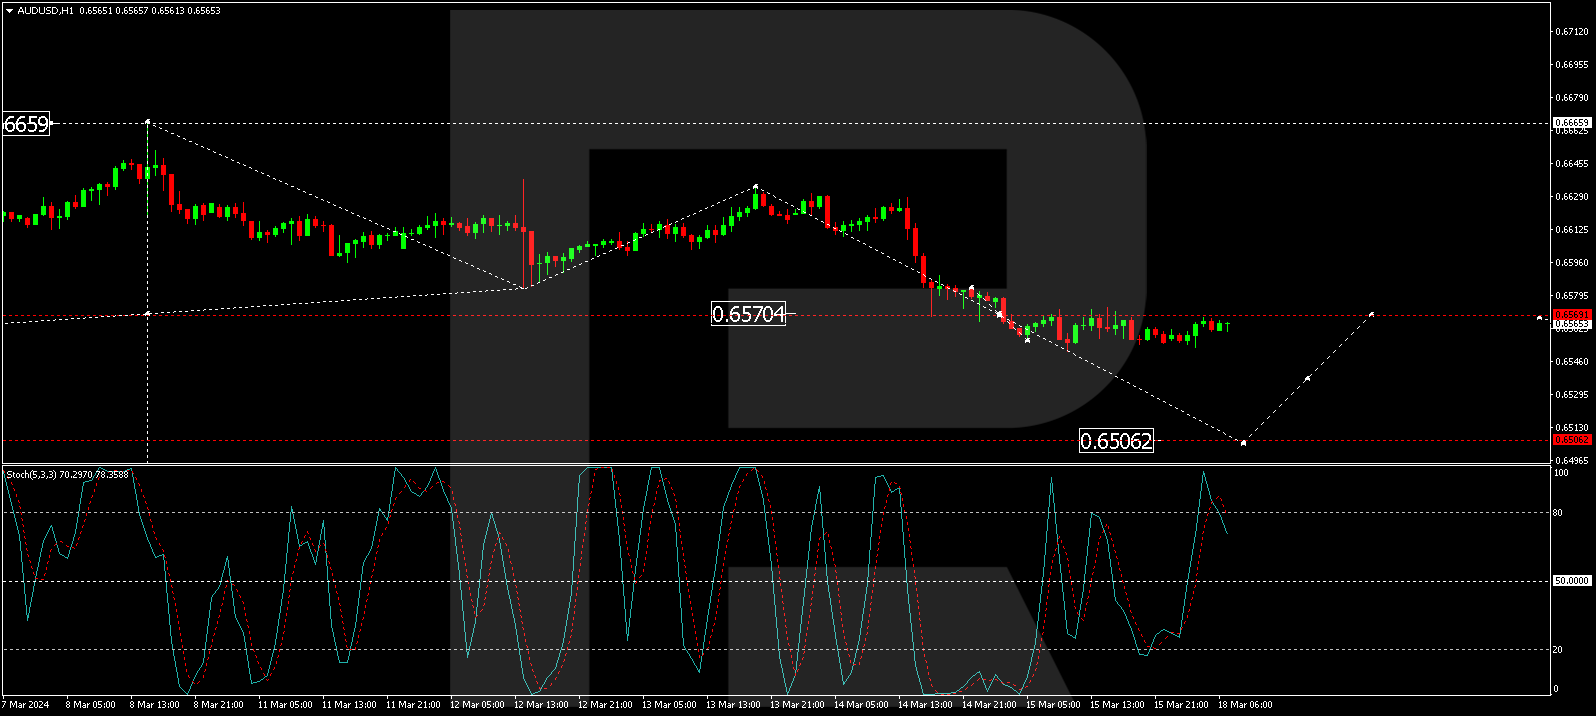
On the H1 chart, the AUD/USD pair has concluded its declining wave structure at 0.6570, with a consolidation phase currently observed around this mark. A downward breakout from this consolidation is expected today, aiming for the 0.6506 level. Upon achieving this target, the onset of a corrective phase to 0.6570 (testing from below) may be considered. The Stochastic oscillator, currently above 80 and poised to descend to 20, corroborates the likelihood of this continuation in the bearish trend.
Disclaimer
Any forecasts contained herein are based on the author’s particular opinion. This analysis may not be treated as trading advice. RoboForex bears no responsibility for trading results based on trading recommendations and reviews contained herein.

- The Bank of Canada kept its interest rate unchanged. Platinum prices reached a three‑week high Jul 16, 2026
- Stock indices rose after the release of US inflation data. China’s GDP slowed sharply Jul 15, 2026
- GBP/USD Awaits Political News: What Will Happen Next Jul 15, 2026
- USD/JPY Holds at Highs: Pressure Lingers on Yen Jul 14, 2026
- Oil prices jumped 4% amid a new wave of escalation between the US and Iran Jul 13, 2026
- EUR/USD: US Inflation Will Determine Everything Jul 13, 2026
- COT Metals Charts: Weekly Speculator Bets see small gains for Silver & Gold Jul 12, 2026
- COT Bonds Charts: Speculator Bets led by SOFR 3-Months & 2-Year Bonds Jul 12, 2026
- COT Energy Charts: Weekly Speculator Changes led by Brent Oil Jul 12, 2026
- COT Soft Commodities Charts: Weekly Speculator Changes led by Sugar, Corn & Soybeans Jul 12, 2026