
By RoboForex Analytical Department
The EUR/USD currency pair remains steadfast near 1.0710 on Tuesday, maintaining proximity to the six-week highs set the previous day.
The U.S. dollar has seen a tempered performance, influenced by recent U.S. labor market statistics for October and the resultant stock market adjustments. The data pointed to pockets of weakness in the employment sector, leading investors to infer that the cooling may be an effect of tighter credit and monetary policies. Consequently, there has been a recalibration of expectations regarding the trajectory of future Federal Reserve rate hikes.
In detail, the U.S. unemployment rate edged up to 3.9%, slightly higher than the previous 3.8%. Nonfarm payrolls showed an increase of 150 thousand, which was shy of the forecasted 178 thousand. Additionally, the average wage increment was a modest 0.2% month-over-month, missing the anticipated mark.
Market sentiment now appears to lean towards the belief that the current interest rates may represent the zenith of the present monetary tightening cycle.
EUR/USD technical analysis
Free Reports:
 Sign Up for Our Stock Market Newsletter – Get updated on News, Charts & Rankings of Public Companies when you join our Stocks Newsletter
 Get our Weekly Commitment of Traders Reports - See where the biggest traders (Hedge Funds and Commercial Hedgers) are positioned in the futures markets on a weekly basis.
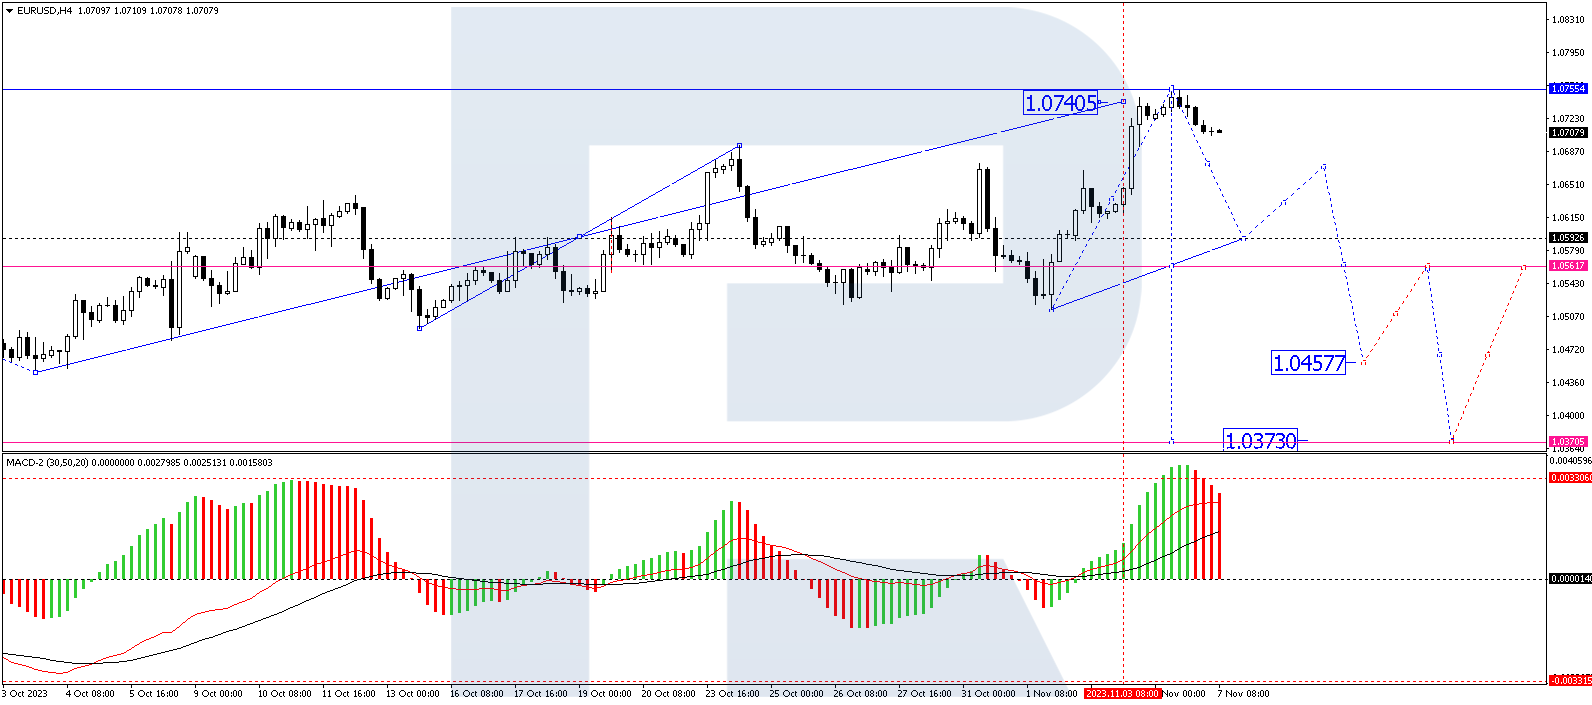
On the H4 chart for EUR/USD, the currency pair has attained the correctional target at 1.0755. The trend now seems to be tilting downwards, with a trajectory set towards the 1.0655 level. A consolidation phase around this mark is probable. A break below this consolidation could signal a further decline to 1.0633, and potentially, should this support give way, a fall to 1.0515 could be on the horizon. The MACD indicator suggests a peak formation, with its signal line at the highs and anticipating a downturn.
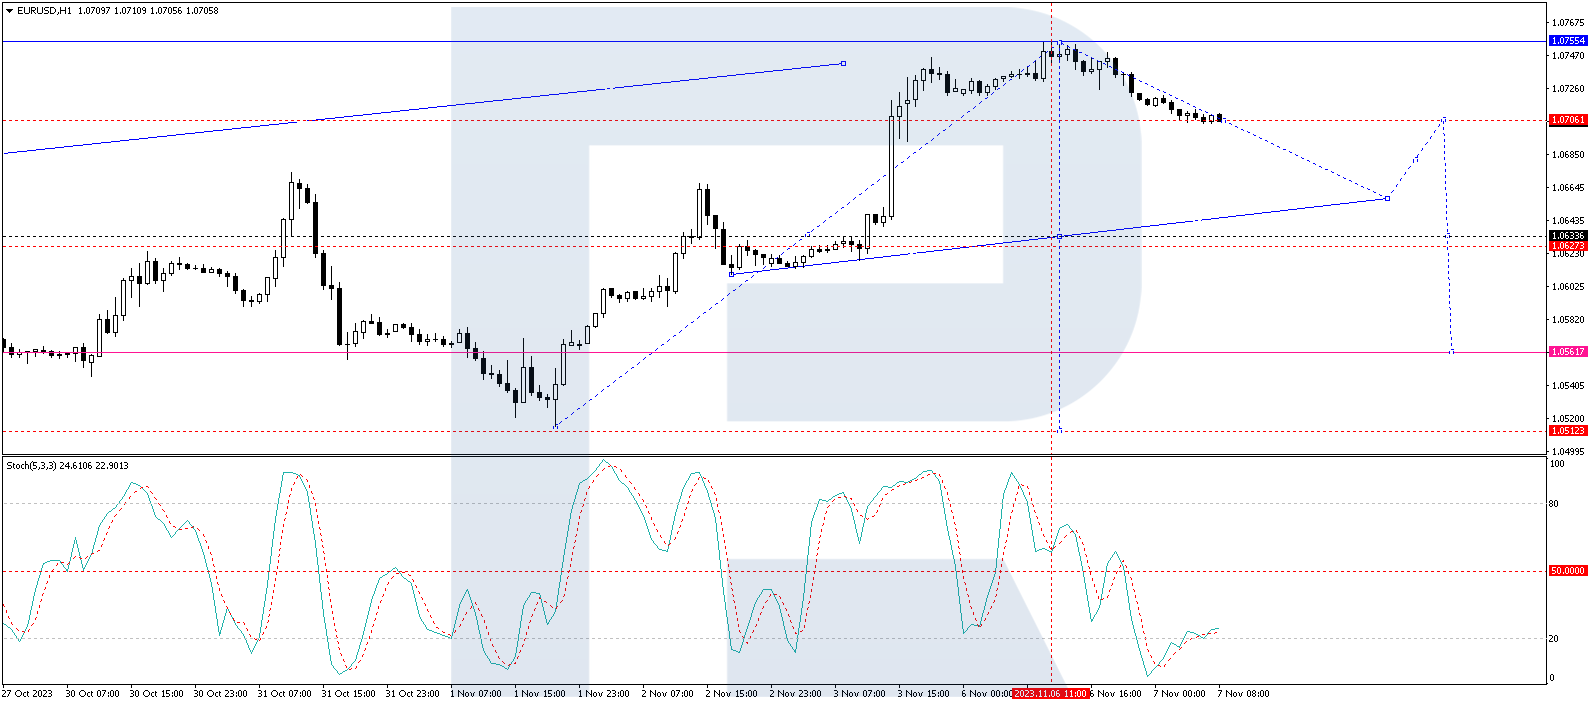
The H1 chart reveals a continuation of the downward wave targeting 1.0655. Should the pair touch this level, a corrective move upwards to around 1.0700 might ensue. Subsequent to this correction, the market may witness a renewed descent towards 1.0633. The Stochastic oscillator provides technical affirmation for this bearish outlook, with its signal line dropping below 50 and aiming for the 20 level.
Disclaimer
Any forecasts contained herein are based on the author’s particular opinion. This analysis may not be treated as trading advice. RoboForex bears no responsibility for trading results based on trading recommendations and reviews contained herein.

- Results in Line for Most Reporting Companies Aug 5, 2026
- Stock indices continue to break records. Oil is falling amid intensified diplomatic dialogue between the US and Iran Aug 5, 2026
- USD/JPY Holds Steady After Intervention: Outlook Remains Uncertain Aug 5, 2026
- EUR/USD: Busy Week Ahead Aug 3, 2026
- Positive sentiment in the AI sector supported stock indices. Oil prices remain volatile Aug 3, 2026
- The Tech‑heavy NASDAQ Index jumped by more than 3.3%. The offshore yuan is trading at its highest level since 2023 Jul 31, 2026
- USD/JPY After Volatility: Multiple Events in One Day Jul 31, 2026
- The US indices sell off amid renewed US-Iran clashes. Oil jumps by 7% Jul 30, 2026
- USD/JPY Temporary in Equilibrium: Multiple Factors in Focus Jul 30, 2026
- GBP/USD at Month’s Lows: The Outlook Remains Weak Jul 29, 2026
