
By RoboForex Analytical Department
The Euro has halted its three-week decline, finding local support at 1.0900.
Despite the European Central Bank’s (ECB) latest interest rate hike to 4.25% on 27 July, the Euro is weakening against the US Dollar. Over the past three weeks, the EURUSD pair has retreated from its highs near 1.1300 to around 1.0900.
On Friday, US employment market data was released, slightly falling short of expert predictions: the Nonfarm Payrolls (NFP) indicator registered a figure of 187 thousand compared to the market’s projected 200 thousand. Consequently, the Dollar weakened against the Euro, causing the EURUSD pair to recover from its lows around 1.0900 to surpass 1.1000.
The key driver for heightened market volatility this week will be the forthcoming US Consumer Price Index (CPI) data, due for release on Thursday. Should the data surpass forecasts, the Euro’s decline may continue; conversely, weaker data could give the Euro reason to rise.
Technical analysis for the EUR/USD currency pair
Free Reports:
 Get our Weekly Commitment of Traders Reports - See where the biggest traders (Hedge Funds and Commercial Hedgers) are positioned in the futures markets on a weekly basis.
 Download Our Metatrader 4 Indicators – Put Our Free MetaTrader 4 Custom Indicators on your charts when you join our Weekly Newsletter
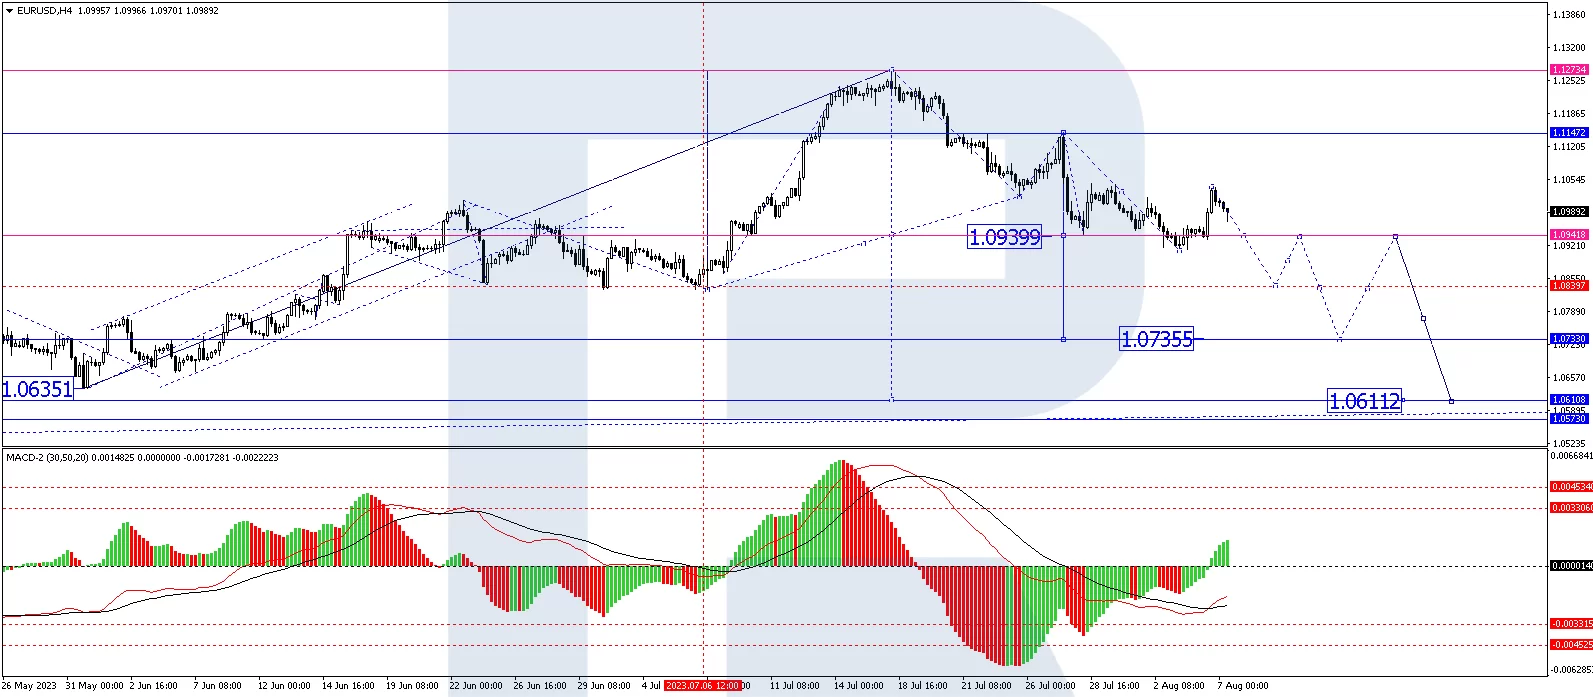
On the H4 chart, EUR/USD completed a corrective wave to the 1.1040 level and started to develop another wave of decline. The 1.0941 level could be reached. A downward breakout of this level will open the potential for a wave of decline to 1.0840. Once the price hits this level, a link of growth to 1.0940 (a test from below) is expected, followed by a decline to 1.0735. This is a local target. Technically, the MACD indicator confirms this scenario with its signal line below the zero mark. The price is expected to return to it and continue falling to new lows.
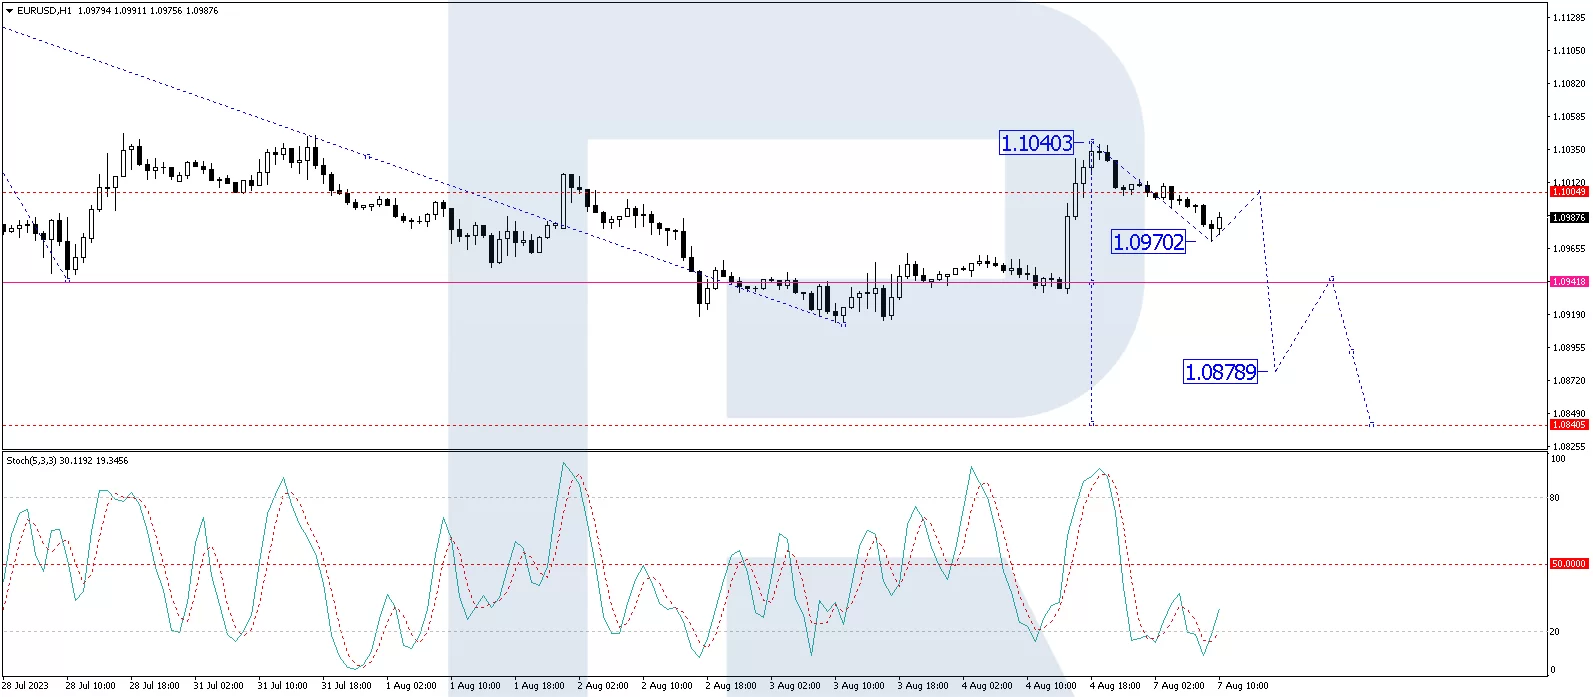
On the H1 chart, EUR/USD has completed an impulse of decline to the 1.1005 level. A consolidation range has formed around it today, and with a downward breakout, the price has declined to 1.0970. A link of correction to 1.1005 (a test from below) could form, followed by another wave of decline to 1.0940. A downward breakout of this level will open the potential for a wave of decline to 1.0878. Technically, the Stochastic oscillator also supports this outlook, with its signal line having broken the 20 mark upwards and continuing to rise to 50.
Disclaimer
Any forecasts contained herein are based on the author’s particular opinion. This analysis may not be treated as trading advice. RoboForex bears no responsibility for trading results based on trading recommendations and reviews contained herein.

- The Tech‑heavy NASDAQ Index jumped by more than 3.3%. The offshore yuan is trading at its highest level since 2023 Jul 31, 2026
- USD/JPY After Volatility: Multiple Events in One Day Jul 31, 2026
- The US indices sell off amid renewed US-Iran clashes. Oil jumps by 7% Jul 30, 2026
- USD/JPY Temporary in Equilibrium: Multiple Factors in Focus Jul 30, 2026
- GBP/USD at Month’s Lows: The Outlook Remains Weak Jul 29, 2026
- Crude oil falls below $80 per barrel. Australia sees inflation slowdown Jul 29, 2026
- The US Tech sector hit by sell‑off. Oil prices decline on renewed negotiations Jul 28, 2026
- Gold Declines, Focus on Fed and Falling Oil Prices Jul 28, 2026
- This week will be one of the most crowded for central‑bank meetings Jul 27, 2026
- EUR/USD Ahead of a Key Week: Holding Near Lows Jul 27, 2026