Source: Clive Maund (12/28/22)
Technical analyst Clive Maund reviews Algernon Pharmaceuticals Inc.’s 6-month, 3-year, and 9-year charts to tell you whether you should be interested in this pharma company.
Another stock that appears to be at stony rock bottom is Algernon Pharmaceuticals Inc. (AGN:CSE; AGNPF:OTCQB; AGN0:XFRA), and it has two things going for it — one is that it could come out with positive news at any time that could get it moving and the other is that, with only 2.3 million shares in issue, when it does move it is likely to result in big percentage gains, as happened back last January when it rocketed from CA$4 to CA$12 in a matter of a couple of weeks, a move which we rode.
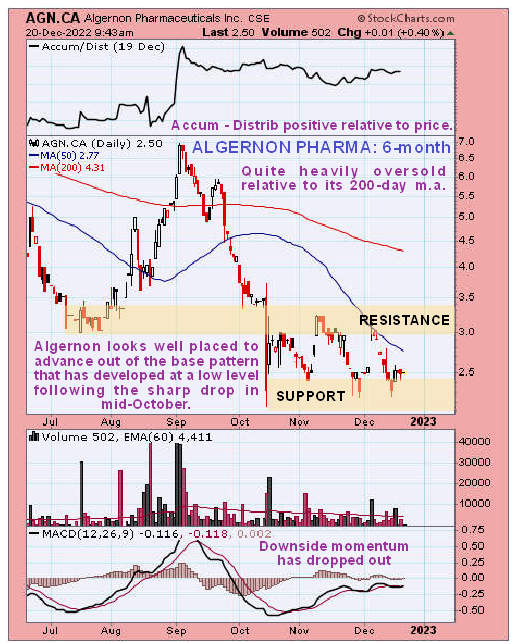
On its 6-month chart, we can see that after dropping hard in mid-October, it has marked out a low trading range that has allowed downside momentum to drop out and the 50-day moving average has dropped down close to the price, in the process opening up a quite large gap between it and the 200-day and these factors taken together make a rally soon increasingly likely with the relatively strong Accumulation line over the past several months being another positive factor.

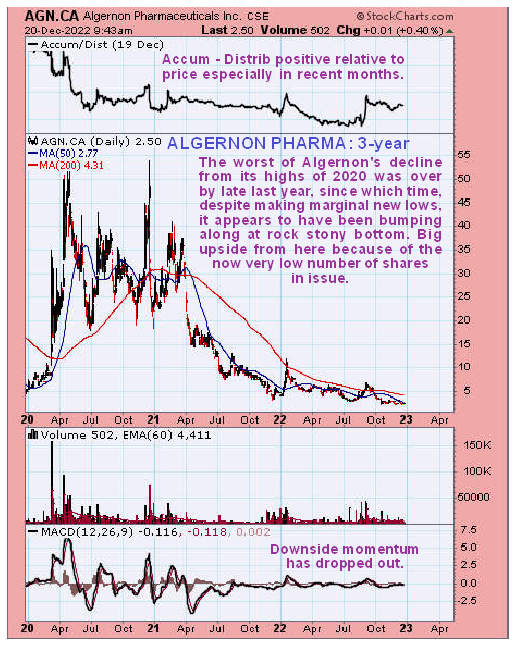
Zooming out on a 3-year chart enables us to put recent action in more perspective (note that this chart and the 9-year we are also looking at have been adjusted for a one-for-100-share rollback about a year ago, which explains the low number of shares in issue).
Free Reports:
 Get our Weekly Commitment of Traders Reports - See where the biggest traders (Hedge Funds and Commercial Hedgers) are positioned in the futures markets on a weekly basis.
 Download Our Metatrader 4 Indicators – Put Our Free MetaTrader 4 Custom Indicators on your charts when you join our Weekly Newsletter
On this chart, we see that Algernon is now extraordinarily cheap as it has dropped back from a peak at over CA$53 in 2020 to the current miserly price of CA$2.50. The worst decline was behind it by late last year, since which time, although it has continued to make new lows, the rate of decline has slowed, with, as mentioned above, the Accumulation line showing a marked positive divergence in recent months.

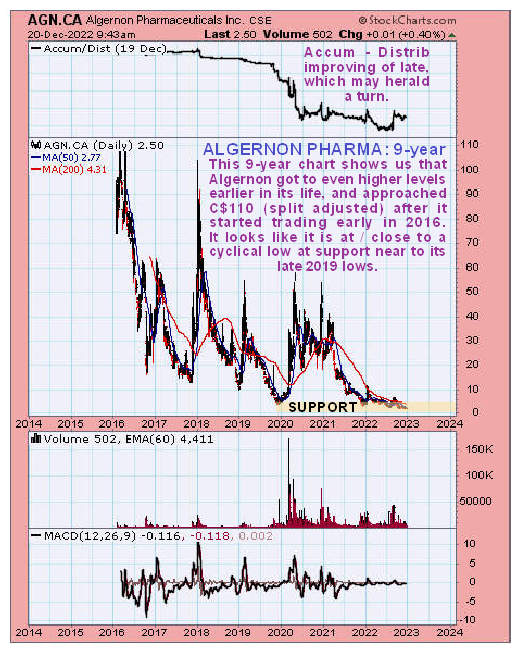
The 9-year chart shows us the entire history of the stock, and on this chart, we see that it got to even higher levels than we saw in 2020, as back in 2016, shortly after it started trading, it got close to CA$110 and at the start of 2018 it spiked to about CA$103.
It looks like it is making a cyclical low here, close to the late 2019 lows.

Even without factoring in the extremely low number of shares in issue, Algernon looks like it is at a low here with a very favorable risk/reward ratio, which is magnified enormously by the low number of shares in issue, as any good news coming through – and there is believed to be some coming through soon — could see it take off strongly higher.
Algernon is therefore rated a strong speculative Buy here.
Algernon Pharmaceuticals’ website
Algernon Pharmaceuticals Inc. closed at CA$2.50, $1.76 on December 20, 2022.
CliveMaund.com Disclosures
The above represents the opinion and analysis of Mr. Maund, based on data available to him, at the time of writing. Mr. Maund’s opinions are his own, and are not a recommendation or an offer to buy or sell securities. Mr. Maund is an independent analyst who receives no compensation of any kind from any groups, individuals or corporations mentioned in his reports. As trading and investing in any financial markets may involve serious risk of loss, Mr. Maund recommends that you consult with a qualified investment advisor, one licensed by appropriate regulatory agencies in your legal jurisdiction and do your own due diligence and research when making any kind of a transaction with financial ramifications. Although a qualified and experienced stock market analyst, Clive Maund is not a Registered Securities Advisor. Therefore Mr. Maund’s opinions on the market and stocks can only be construed as a solicitation to buy and sell securities when they are subject to the prior approval and endorsement of a Registered Securities Advisor operating in accordance with the appropriate regulations in your area of jurisdiction.
Disclosures:
1) Clive Maund: I, or members of my immediate household or family, own securities of the following companies mentioned in this article: None. I personally am, or members of my immediate household or family are, paid by the following companies mentioned in this article: None.
2) The following companies mentioned in this article are billboard sponsors of Streetwise Reports: Algernon Pharmaceuticals Inc. Click here for important disclosures about sponsor fees. As of the date of this article, an affiliate of Streetwise Reports has a consulting relationship with Algernon Pharmaceuticals Inc. Please click here for more information.
3) Statements and opinions expressed are the opinions of the author and not of Streetwise Reports or its officers. The author is wholly responsible for the validity of the statements. The author was not paid by Streetwise Reports for this article. Streetwise Reports was not paid by the author to publish or syndicate this article. Streetwise Reports requires contributing authors to disclose any shareholdings in, or economic relationships with, companies that they write about. Streetwise Reports relies upon the authors to accurately provide this information and Streetwise Reports has no means of verifying its accuracy.
4) This article does not constitute investment advice. Each reader is encouraged to consult with his or her individual financial professional and any action a reader takes as a result of information presented here is his or her own responsibility. By opening this page, each reader accepts and agrees to Streetwise Reports’ terms of use and full legal disclaimer. This article is not a solicitation for investment. Streetwise Reports does not render general or specific investment advice and the information on Streetwise Reports should not be considered a recommendation to buy or sell any security. Streetwise Reports does not endorse or recommend the business, products, services or securities of any company mentioned on Streetwise Reports.
5) From time to time, Streetwise Reports LLC and its directors, officers, employees or members of their families, as well as persons interviewed for articles and interviews on the site, may have a long or short position in securities mentioned. Directors, officers, employees or members of their immediate families are prohibited from making purchases and/or sales of those securities in the open market or otherwise from the time of the decision to publish an article until three business days after the publication of the article. The foregoing prohibition does not apply to articles that in substance only restate previously published company releases. As of the date of this article, officers and/or employees of Streetwise Reports LLC (including members of their household) own securities of Algernon Pharmaceuticals Inc., a company mentioned in this article.
6) This article does not constitute medical advice. Officers, employees and contributors to Streetwise Reports are not licensed medical professionals. Readers should always contact their healthcare professionals for medical advice.

- Canadian dollar declines after weak GDP data. Qatar threatens EU to halt natural gas exports Dec 24, 2024
- Goldman Sachs has updated its economic projections for 2025. EU countries are looking for alternative sources of natural gas Dec 23, 2024
- COT Bonds Charts: Speculator Bets led by SOFR 3-Months & 10-Year Bonds Dec 21, 2024
- COT Metals Charts: Speculator Bets led lower by Gold, Copper & Palladium Dec 21, 2024
- COT Soft Commodities Charts: Speculator Bets led by Live Cattle, Lean Hogs & Coffee Dec 21, 2024
- COT Stock Market Charts: Speculator Bets led by S&P500 & Russell-2000 Dec 21, 2024
- Riksbank and Banxico cut interest rates by 0.25%. BoE, Norges Bank, and PBoC left rates unchanged Dec 20, 2024
- Brent Oil Under Pressure Again: USD and China in Focus Dec 20, 2024
- Market round-up: BoE & BoJ hold, Fed delivers ‘hawkish’ cut Dec 19, 2024
- NZD/USD at a New Low: The Problem is the US Dollar and Local GDP Dec 19, 2024
