
Article By RoboForex.com
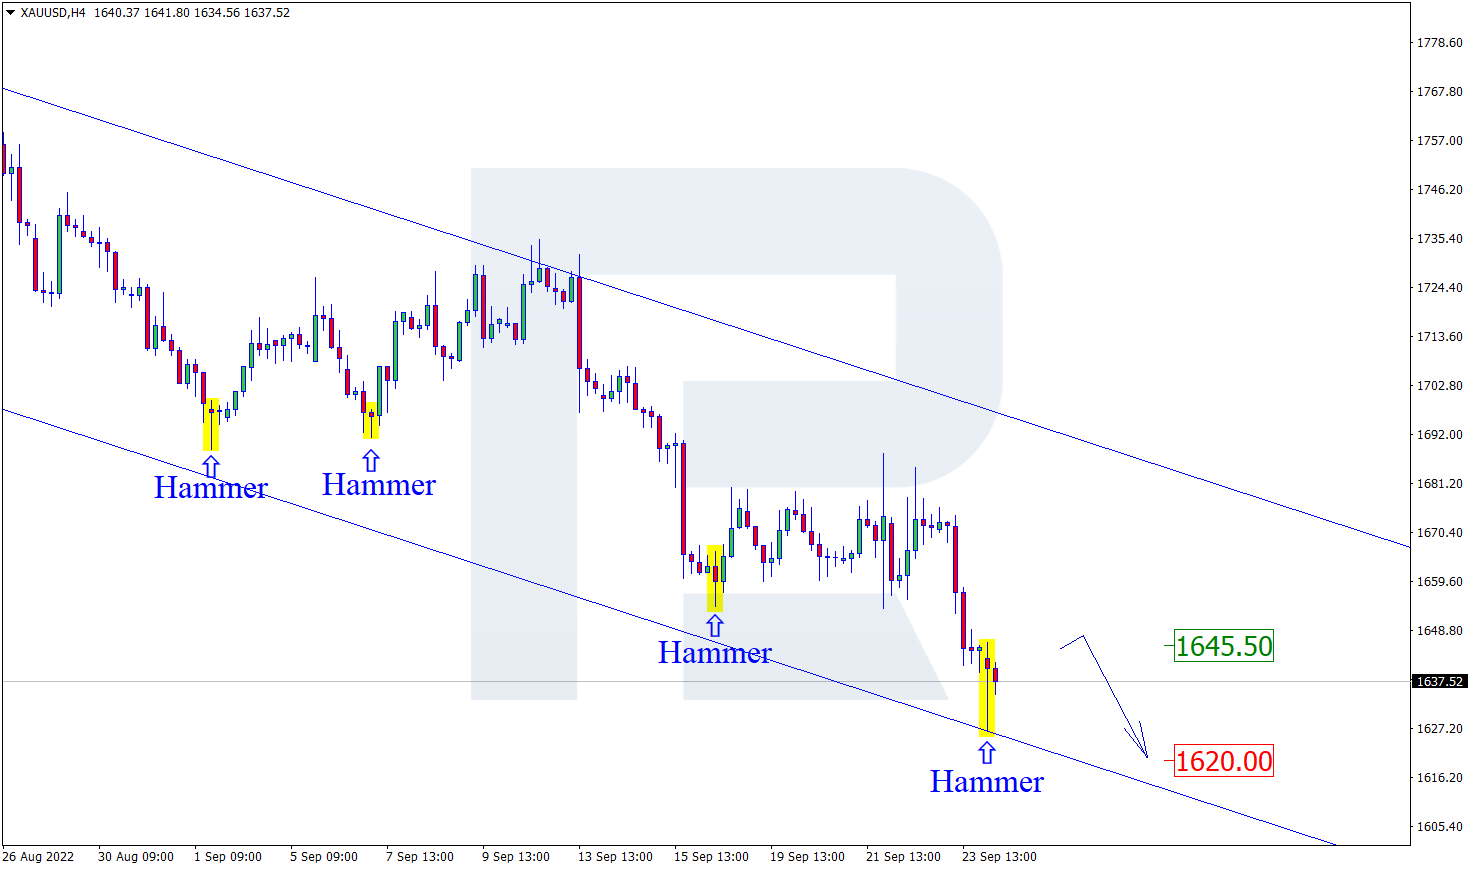
XAUUSD, “Gold vs US Dollar”
As we can see in the H4 chart, XAUUSD has formed a Hammer reversal pattern not far from the support area. At the moment, the asset may reverse in the form of a new ascending impulse. In this case, the upside correctional target may be at 1645.00. At the same time, the opposite scenario implies that the price may continue falling to reach 1620.00 without any pullbacks up to the resistance level.

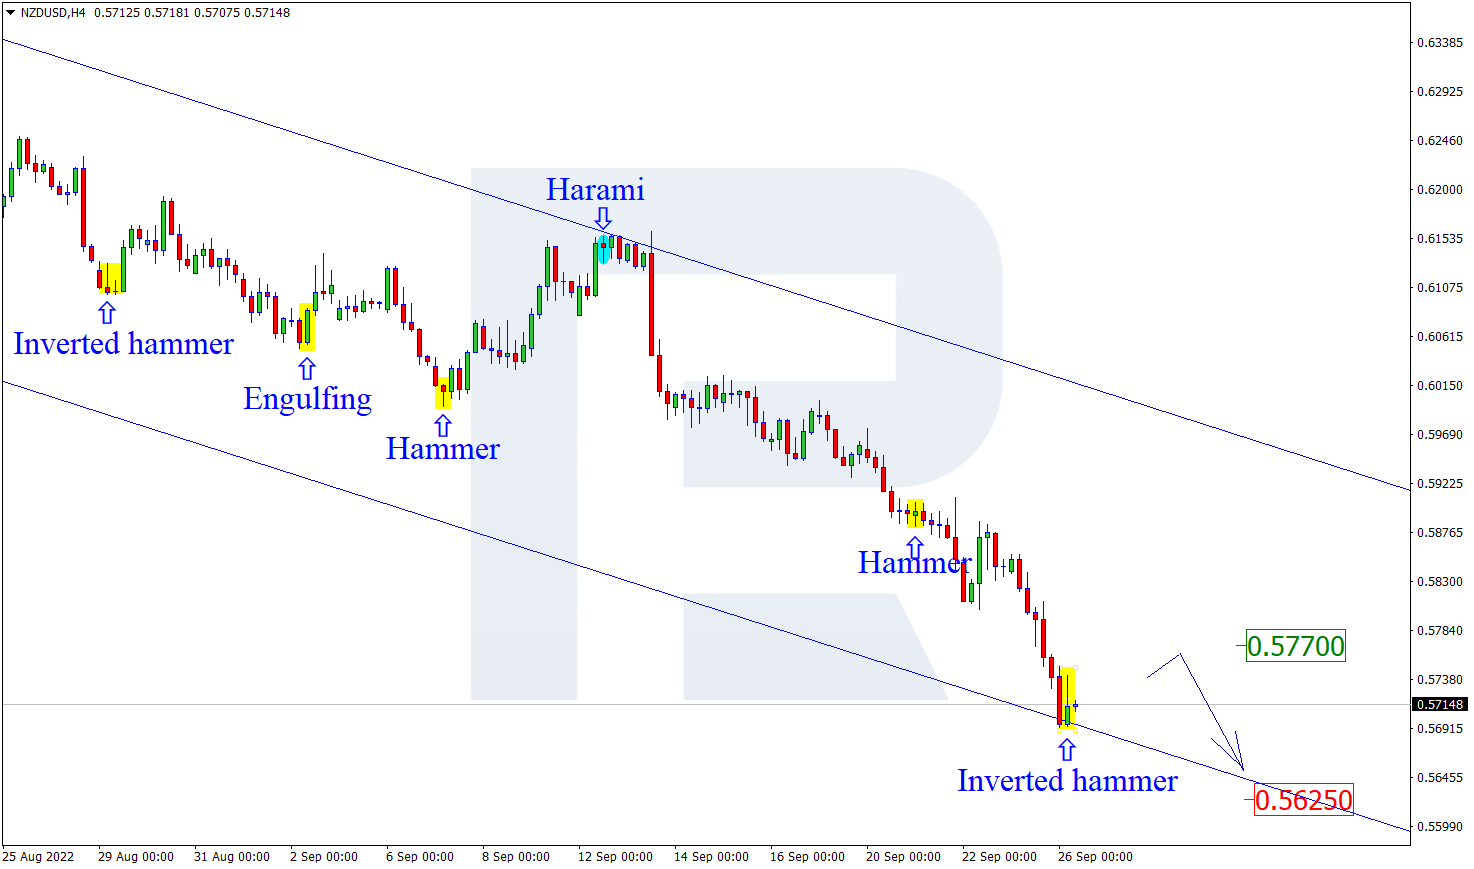
NZDUSD, “New Zealand vs US Dollar”
As we can see in the H4 chart, NZDUSD has formed an Inverted Hammer reversal pattern close to the support level. At the moment, the asset is reversing in the form of another ascending wave. In this case, the upside correctional target may be at 0.5770. After that, the asset may rebound from the resistance area and resume moving downwards. However, an alternative scenario implies that the price may fall to reach 0.5625 without any pullbacks.
Free Reports:
 Sign Up for Our Stock Market Newsletter – Get updated on News, Charts & Rankings of Public Companies when you join our Stocks Newsletter
 Get our Weekly Commitment of Traders Reports - See where the biggest traders (Hedge Funds and Commercial Hedgers) are positioned in the futures markets on a weekly basis.
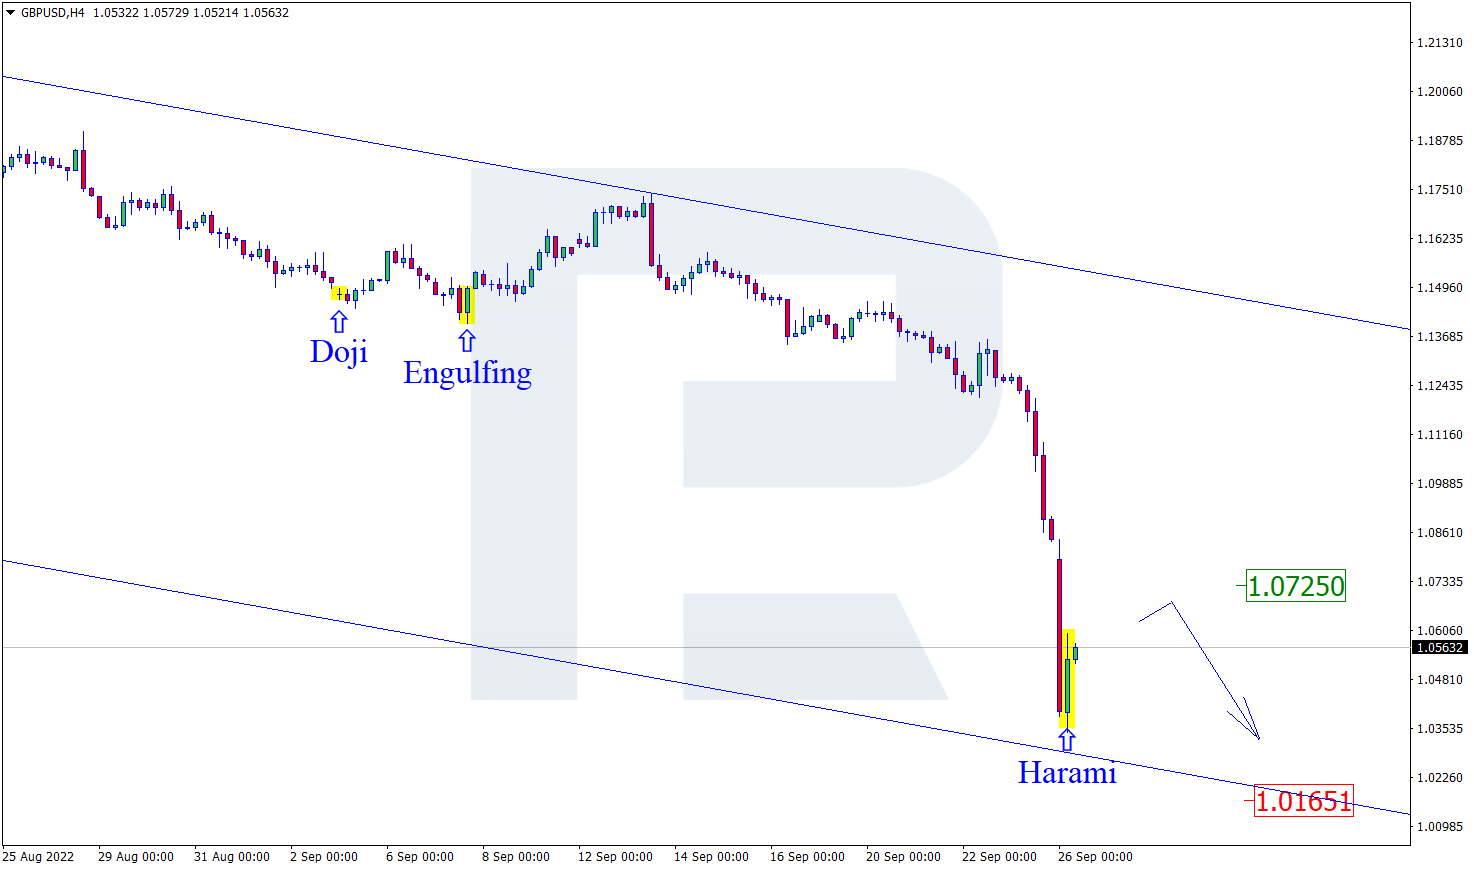
GBPUSD, “Great Britain Pound vs US Dollar”
As we can see in the H4 chart, GBPUSD has formed a Harami reversal pattern near the support level. At the moment, the pair may reverse in the form of a new rising impulse. In this case, the upside target may be the resistance area at 1.0725. Later, the market may rebound from this level and resume falling. Still, there might be an alternative scenario, in which the asset may continue falling to reach the support level at 1.0165 without testing the resistance area.
Article By RoboForex.com
Attention!
Forecasts presented in this section only reflect the author’s private opinion and should not be considered as guidance for trading. RoboForex LP bears no responsibility for trading results based on trading recommendations described in these analytical reviews.

- Investors run to safe-haven assets amid Middle East escalation Mar 6, 2026
- EUR/USD Under Pressure: Middle East Risks Outweigh All Else Mar 6, 2026
- Bitcoin shows resilience to Middle East events. Oil market stabilizes Mar 5, 2026
- GBP/USD: Market Not Expecting BoE Rate Cut in March Mar 5, 2026
- Brent headed for $100? Mar 4, 2026
- Global stock indices continue sell-off due to Middle East conflict Mar 4, 2026
- USD/JPY to Quickly Return to Growth: Momentum Favours the US Dollar Mar 4, 2026
- European equities plunge amid Persian Gulf military conflict Mar 3, 2026
- Gold Rallies for Fifth Day, With External Risks Mounting Mar 3, 2026
- Iran Crisis: A Dangerous Turning Point Mar 2, 2026