
Investors and traders worldwide for several months now have been obsessing over how the Fed intends to go about its ‘quantitative tightening’ a.k.a. QT.
Hold up! What even is QT?
To understand QT, first we must have an idea of QE (quantitative easing).
QE is when a central bank prints money, out of thin air, to support its economy. Recall that the Fed has pumped out trillions of dollars to support markets amid the pandemic.
Without getting bogged down with the complex details on how QE works, here’s a simple form of showing how the money flows:
Free Reports:
 Get our Weekly Commitment of Traders Reports - See where the biggest traders (Hedge Funds and Commercial Hedgers) are positioned in the futures markets on a weekly basis.
 Sign Up for Our Stock Market Newsletter – Get updated on News, Charts & Rankings of Public Companies when you join our Stocks Newsletter
- Fed –> US Treasury Department –> banks/pension funds/financial institutions (via bonds) –> businesses/households (via loans) –> economy/markets
QT is essentially the reversal of the above, with the aim of taking money out of the financial system.
But it doesn’t mean that the money ends back up with the Fed. It just magically “disappears” back into thin air.
Note that, as of March 2022, the Fed’s balance sheet stands at around $8.94 trillion as – that’s more than double the amount it was before the pandemic.
It’s time to wind that down.
So why is the Fed unwinding its balance sheet?
The Fed now believes that markets no longer need as much financial support because the US economy has recovered enough from the pandemic.
- The US unemployment rate for March 2022 reached 3.6%, which is the same rate as December 2019, before the pandemic struck.
- The inflation rate (as measured by the ‘consumer price index’) is forecasted to reach 8.4% in March 2022. If so, that would be the fastest inflation since January 1982.
Why are we talking about this now?
Just yesterday (Wednesday, 6 April 2022), the latest FOMC minutes were released.
The minutes are a document that contains more details about what was discussed between FOMC (Federal Open Market Committee) members when they gather to decide how best to manage the US economy.
During the last FOMC meeting, held on 15-16 March 2022, the Fed discussed its intention to stop buying $1.1 trillion in bonds per year, or US$ 95 billion per month, potentially starting in May 2022.
How much is $1.1 trillion really?
$1,100,000,000,000 =
- about the same amount of money needed to buy the entire Tesla company as valued on April 6th (imagine one whole Tesla being removed from the markets per year.)
- can buy more than three million iPhone 13 Pros (which retails in the US for $999) every single day for an entire year.
That’s how much money the Fed intends to drain out of financial markets.
And this process could begin as early as next month (May 2022).
How might markets react to QT?
The Fed’s withdrawal of financial support could trigger big moves in various asset classes:
- More US dollar strength expected. DXY set to surpass 100.
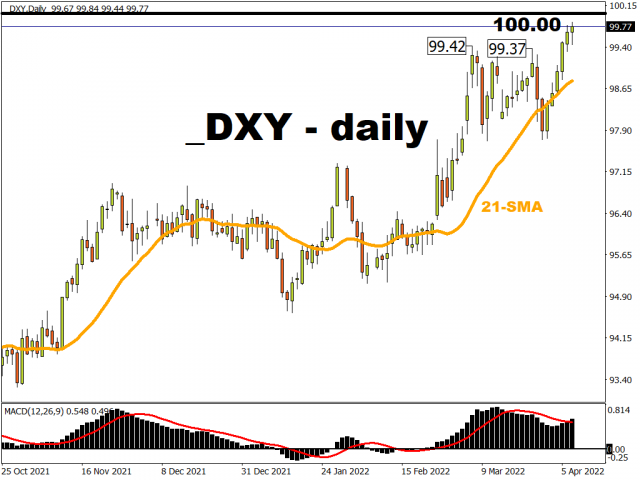
The benchmark DXY is already trading at its highest levels since May 2020.
As the Fed stops re-investing in these bonds (a.k.a quantitative tightening), the overall demand for bonds such as US Treasuries is set to fall.
– As demand drops, so do prices.
– As Treasury prices fall, its yields rise.
– As US yields rise, so too the US dollar.
Keep in mind that the Fed could be in a bid to out-hawk the other hawks, meaning to say the Fed may have to rush ahead of other major central banks (e.g. ECB, BOE etc.) to combat red-hot inflation by unwinding its supportive measures as a faster clip.
And remember, it’s all relative. Hence, the more “hawkish” a central bank sounds over another central bank, then the stronger the currency of the more hawkish-sounding central bank.
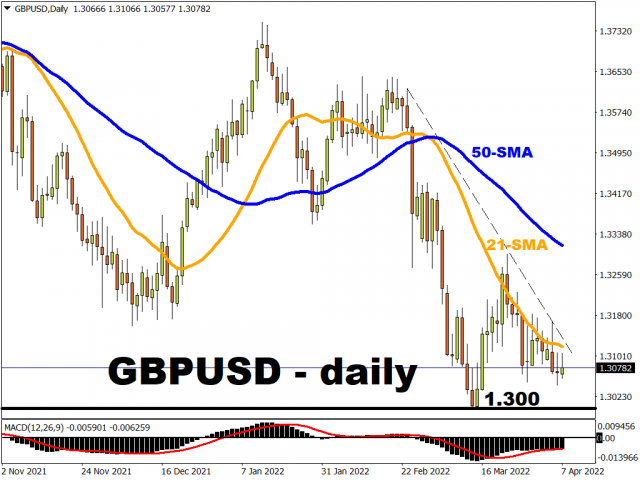
For example, if the US Federal Reserve sounds more hawkish than the Bank of England, then the US dollar is set to gain versus the British Pound, heaping downward pressure on GBPUSD.
- Gold could fall back below $1900 and head towards $1877
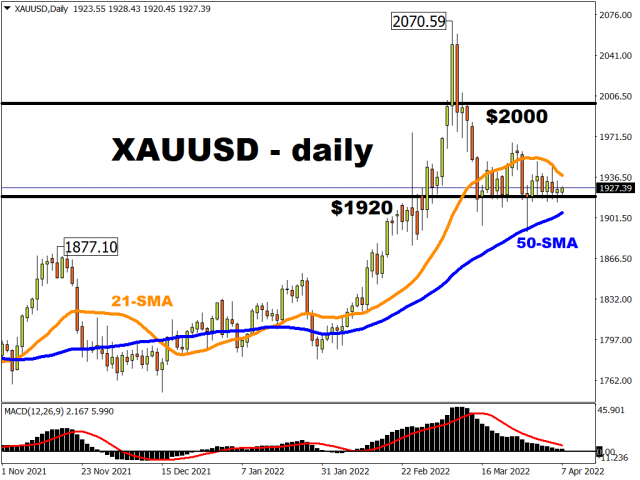
Traditionally, when US interest rates and yields (nominal and real) rise, gold tends to fall.
This is because gold offers zero yields. Hence, investors would have to consider whether to park their money in US Treasuries where yields may rise faster than inflation (protect one’s wealth against inflation eroding one’s purchasing power), or park their money in zero-yielding bullion with mere hopes that gold prices can keep climbing.
However, this traditional relationship between rising yields and lower gold has yet to play out.
Despite struggling to keep its head above its 21-day simple moving average in recent weeks, spot gold remains well supported around the $1920 region, thanks to persistent fears over the global fallout of the Russia-Ukraine war.
If Europe’s security crisis can meaningfully subside, that could put the Fed’s policy tightening plans front and centre as the primary driver of prices.
And that could be the trigger for gold’s leg down, with a sustained presence below $1900 then inviting $1877 as the next key area of interest for gold bears.
- Tech stocks could be dragged lower
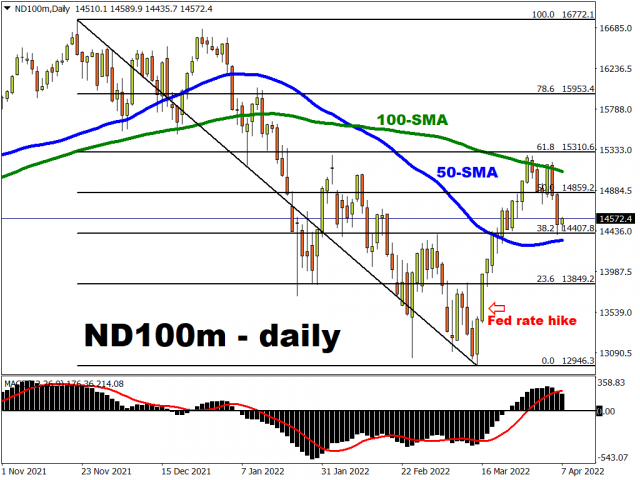
To be fair to tech aficionados, tech stocks have proven remarkably resilient even in the face of the Fed’s policy tightening. The tech-heavy Nasdaq 100 rose by as much as 13% since the Fed’s rate hike last month – its first since December 2018. Perhaps that’s driven by the fact that tech stocks had been beaten down by so much leading up to the March FOMC meeting that many market participants were enticed by the buy-the-dip mantra.
However, that could be as good as it gets for tech stocks over the near-term.
The Nasdaq 100 could retest the psychologically-important 13,000 region, as it did before the last FOMC meeting.
This lurch lower could be fuelled by greater prospects of a more aggressive Fed by way of larger-than-usual rate hikes or a faster drawdown of its balance sheet.
Overall, the Fed has the tricky task of embarking on rate hikes and withdrawing trillions from the markets with breaking the economy and roiling markets – something that’s a lot easier imagined than done.
In short, this could translate into more volatility across various asset classes.
Over the coming months, investors and traders will closely monitor how successful the Fed is at tightening policy (QT and rate hikes).
If it actually triggers a recession instead, that would fundamentally alter the markets outlook going into 2023.
Disclaimer: The content in this article comprises personal opinions and should not be construed as containing personal and/or other investment advice and/or an offer of and/or solicitation for any transactions in financial instruments and/or a guarantee and/or prediction of future performance. ForexTime (FXTM), its affiliates, agents, directors, officers or employees do not guarantee the accuracy, validity, timeliness or completeness, of any information or data made available and assume no liability as to any loss arising from any investment based on the same.
![]() Article by ForexTime
Article by ForexTime
ForexTime Ltd (FXTM) is an award winning international online forex broker regulated by CySEC 185/12 www.forextime.com

- The Eurozone has shown a significant slowdown in inflation. Australia has recorded its largest trade deficit since 2015 Jul 2, 2026
- Natural gas prices are rising amid increasing electricity consumption Jul 1, 2026
- USD/JPY at 40-Year High: Multiple Factors Weigh on the Yen Jul 1, 2026
- Gold Declines: Fed Policy and Geopolitics Weigh Jun 30, 2026
- Oil prices have once again risen above 70 dollars per barrel. The Australian dollar has updated a three‑month low Jun 30, 2026
- EUR/USD: The Advantage Remains with the Dollar Jun 29, 2026
- Escalation of the US–Iran conflict is once again supporting the rise in oil prices Jun 29, 2026
- Oil prices fall back to pre‑war levels. Silver drops to a 7‑month low Jun 25, 2026
- Gold Falls to an Eight-Month Low: This May Not Be the Bottom Jun 25, 2026
- Stock indices came under heavy selling pressure amid growing skepticism about AI investments Jun 24, 2026