
Article By RoboForex.com
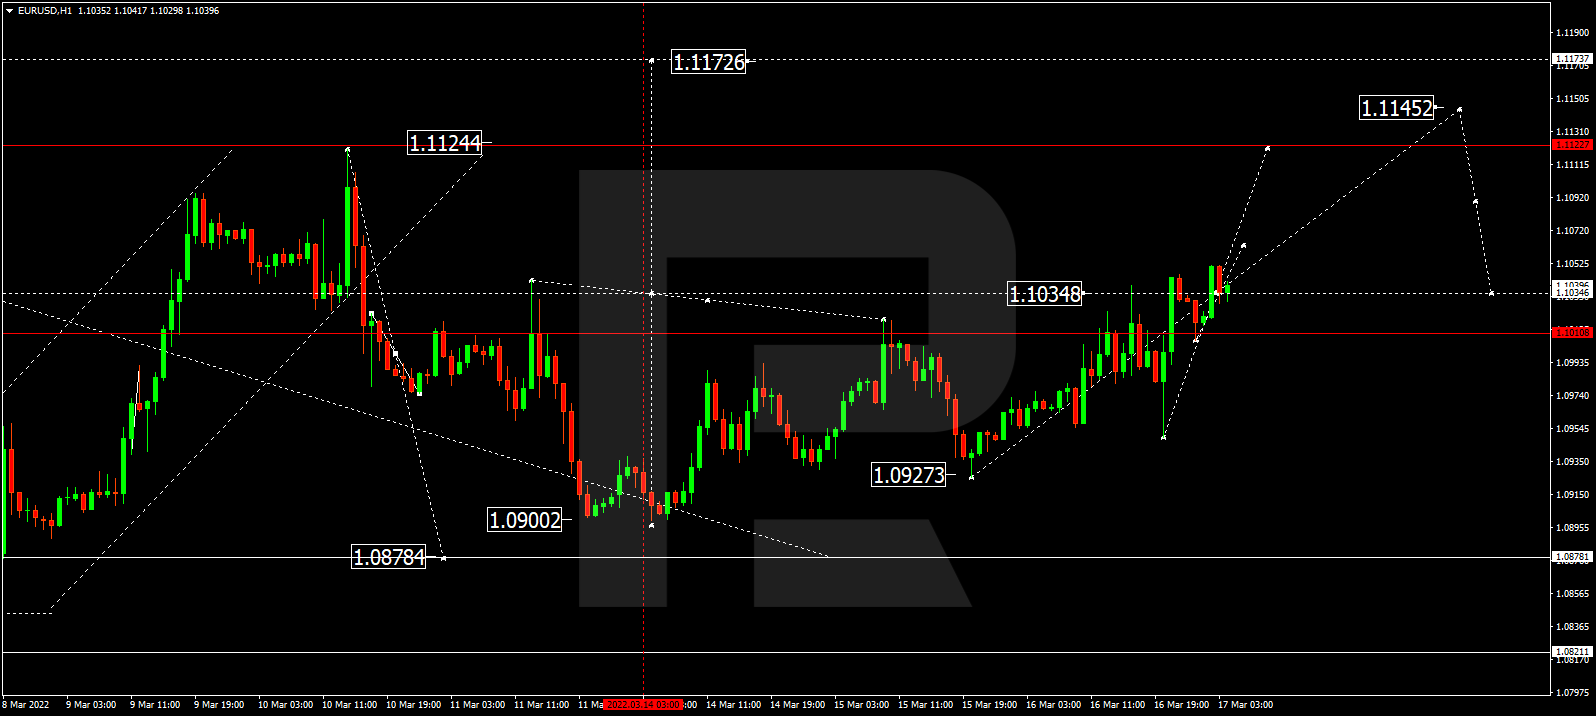
EURUSD, “Euro vs US Dollar”
After rebounding from 1.0927, EURUSD continues growing towards 1.1145. Later, the market may form a new descending structure to reach 1.1034 and then resume trading upwards with the target at 1.1177.

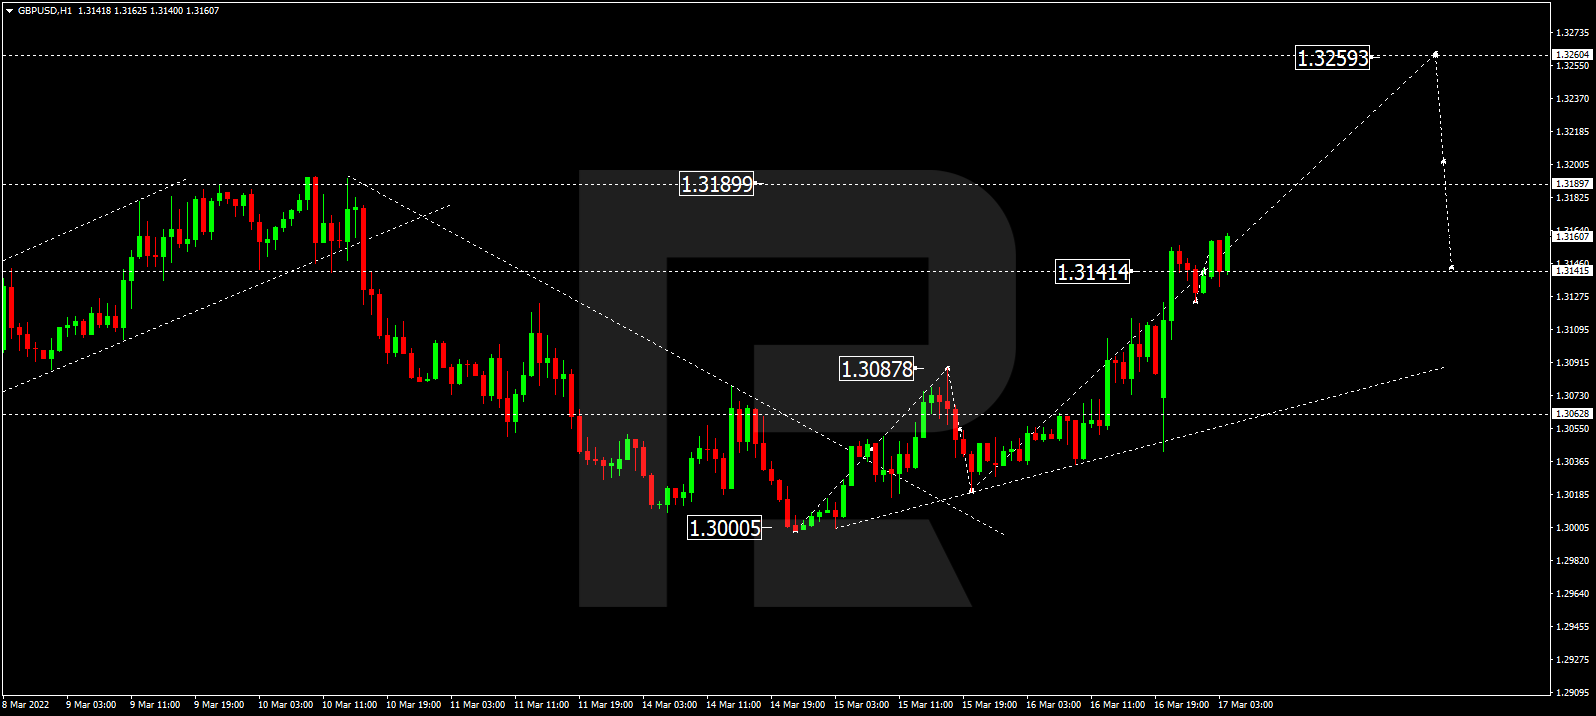
GBPUSD, “Great Britain Pound vs US Dollar”
After finishing the ascending wave at 1.3141, GBPUSD has formed a new consolidation range there. Possibly, the pair may break the range to the upside and form one more ascending wave with the short-term target at 1.3259.
Free Reports:
 Sign Up for Our Stock Market Newsletter – Get updated on News, Charts & Rankings of Public Companies when you join our Stocks Newsletter
 Get our Weekly Commitment of Traders Reports - See where the biggest traders (Hedge Funds and Commercial Hedgers) are positioned in the futures markets on a weekly basis.
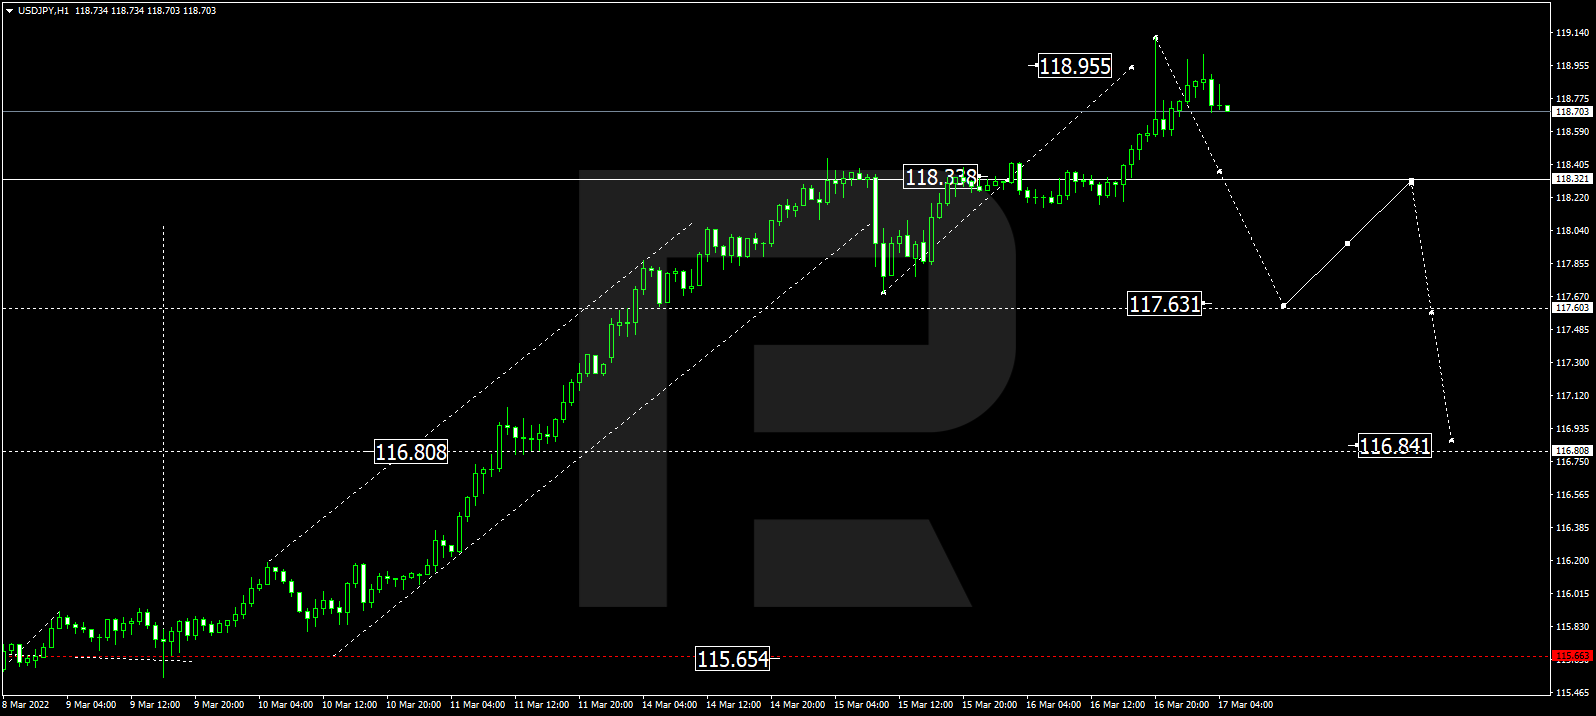
USDJPY, “US Dollar vs Japanese Yen”
After forming a new consolidation range around 118.33, USDJPY has expanded it up to 118.95. Today, the pair may start another decline towards the downside border of the range at 117.63 and then resume growing to return to 118.33. Later, the market may form a new descending wave with the first target at 116.84.
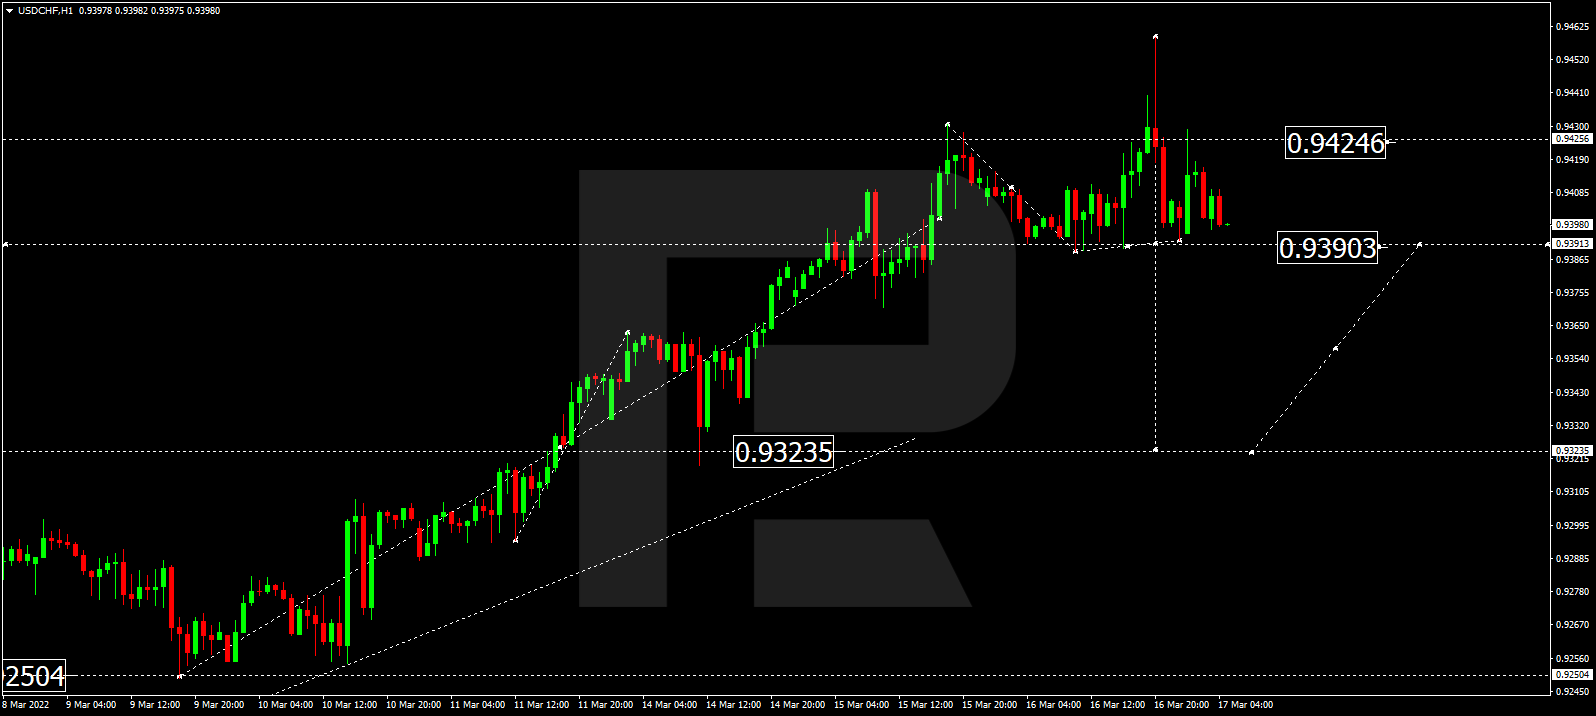
USDCHF, “US Dollar vs Swiss Franc”
Having completed the descending impulse at 0.9400 along with the correction towards 0.9424, USDCHF is falling to break 0.9390. After that, the instrument may continue trading downwards with the short-term target at 0.9355.
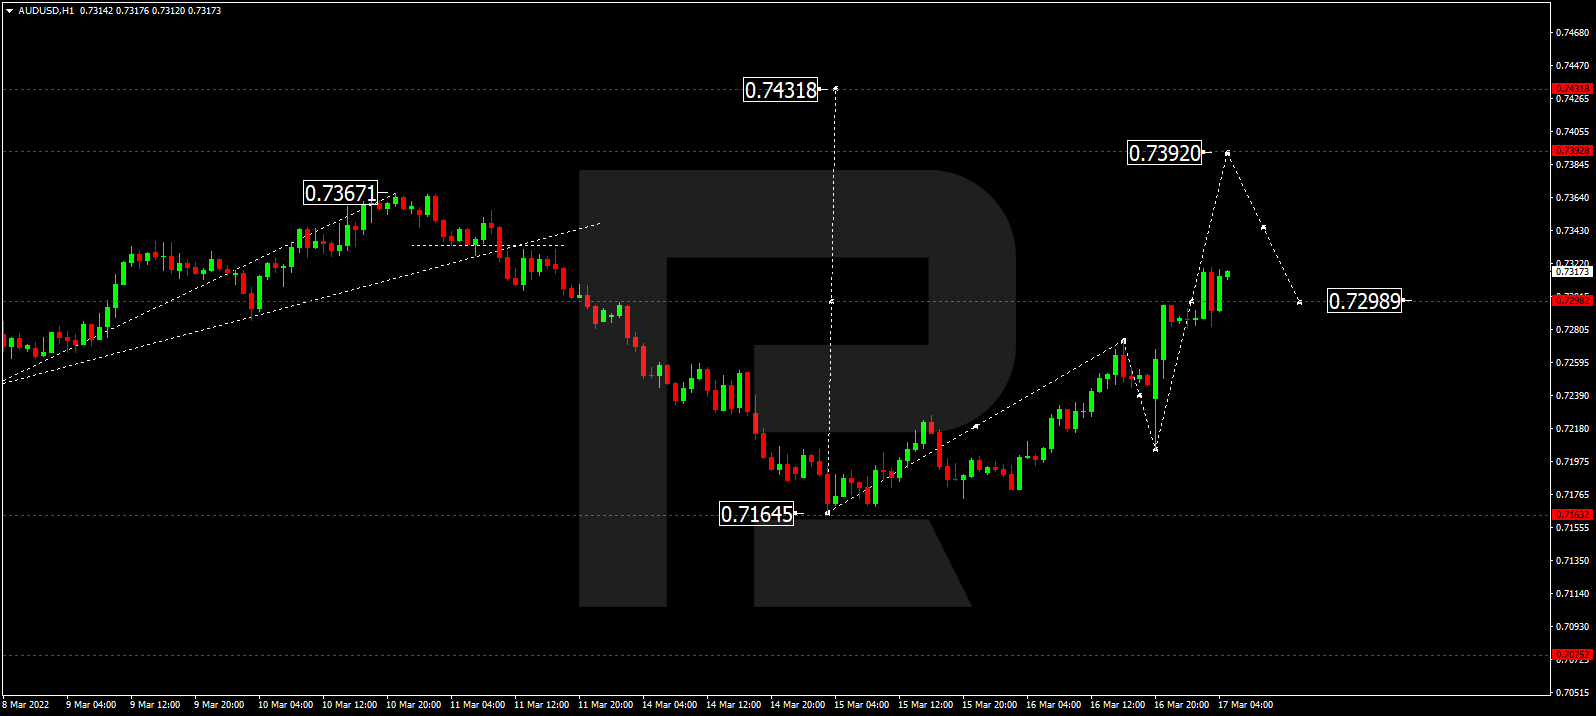
AUDUSD, “Australian Dollar vs US Dollar”
After finishing the ascending impulse at 0.7298 and then forming a new consolidation range there, AUDUSD has broken it to the upside and may later form one more ascending structure with the short-term target at 0.7393.
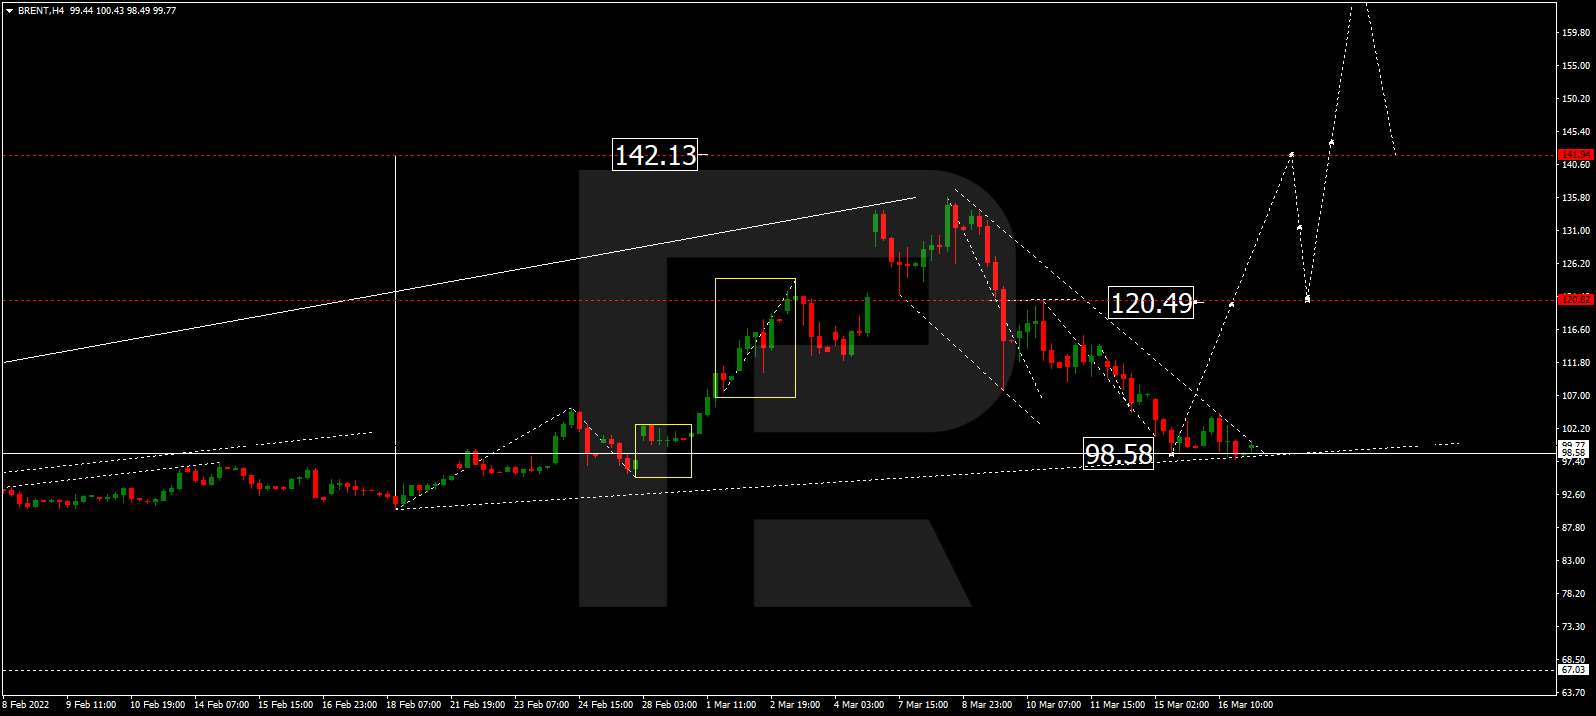
BRENT
Brent continues consolidating above 98.60. Possibly, the asset may form one more ascending structure to break 120.50 and then continue trading upwards with the target at 141.90.
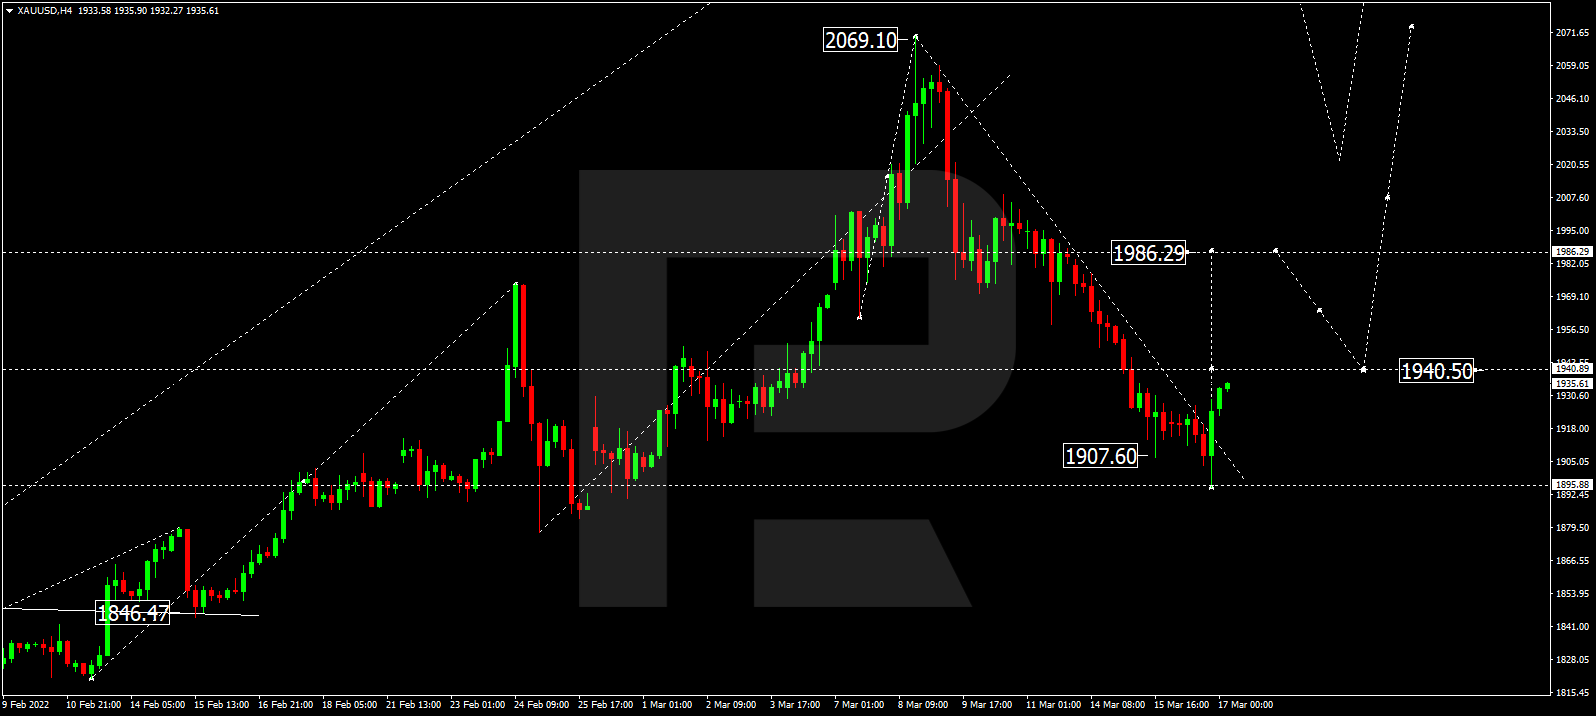
XAUUSD, “Gold vs US Dollar”
Gold has finished the correction at 1896.00. Today, the metal may start a new growth with the target at 1986.30 and then resume falling to reach 1940.00.
S&P 500
The S&P index is still consolidating above 4200.0. Possibly, the asset may form one more ascending structure towards 4333.3 and then resume falling to reach 4075.5. Later, the market may start a new growth to return to 4333.3 or even extend this correction up to 4444.4.

Article By RoboForex.com
Attention!
Forecasts presented in this section only reflect the author’s private opinion and should not be considered as guidance for trading. RoboForex LP bears no responsibility for trading results based on trading recommendations described in these analytical reviews.

- COT Metals Charts: Weekly Speculator Bets led by Copper & Steel Jul 18, 2026
- COT Bonds Charts: Weekly Speculator Bets led by 2-Year, SOFR 3M & 5-Year Bonds Jul 18, 2026
- COT Energy Charts: Weekly Speculator Bets led by Brent Oil & Heating Oil Jul 18, 2026
- COT Soft Commodities Charts: Weekly Speculator Bets led by Wheat, Corn & Soybean Meal Jul 18, 2026
- The Bank of Canada kept its interest rate unchanged. Platinum prices reached a three‑week high Jul 16, 2026
- Stock indices rose after the release of US inflation data. China’s GDP slowed sharply Jul 15, 2026
- GBP/USD Awaits Political News: What Will Happen Next Jul 15, 2026
- USD/JPY Holds at Highs: Pressure Lingers on Yen Jul 14, 2026
- Oil prices jumped 4% amid a new wave of escalation between the US and Iran Jul 13, 2026
- EUR/USD: US Inflation Will Determine Everything Jul 13, 2026