
By Orbex
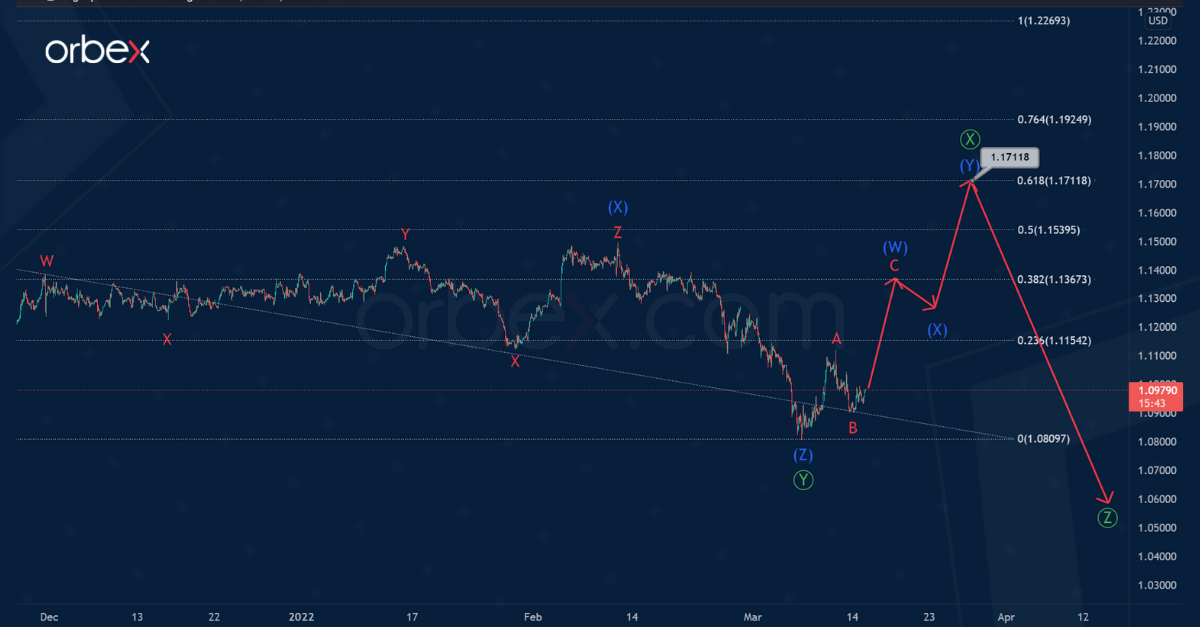
EURUSD assumes the construction of a downward correction pattern. This takes the form of a triple zigzag of the primary degree, consisting of sub-waves Ⓦ-Ⓧ-Ⓨ-Ⓧ-Ⓩ.
It seems that the bearish primary wave Ⓨ has ended, which took the form of a triple zigzag (W)-(X)-(Y)-(X)-(Z) of the intermediate degree. After that, prices moved higher within the primary intervening wave Ⓧ. This wave will likely take the form of an intermediate double zigzag (W)-(X)-(Y).
The completion of the entire primary wave Ⓧ is likely near 1.1711. At that level, wave Ⓧ will be at 61.8% of wave Ⓨ.
Free Reports:
 Download Our Metatrader 4 Indicators – Put Our Free MetaTrader 4 Custom Indicators on your charts when you join our Weekly Newsletter
 Get our Weekly Commitment of Traders Reports - See where the biggest traders (Hedge Funds and Commercial Hedgers) are positioned in the futures markets on a weekly basis.
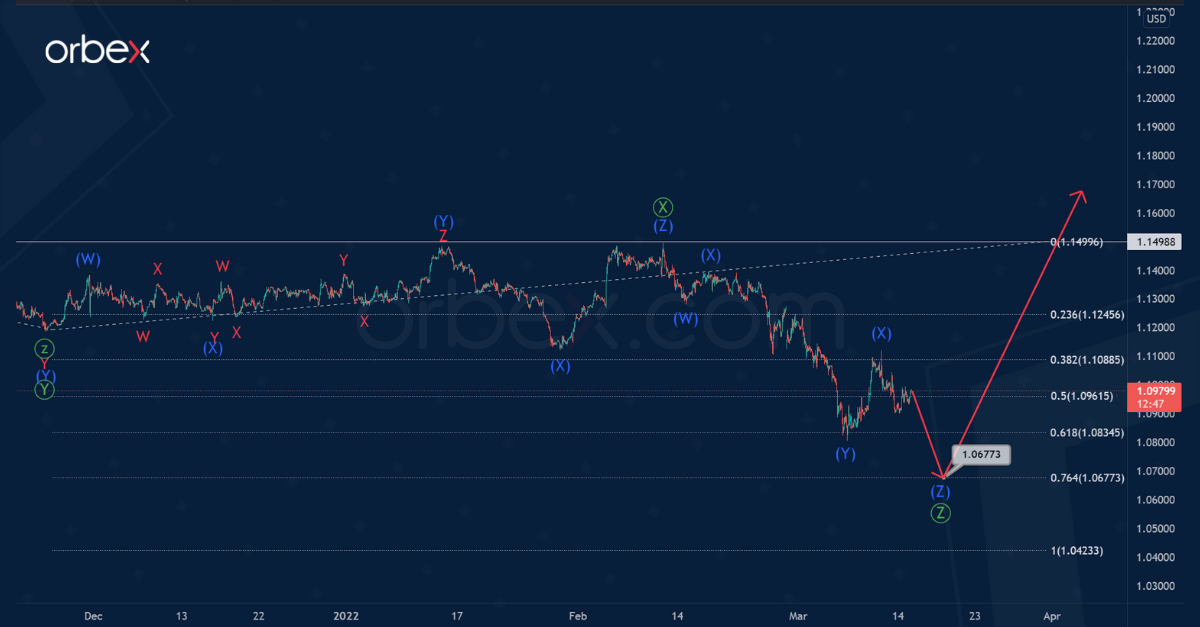
Also, let’s consider an alternative scenario in which the intervening wave Ⓧ could already be fully complete. Here it is a triple three (W)-(X)-(Y)-(X)-(Z).
In this case, at the moment we are observing the formation of a descending primary wave Ⓩ. This actionary wave most likely takes on a complex triple zigzag formation (W)-(X)-(Y)-(X)-(Z).
The end of the correction decline in the primary wave Ⓩ is likely near 1.0677. At that level, primary wave Ⓩ will be at the 76.4% Fibonacci extension of wave Ⓨ.
After the primary pattern is fully complete, the market will begin to grow within the new bullish trend. In turn, this will update the maximum of 1.1498.
Join our responsible trading community – Open your Orbex account now!
![]() Article by Orbex
Article by Orbex
Orbex is a fully licensed broker that was established in 2011. Founded with a mission to serve its traders responsibly and provides traders with access to the world’s largest and most liquid financial markets. www.orbex.com

- The US introduces new import tariffs for 60 countries. Brent crude surpasses $100 per barrel Jul 24, 2026
- USD/JPY Breaks Records: Nothing Slows the Yen’s Decline Jul 24, 2026
- Oil prices reached a 6‑week high. The AUD strengthened on the back of a strong labor‑market report Jul 23, 2026
- EUR/USD Recovers as Dollar Weakens Jul 23, 2026
- Bitcoin rose to $66,000. The New Zealand dollar continues to strengthen Jul 22, 2026
- Inflationary pressure is easing in Canada. In New Zealand, on the contrary, inflation is rising Jul 21, 2026
- GBP/USD Falls After Cabinet Changes Jul 21, 2026
- Geopolitical and macroeconomic conditions continue to pressure market sentiment Jul 20, 2026
- USD/JPY Poised to Continue Gains as Expensive Oil and Lack of Support Weigh on Yen Jul 20, 2026
- COT Metals Charts: Weekly Speculator Bets led by Copper & Steel Jul 18, 2026