
Article By RoboForex.com
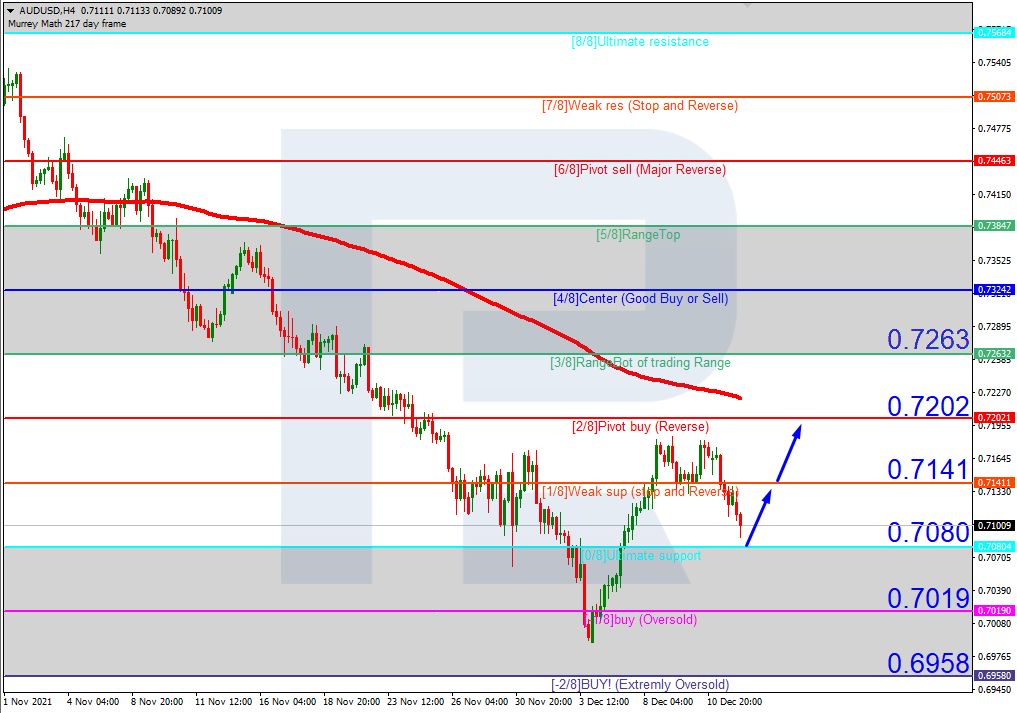
AUDUSD, “Australian Dollar vs US Dollar”
In the H4 chart, AUDUSD is approaching the “oversold area” again. In this case, the price is expected to test 0/8, rebound from it, and then grow to reach the resistance at 2/8. However, this scenario may no longer be valid if the price breaks the support at 0/8 to the downside. After that, the instrument may continue falling towards -1/8.

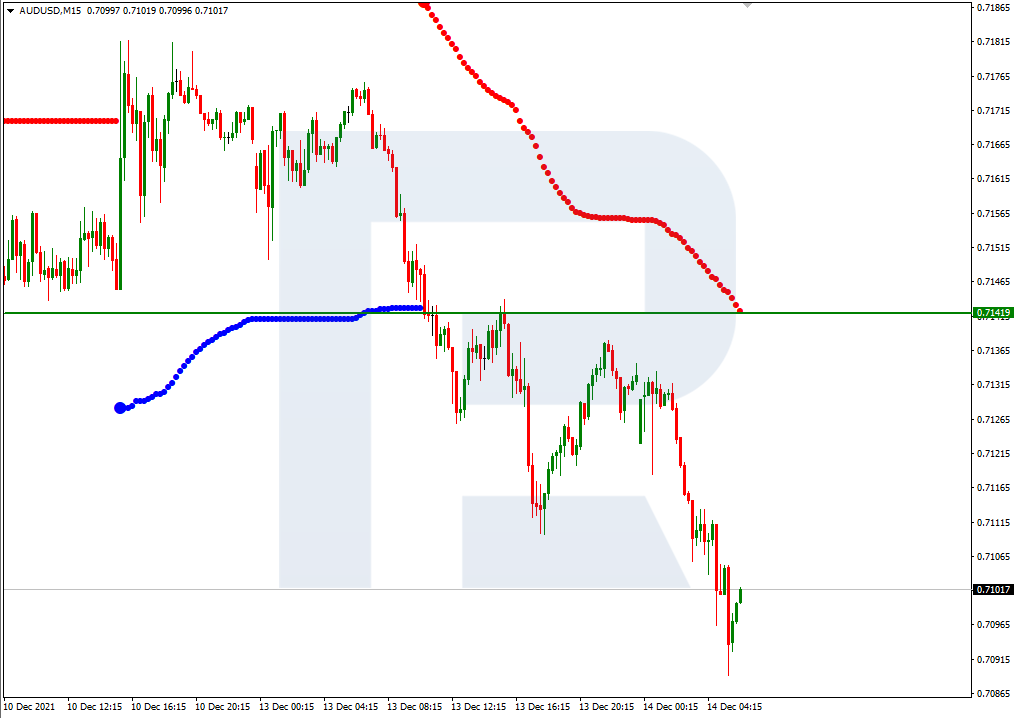
As we can see in the M15 chart, the upside line of the VoltyChannel indicator is pretty far away from the price, that’s why the pair may resume trading upwards only after rebounding from 0/8 in the H4 chart.
Free Reports:
 Sign Up for Our Stock Market Newsletter – Get updated on News, Charts & Rankings of Public Companies when you join our Stocks Newsletter
 Get our Weekly Commitment of Traders Reports - See where the biggest traders (Hedge Funds and Commercial Hedgers) are positioned in the futures markets on a weekly basis.
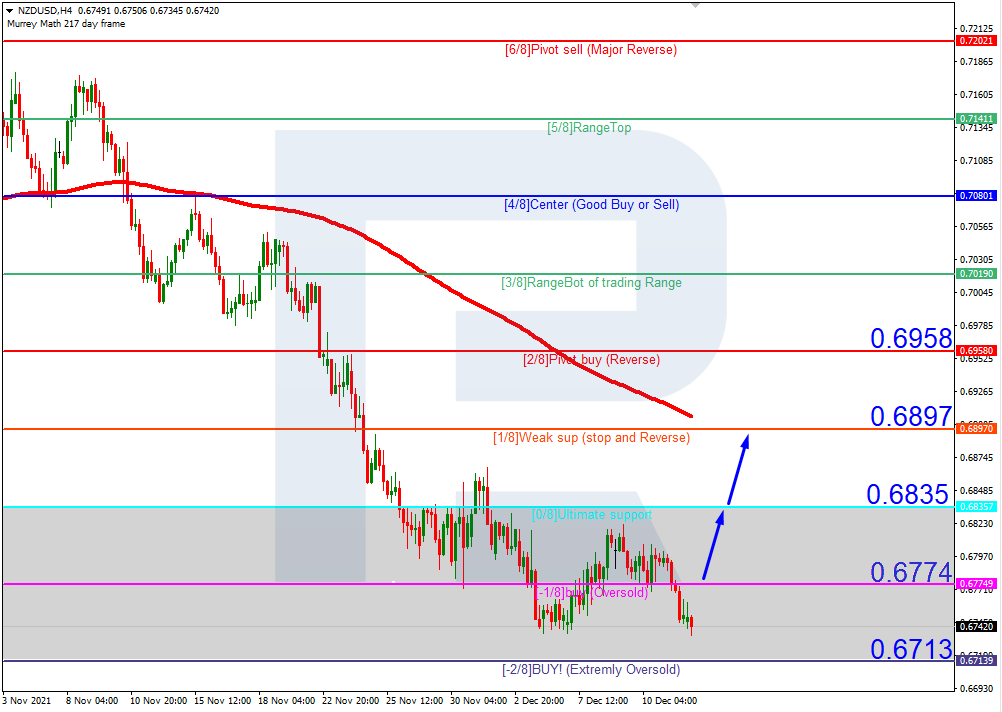
NZDUSD, “New Zealand Dollar vs US Dollar”
As we can see in the H4 chart, NZDUSD is trading within the “oversold area”. In this case, the price is expected to test -1/8, break it, and then continue growing to reach the resistance at 1/8. Since the current trend is descending, this upward movement should be considered as a correction. However, this scenario may no longer be valid if the price breaks the support at -2/8 to the downside. After that, the lines in the chart will be redrawn, thus helping us to define new downside targets.
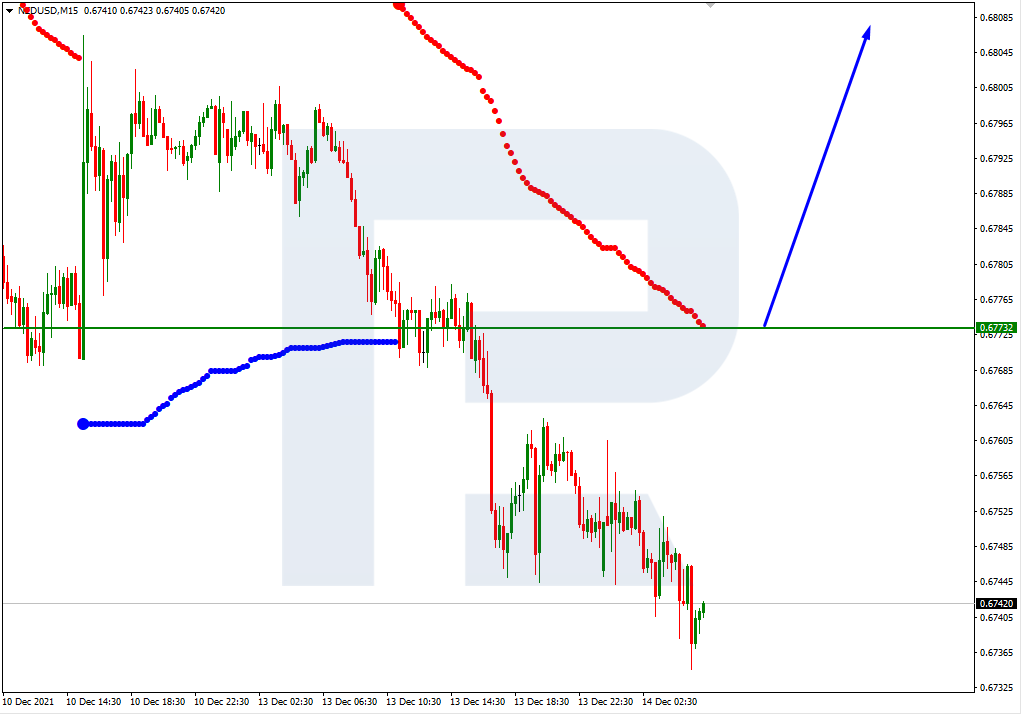
In the M15 chart, the pair may break the upside line of the VoltyChannel indicator and, as a result, continue its growth.
Article By RoboForex.com
Attention!
Forecasts presented in this section only reflect the author’s private opinion and should not be considered as guidance for trading. RoboForex LP bears no responsibility for trading results based on trading recommendations described in these analytical reviews.

- COT Metals Charts: Speculator Bets led by Silver, Gold & Platinum Mar 7, 2026
- COT Bonds Charts: Speculator Bets led by 10-Year Bonds & Fed Funds Mar 7, 2026
- COT Energy Charts: Speculator Bets led by Brent Oil & Heating Oil Mar 7, 2026
- COT Soft Commodities Charts: Speculator Bets led by Corn & Soybean Meal Mar 7, 2026
- Investors run to safe-haven assets amid Middle East escalation Mar 6, 2026
- EUR/USD Under Pressure: Middle East Risks Outweigh All Else Mar 6, 2026
- Bitcoin shows resilience to Middle East events. Oil market stabilizes Mar 5, 2026
- GBP/USD: Market Not Expecting BoE Rate Cut in March Mar 5, 2026
- Brent headed for $100? Mar 4, 2026
- Global stock indices continue sell-off due to Middle East conflict Mar 4, 2026