
Author: Dmitriy Gurkovskiy, Chief Analyst at RoboForex
The Gold price is barely moving although the short-term market situation is not in favour of the precious metal. On Monday, 1 November 2021, the troy ounce costs $1,788. Gold has been rather volatile recently and definitely shows an inverse correlation to the USD.
It’s safe to say now that the Gold price will fluctuate pretty much this week in anticipation of the US Fed meeting. The regulator is slowly moving towards the reduction of the QE programme but this factor has already been included in the “greenback” price. If the Fed announces the QE reduction and hints at some more fiscal moves in the future, Gold may rise.
A lot of attention is currently paid to American inflation. If the CPI and its components continue growing, the demand for Gold as a “safe haven” asset will surely expand. The inflation rally calls into question the rate and prospects of economic growth and that won’t make market players happy.
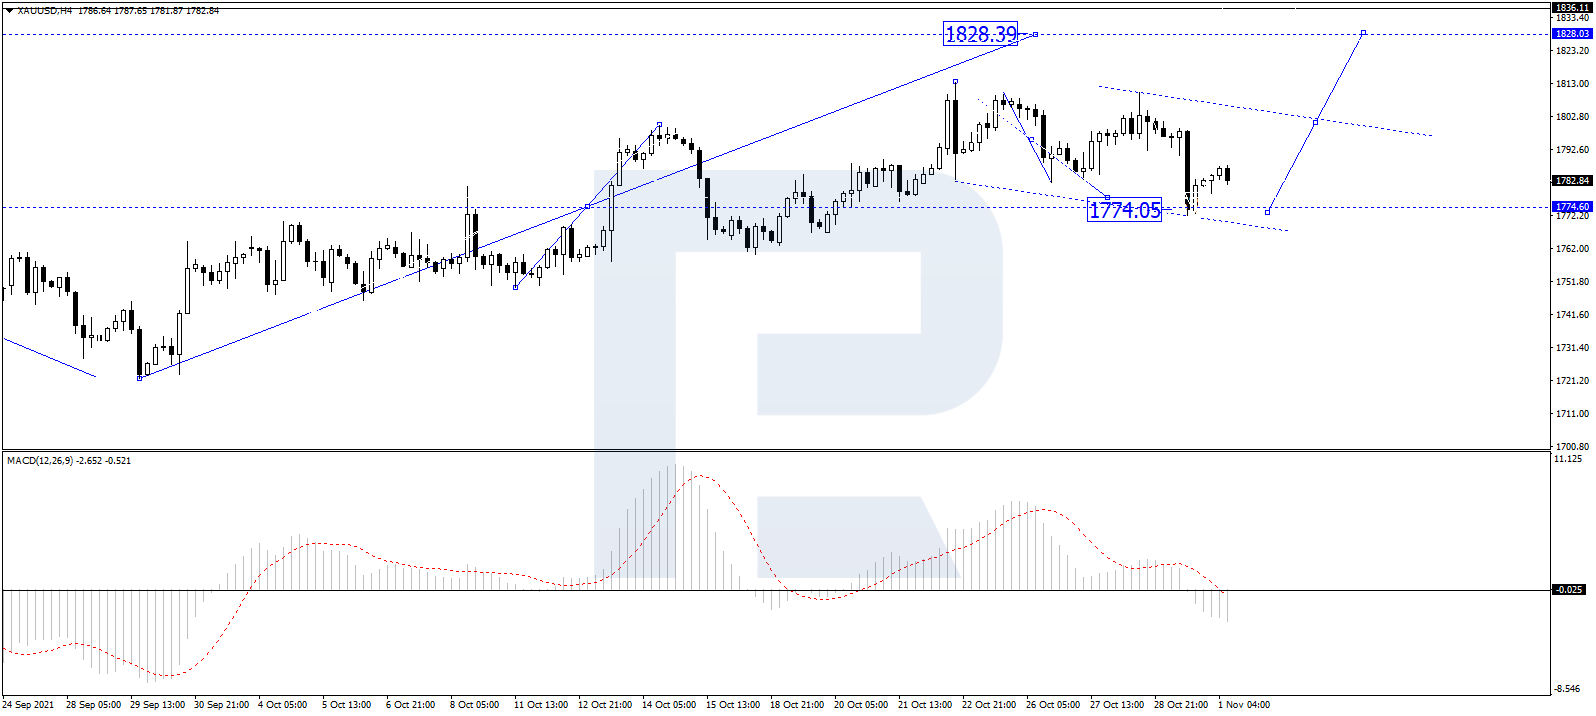
As we can see in the H4 chart, after completing the correctional wave at 1774.05 along with the ascending structure towards 1781.10, XAU/USD is expected to start another decline to reach 1763.81. After that, the instrument may resume trading upwards with the target at 1830.00. From the technical point of view, this scenario is confirmed by MACD Oscillator: its signal line is moving downwards below 0 inside the histogram area. Later, the indicator is expected to continue falling towards new lows.
Free Reports:
 Get our Weekly Commitment of Traders Reports - See where the biggest traders (Hedge Funds and Commercial Hedgers) are positioned in the futures markets on a weekly basis.
 Sign Up for Our Stock Market Newsletter – Get updated on News, Charts & Rankings of Public Companies when you join our Stocks Newsletter
In the H1 chart, Gold has finished the descending wave at 1772.00 along with the ascending structure towards 1787.60. Possibly, the metal may form a new consolidation range below the latter level. If later the price breaks this range to the downside, the market may resume falling to reach 1765.56 or even extend the correction down to 1750.00. From the technical point of view, this scenario is confirmed by the Stochastic Oscillator: after breaking 50 to the downside, its signal is expected to continue moving downwards to reach 20.

Disclaimer
Any forecasts contained herein are based on the author’s particular opinion. This analysis may not be treated as trading advice. RoboForex bears no responsibility for trading results based on trading recommendations and reviews contained herein.

- The Central Bank of Mexico kept its interest rate unchanged. Iran plans to introduce strict bans for US and Israeli vessels in the Strait of Hormuz Aug 7, 2026
- USD/JPY Holds Firm: Yen Loses Some Support Aug 7, 2026
- Australian trade balance returned to positive territory Aug 6, 2026
- Results in Line for Most Reporting Companies Aug 5, 2026
- Stock indices continue to break records. Oil is falling amid intensified diplomatic dialogue between the US and Iran Aug 5, 2026
- USD/JPY Holds Steady After Intervention: Outlook Remains Uncertain Aug 5, 2026
- EUR/USD: Busy Week Ahead Aug 3, 2026
- Positive sentiment in the AI sector supported stock indices. Oil prices remain volatile Aug 3, 2026
- The Tech‑heavy NASDAQ Index jumped by more than 3.3%. The offshore yuan is trading at its highest level since 2023 Jul 31, 2026
- USD/JPY After Volatility: Multiple Events in One Day Jul 31, 2026
