
By Orbex

The formation of the DXY stock index suggests the development of a large triple zigzag consisting of cycle waves w-x-y-x-z.
On the 1H timeframe, we see the second half of a large average wave y, which has the form of a double zigzag Ⓦ-Ⓧ-Ⓨ of the primary degree. Apparently, this double zigzag has come to an end. If this is the case, then shortly the market may turn around and begin to decline in a cycle intervening wave x.
Wave x will be simple as shown by red trend lines and marked with primary waves Ⓐ-Ⓑ-Ⓒ. There is a possibility that prices could reach a minimum of 91.94. At that level, the primary intervening wave Ⓧ ended in early September.
Free Reports:
 Sign Up for Our Stock Market Newsletter – Get updated on News, Charts & Rankings of Public Companies when you join our Stocks Newsletter
 Get our Weekly Commitment of Traders Reports - See where the biggest traders (Hedge Funds and Commercial Hedgers) are positioned in the futures markets on a weekly basis.
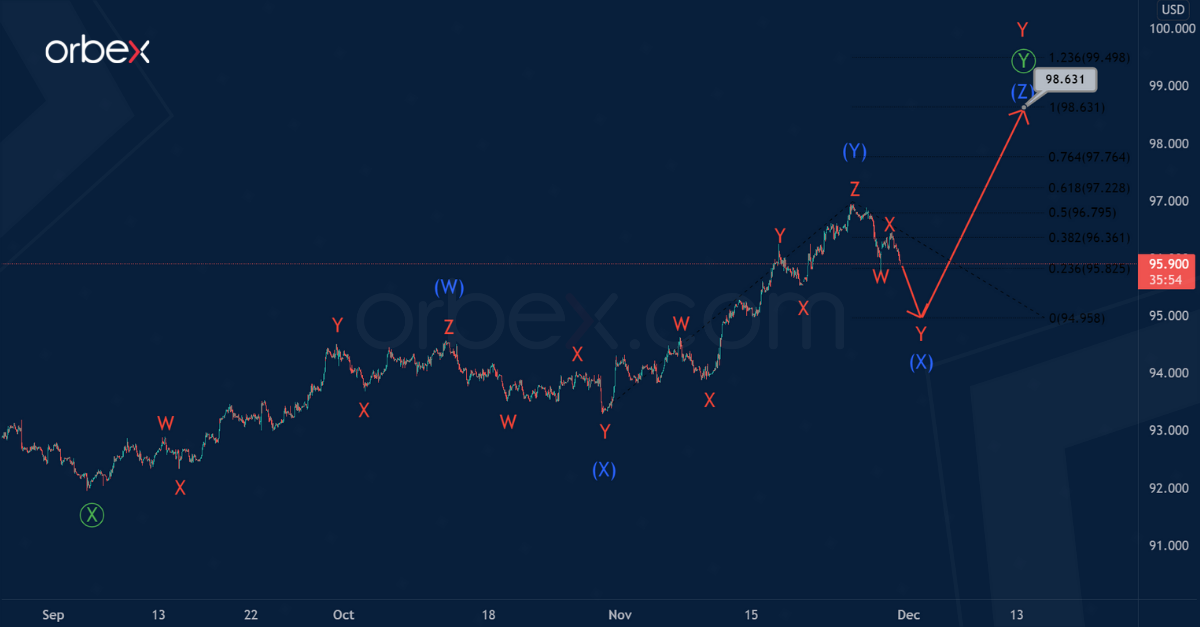
Let’s consider an alternative scenario in which the cycle wave y is not yet complete.
Perhaps its final primary wave Ⓨ will be more complex in its structure. In fact, it can take the form, not of a double, but a triple zigzag consisting of intermediate sub-waves (W)-(X)-(Y)-(X)-(Z).
If that is the case then in the short term, the market could complete the decline in a small reactionary intervening wave (X) in the form of a double zigzag W-X-Y. And then the bulls can push the price to the level of 98.63 in the intermediate wave (Z).
At the specified level, wave (Z) will be equal to the actionary wave (Y).
![]() Article by Orbex
Article by Orbex
Orbex is a fully licensed broker that was established in 2011. Founded with a mission to serve its traders responsibly and provides traders with access to the world’s largest and most liquid financial markets. www.orbex.com

- Oil prices jumped 4% amid a new wave of escalation between the US and Iran Jul 13, 2026
- EUR/USD: US Inflation Will Determine Everything Jul 13, 2026
- COT Metals Charts: Weekly Speculator Bets see small gains for Silver & Gold Jul 12, 2026
- COT Bonds Charts: Speculator Bets led by SOFR 3-Months & 2-Year Bonds Jul 12, 2026
- COT Energy Charts: Weekly Speculator Changes led by Brent Oil Jul 12, 2026
- COT Soft Commodities Charts: Weekly Speculator Changes led by Sugar, Corn & Soybeans Jul 12, 2026
- The US and European stock indices are rising again amid renewed investor interest in the AI industry. Jul 10, 2026
- USD/JPY Falls as Yen Recovers Weekly Losses Jul 10, 2026
- Crude oil prices surged sharply by 7% in reaction to the rapid escalation of the conflict in the Middle East Jul 9, 2026
- Middle East Tensions Weigh on Gold Jul 9, 2026