

The past few days have been rough and rocky for the dollar.
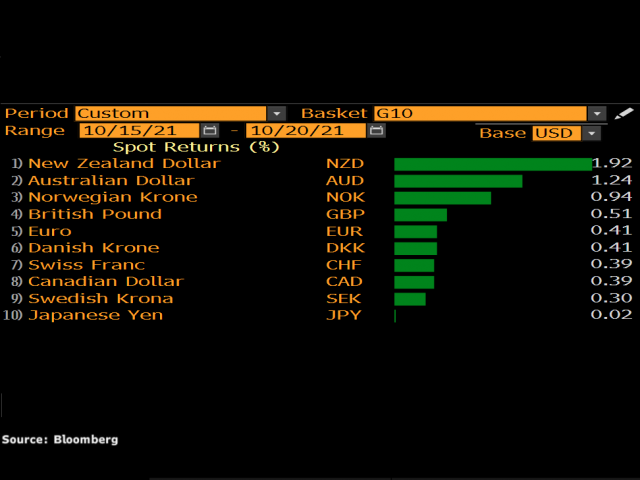
It has depreciated against every single G10 currency this week despite firmer Treasury yields.
Free Reports:
 Get our Weekly Commitment of Traders Reports - See where the biggest traders (Hedge Funds and Commercial Hedgers) are positioned in the futures markets on a weekly basis.
 Sign Up for Our Stock Market Newsletter – Get updated on News, Charts & Rankings of Public Companies when you join our Stocks Newsletter
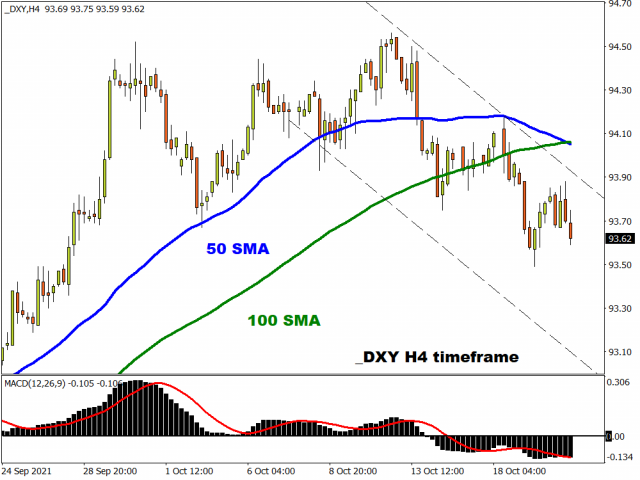
As robust corporate earnings boosted risk appetite, this drew investors away from safe-haven destinations like the dollar to riskier assets. Such was reflected in the Dollar Index (DXY) which shed roughly 0.3% since Monday with prices slipping towards 93.50 as of writing. As the Greenback lost ground, G10 currencies could stretch their feet with even some spreading their wings to aim for the skies. With the dollar likely to remain pressured by the risk-on mood, this may present fresh trading opportunities across the FX space.
Our focus today will revolve around the G10 arena with technical analysis our weapon of choice.
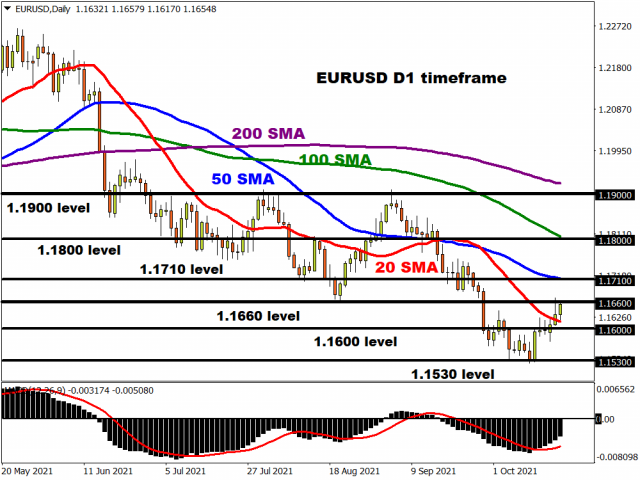
EURUSD closes above 20 SMA…what next?
The EURUSD has pushed higher this week but in a choppy fashion with prices above the 20-day Simple Moving Average. Bulls are certainly in the vicinity with a weaker dollar fuelling upside gains. A solid daily close above 1.1660 could encourage an inline towards 1.1710 – where the 100-day Simple Moving Average (SMA) resides. Beyond this point, the next key level of interest can be found at 1.1800.
Alternatively, a move back below the 20-day SMA may signal a decline towards 1.1570 and 1.1530, respectively.
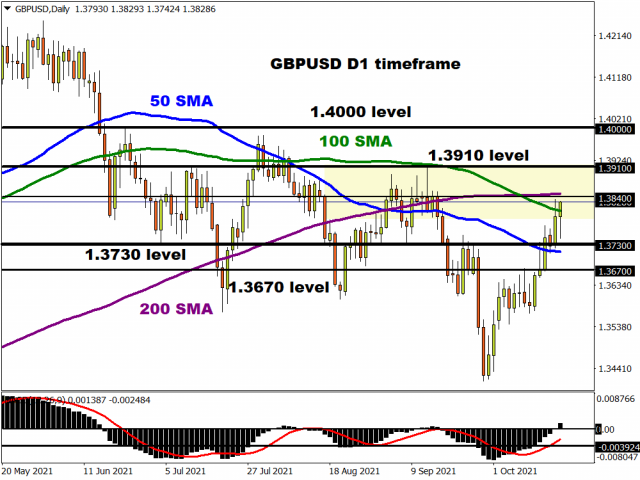
GBPUSD enters sticky regions
It has not been a bad week for the GBPUSD thus far. Despite the slow start on Monday, the currency pair has gained roughly 100 pips with prices trading marginally above the 100-day SMA.
Now, this is where things get interesting. The 200-day SMA is around 1.3840, roughly 30 pips higher than where the 100-day SMA. If bulls fail to break through this sticky region, the GBPUSD could experience a decline back towards 1.3700 and 1.3670. However, a strong move above 1.3850 may inspire an incline towards 1.3910 and 1.4000, respectively.
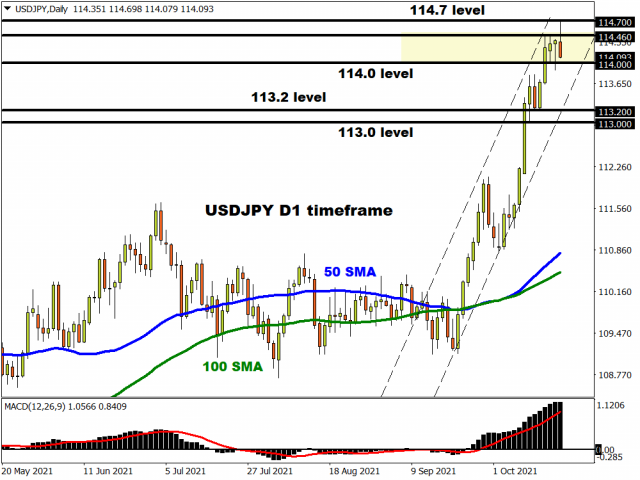
Time for the USDJPY to pull back?
The USDJPY touched a fresh multi-year high early this morning before experiencing an intraday pullback. The daily candlestick resembles a shooting star which is viewed as a bearish reversal candlestick that typically occurs at the top of uptrends. A strong daily close below 114.00 could signal a further decline towards 113.20 and 113.00, respectively. Should the USDJPY break above the 114.70 multiyear high, the next key levels of interest may be found at 115.00 and 117.00.
AUDUSD pops above 0.7500
AUD bulls are certainly on a roll. Prices remain in a healthy uptrend on the daily charts as there have been consistently higher highs and higher lows. While the path of least resistance certainly points north, bulls need to secure a solid daily close above 0.7500. If this becomes reality, an incline towards 0.7560 may be on the cards. It’s worth keeping in mind that this is where the 200-day Simple Moving Average resides. Beyond this point, the next key levels can be found at 0.7600 and 0.7660.
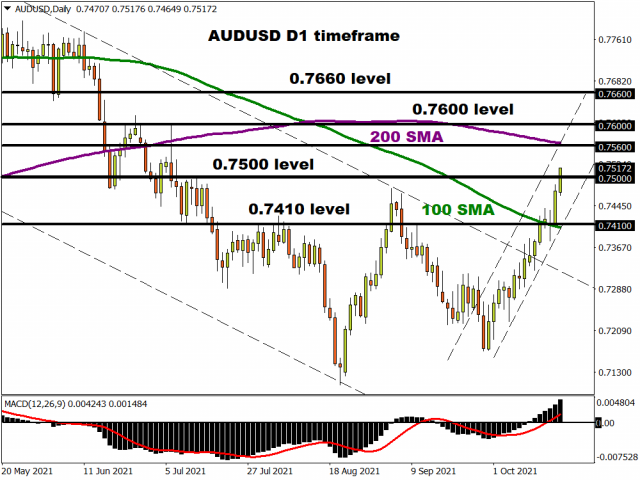
On the flip side, sustained weakness below 0.7500 may trigger a decline back towards 0.7410.
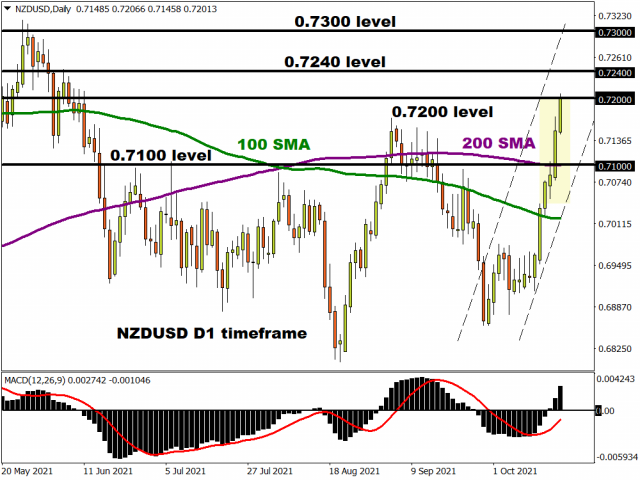
NZDUSD maintains bullish momentum
One of the biggest winners against the dollar was the New Zealand Dollar. It has gained over 1% against the greenback this week with prices trading around 0.7200 as of writing. Prices are heavily bullish on the daily charts with the next key points of interest at 0.7240 and 0.7300. Although a pullback may be pending down the road, bulls remain in power with the path of least resistance north.
Disclaimer: The content in this article comprises personal opinions and should not be construed as containing personal and/or other investment advice and/or an offer of and/or solicitation for any transactions in financial instruments and/or a guarantee and/or prediction of future performance. ForexTime (FXTM), its affiliates, agents, directors, officers or employees do not guarantee the accuracy, validity, timeliness or completeness, of any information or data made available and assume no liability as to any loss arising from any investment based on the same.
![]() Article by ForexTime
Article by ForexTime
ForexTime Ltd (FXTM) is an award winning international online forex broker regulated by CySEC 185/12 www.forextime.com

- COT Metals Charts: Weekly Speculator Bets led by Copper & Steel Jul 18, 2026
- COT Bonds Charts: Weekly Speculator Bets led by 2-Year, SOFR 3M & 5-Year Bonds Jul 18, 2026
- COT Energy Charts: Weekly Speculator Bets led by Brent Oil & Heating Oil Jul 18, 2026
- COT Soft Commodities Charts: Weekly Speculator Bets led by Wheat, Corn & Soybean Meal Jul 18, 2026
- The Bank of Canada kept its interest rate unchanged. Platinum prices reached a three‑week high Jul 16, 2026
- Stock indices rose after the release of US inflation data. China’s GDP slowed sharply Jul 15, 2026
- GBP/USD Awaits Political News: What Will Happen Next Jul 15, 2026
- USD/JPY Holds at Highs: Pressure Lingers on Yen Jul 14, 2026
- Oil prices jumped 4% amid a new wave of escalation between the US and Iran Jul 13, 2026
- EUR/USD: US Inflation Will Determine Everything Jul 13, 2026