
By Dmitriy Gurkovskiy, Chief Analyst at RoboForex
On Monday afternoon, the major currency pair is steadily trading at 1.1720 without any sharp fluctuations: the “greenback” remains strong, while the Euro can’t rise despite a huge risk appetite on the market.
The latest data on the American real estate market was in favour of the USD. For example, the New Home Sales added 1.5% in August (seasonally-adjusted) and showed 740K against the expected reading of 714K.
American monetary policymakers delivered several speeches and investors were listening to them very carefully. For example, there was an opinion that the labour market still didn’t look quite stable and might not pass the test of the QE program reduction planned by the US Federal Reserve System.
At the same time, some other committee members believe that the regulator should start reducing the program as early as November and raise the rates late in 2022 if the employment sector allows.
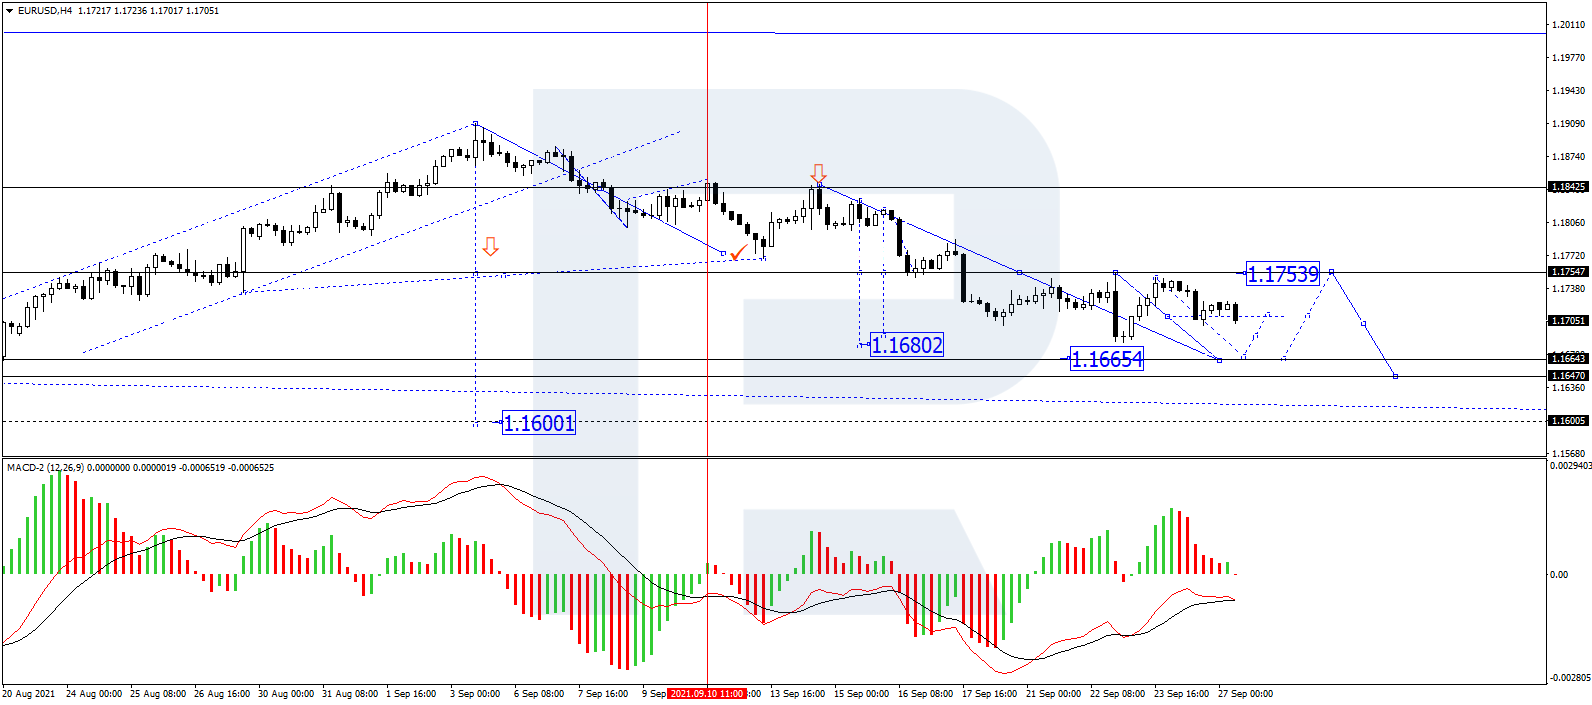
In the H4 chart, EUR/USD continues forming the third descending wave with the target at 1.1655 and may later correct towards 1.1750; right now, it is forming the fifth structure of the above-mentioned wave. Possibly, today the pair may reach 1.1670 and then grow to test 1.1710 from below. After that, the instrument may resume trading downwards to reach the target at 1.1655. From the technical point of view, this scenario is confirmed by MACD Oscillator: its signal line is steadily moving below 0 and may continue falling towards new lows.
Free Reports:
 Get our Weekly Commitment of Traders Reports - See where the biggest traders (Hedge Funds and Commercial Hedgers) are positioned in the futures markets on a weekly basis.
 Download Our Metatrader 4 Indicators – Put Our Free MetaTrader 4 Custom Indicators on your charts when you join our Weekly Newsletter
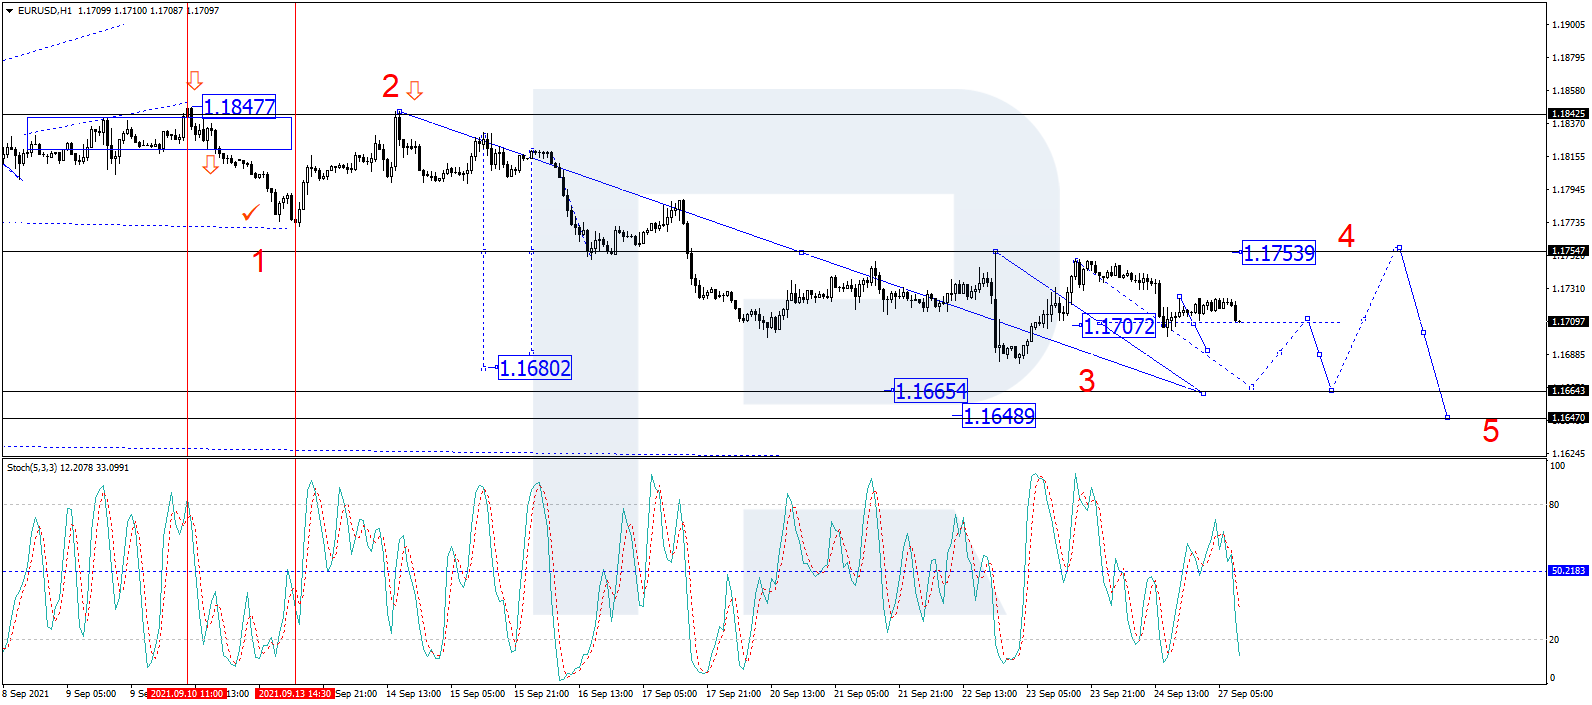
As we can see in the H1 chart, EUR/USD continues forming the fifth structure of the descending wave. Today, the pair may consolidate around 1.1707. Later, the market may fall towards 1.1695 and then grow to test 1.1707 from below. Later, the market may start another decline to reach the short-term target of this structure at 1.1666. From the technical point of view, this scenario is confirmed by the Stochastic Oscillator: its signal line is steadily falling towards 50, a breakout of which may lead to further decline to reach 20.

- COT Metals Charts: Weekly Speculator Bets led by Copper & Steel Jul 18, 2026
- COT Bonds Charts: Weekly Speculator Bets led by 2-Year, SOFR 3M & 5-Year Bonds Jul 18, 2026
- COT Energy Charts: Weekly Speculator Bets led by Brent Oil & Heating Oil Jul 18, 2026
- COT Soft Commodities Charts: Weekly Speculator Bets led by Wheat, Corn & Soybean Meal Jul 18, 2026
- The Bank of Canada kept its interest rate unchanged. Platinum prices reached a three‑week high Jul 16, 2026
- Stock indices rose after the release of US inflation data. China’s GDP slowed sharply Jul 15, 2026
- GBP/USD Awaits Political News: What Will Happen Next Jul 15, 2026
- USD/JPY Holds at Highs: Pressure Lingers on Yen Jul 14, 2026
- Oil prices jumped 4% amid a new wave of escalation between the US and Iran Jul 13, 2026
- EUR/USD: US Inflation Will Determine Everything Jul 13, 2026