
By Dmitriy Gurkovskiy, Chief Analyst at RoboForex
The commodity market is falling early in the week. Brent is trading at $71.55 and may obviously go lower.
The commodity market negatively responded to the US labour market statistics that fell short of expectations, especially the NFP. Investors were worried that the low employment in the country might eventually have a negative influence on the demand for energies and that was the key trigger for sales in oil, which obviously needed a correction.
The statistics from Baker Hughes were quite interesting. The Oil Rig Count in the USA lost 16 units over the week and that might have been an excellent bullish catalyst if it hadn’t been for global market sentiment. At the same time, this week’s data from neither the Department of Energy nor Baker Hughes should be estimated thoroughly due to the Ida storm in the Gulf of Mexico.
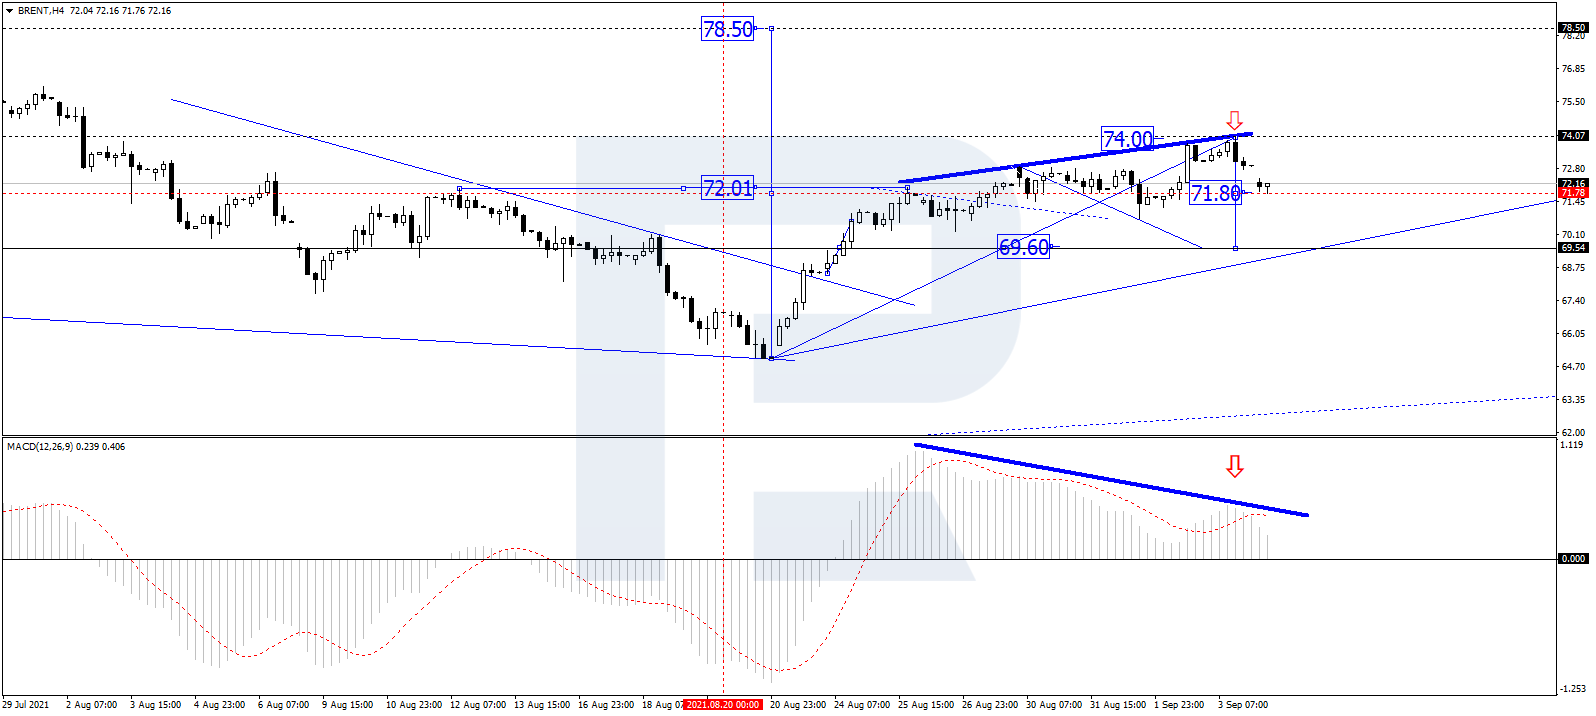
In the H4 chart, after forming a new consolidation range around 71.80 and then expanding it up to 74.05, the asset has tested the latter level from above; right now, it is still consolidating and may soon resume moving upwards to reach the first upside target at 78.50. We should once again note that there haven’t been any serious corrections so far during this ascending movement. If the price breaks this range to the downside, the market may start a new correction with the potential target at 69.60, which may later be followed by another growth to break 75.55 and a further uptrend towards 78.50. From the technical point of view, this scenario is confirmed by MACD Oscillator: its signal line is trading towards 0, while there are several divergences on the indicator, which may hint at a deep correction. However, remember that the instrument is consolidating and trading to break a very important level, which is not strong enough to stop the asset from growing yet. As a result, the most probable scenario implies a breakout of this level to the upside and a further uptrend. As for the indicator, its line ma rebound from 0 and resume moving upwards to reach the highs.
Free Reports:
 Get our Weekly Commitment of Traders Reports - See where the biggest traders (Hedge Funds and Commercial Hedgers) are positioned in the futures markets on a weekly basis.
 Sign Up for Our Stock Market Newsletter – Get updated on News, Charts & Rankings of Public Companies when you join our Stocks Newsletter
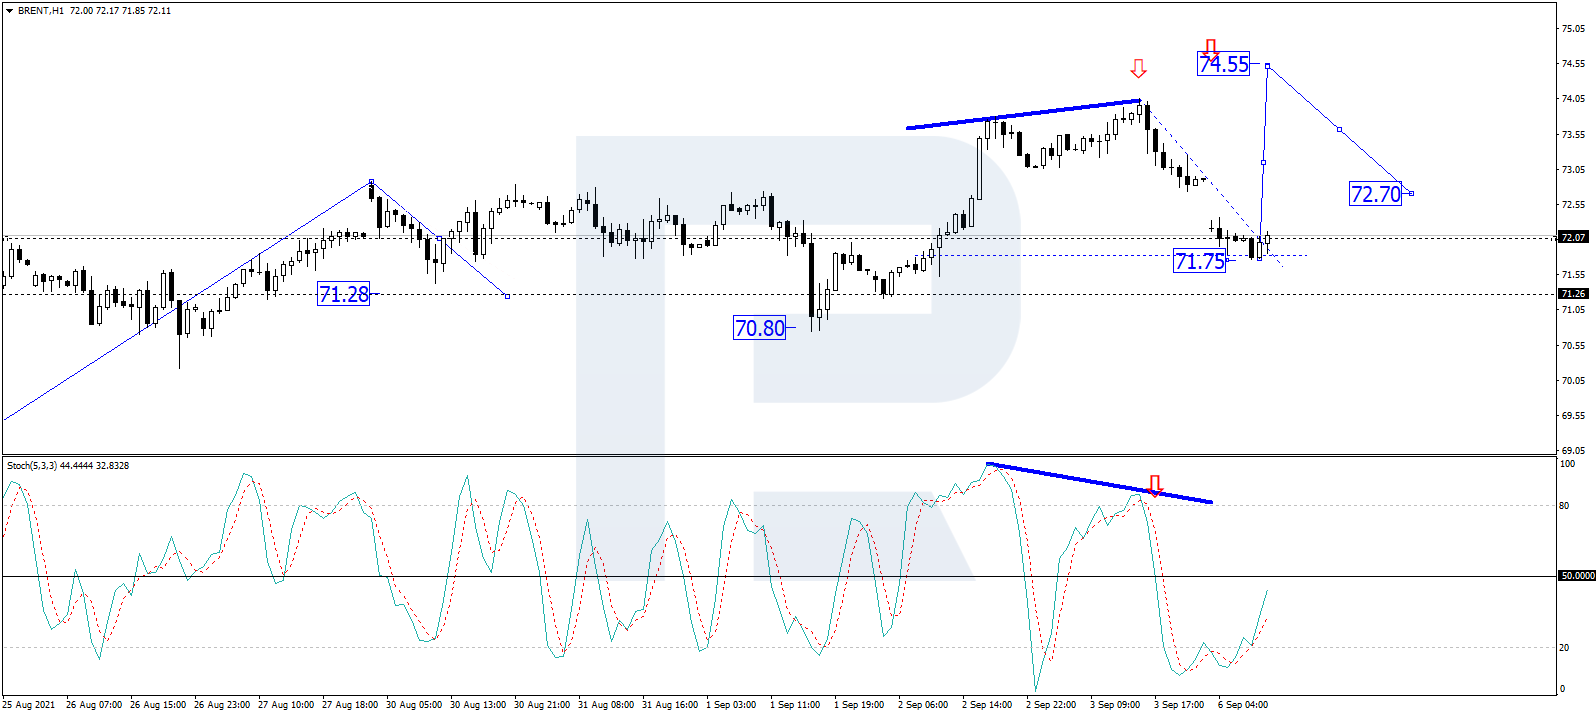
As we can see in the H1 chart, after reaching the correctional target at 71.75, Brent is forming another ascending structure towards 74.55 and may later start a new decline to test 72.00 from above. In fact, the asset is expected to continue consolidating around 72.00. If the price rebounds from this level to the upside, the market may resume growing to break 74.55 and then continue trading upwards to form another five-wave structure with the target at 78.50. From the technical point of view, this idea is confirmed by the Stochastic Oscillator: after leaving the “oversold area”, its signal line is steadily growing to break 50.
Disclaimer
Any forecasts contained herein are based on the author’s particular opinion. This analysis may not be treated as trading advice. RoboForex bears no responsibility for trading results based on trading recommendations and reviews contained herein.

- COT Metals Charts: Weekly Speculator Bets led by Copper & Steel Jul 18, 2026
- COT Bonds Charts: Weekly Speculator Bets led by 2-Year, SOFR 3M & 5-Year Bonds Jul 18, 2026
- COT Energy Charts: Weekly Speculator Bets led by Brent Oil & Heating Oil Jul 18, 2026
- COT Soft Commodities Charts: Weekly Speculator Bets led by Wheat, Corn & Soybean Meal Jul 18, 2026
- The Bank of Canada kept its interest rate unchanged. Platinum prices reached a three‑week high Jul 16, 2026
- Stock indices rose after the release of US inflation data. China’s GDP slowed sharply Jul 15, 2026
- GBP/USD Awaits Political News: What Will Happen Next Jul 15, 2026
- USD/JPY Holds at Highs: Pressure Lingers on Yen Jul 14, 2026
- Oil prices jumped 4% amid a new wave of escalation between the US and Iran Jul 13, 2026
- EUR/USD: US Inflation Will Determine Everything Jul 13, 2026