
By CountingPips.com COT Home | Data Tables | Data Downloads | Newsletter
Here are the latest charts and statistics for the Commitment of Traders (COT) data published by the Commodities Futures Trading Commission (CFTC).
The latest COT data is updated through Tuesday September 14 2021 and shows a quick view of how large traders (for-profit speculators and commercial entities) were positioned in the futures markets.
CORN Futures:
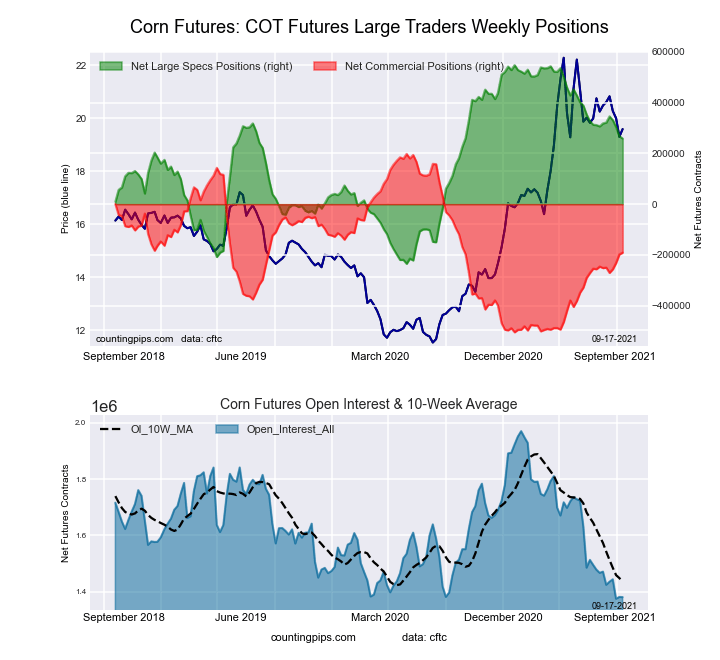 The CORN large speculator standing this week was a net position of 258,634 contracts in the data reported through Tuesday. This was a weekly fall of -9,143 contracts from the previous week which had a total of 267,777 net contracts.
This week’s current strength score (the trader positioning range over the past three years, measured from 0 to 100) shows the speculators are currently Bullish with a score of 63.1 percent. The commercials are Bearish with a score of 44.6 percent and the small traders (not shown in chart) are Bearish-Extreme with a score of 4.3 percent.
| CORN Futures Statistics | SPECULATORS | COMMERCIALS | SMALL TRADERS |
| – Percent of Open Interest Longs: | 26.8 | 50.5 | 8.2 |
| – Percent of Open Interest Shorts: | 8.1 | 64.4 | 13.1 |
| – Net Position: | 258,634 | -191,326 | -67,308 |
| – Gross Longs: | 370,349 | 697,234 | 113,142 |
| – Gross Shorts: | 111,715 | 888,560 | 180,450 |
| – Long to Short Ratio: | 3.3 to 1 | 0.8 to 1 | 0.6 to 1 |
| NET POSITION TREND: | |||
| – COT Index Score (3 Year Range Pct): | 63.1 | 44.6 | 4.3 |
| – COT Index Reading (3 Year Range): | Bullish | Bearish | Bearish-Extreme |
| NET POSITION MOVEMENT INDEX: | |||
| – 6-Week Change in Strength Index: | -7.6 | 8.6 | -0.7 |
Free Reports:
 Download Our Metatrader 4 Indicators – Put Our Free MetaTrader 4 Custom Indicators on your charts when you join our Weekly Newsletter
 Get our Weekly Commitment of Traders Reports - See where the biggest traders (Hedge Funds and Commercial Hedgers) are positioned in the futures markets on a weekly basis.
SUGAR Futures:
 The SUGAR large speculator standing this week was a net position of 259,049 contracts in the data reported through Tuesday. This was a weekly decline of -24,880 contracts from the previous week which had a total of 283,929 net contracts.
This week’s current strength score (the trader positioning range over the past three years, measured from 0 to 100) shows the speculators are currently Bullish-Extreme with a score of 89.8 percent. The commercials are Bearish-Extreme with a score of 10.9 percent and the small traders (not shown in chart) are Bullish with a score of 60.8 percent.
| SUGAR Futures Statistics | SPECULATORS | COMMERCIALS | SMALL TRADERS |
| – Percent of Open Interest Longs: | 29.7 | 46.2 | 9.4 |
| – Percent of Open Interest Shorts: | 4.4 | 75.6 | 5.2 |
| – Net Position: | 259,049 | -301,862 | 42,813 |
| – Gross Longs: | 303,937 | 473,195 | 96,066 |
| – Gross Shorts: | 44,888 | 775,057 | 53,253 |
| – Long to Short Ratio: | 6.8 to 1 | 0.6 to 1 | 1.8 to 1 |
| NET POSITION TREND: | |||
| – COT Index Score (3 Year Range Pct): | 89.8 | 10.9 | 60.8 |
| – COT Index Reading (3 Year Range): | Bullish-Extreme | Bearish-Extreme | Bullish |
| NET POSITION MOVEMENT INDEX: | |||
| – 6-Week Change in Strength Index: | -5.0 | 5.8 | -8.0 |
COFFEE Futures:
 The COFFEE large speculator standing this week was a net position of 58,067 contracts in the data reported through Tuesday. This was a weekly increase of 952 contracts from the previous week which had a total of 57,115 net contracts.
This week’s current strength score (the trader positioning range over the past three years, measured from 0 to 100) shows the speculators are currently Bullish-Extreme with a score of 92.2 percent. The commercials are Bearish-Extreme with a score of 8.9 percent and the small traders (not shown in chart) are Bearish-Extreme with a score of 18.0 percent.
| COFFEE Futures Statistics | SPECULATORS | COMMERCIALS | SMALL TRADERS |
| – Percent of Open Interest Longs: | 26.4 | 43.1 | 3.7 |
| – Percent of Open Interest Shorts: | 6.3 | 64.7 | 2.2 |
| – Net Position: | 58,067 | -62,349 | 4,282 |
| – Gross Longs: | 76,249 | 124,527 | 10,731 |
| – Gross Shorts: | 18,182 | 186,876 | 6,449 |
| – Long to Short Ratio: | 4.2 to 1 | 0.7 to 1 | 1.7 to 1 |
| NET POSITION TREND: | |||
| – COT Index Score (3 Year Range Pct): | 92.2 | 8.9 | 18.0 |
| – COT Index Reading (3 Year Range): | Bullish-Extreme | Bearish-Extreme | Bearish-Extreme |
| NET POSITION MOVEMENT INDEX: | |||
| – 6-Week Change in Strength Index: | 1.9 | -1.8 | -1.2 |
SOYBEANS Futures:
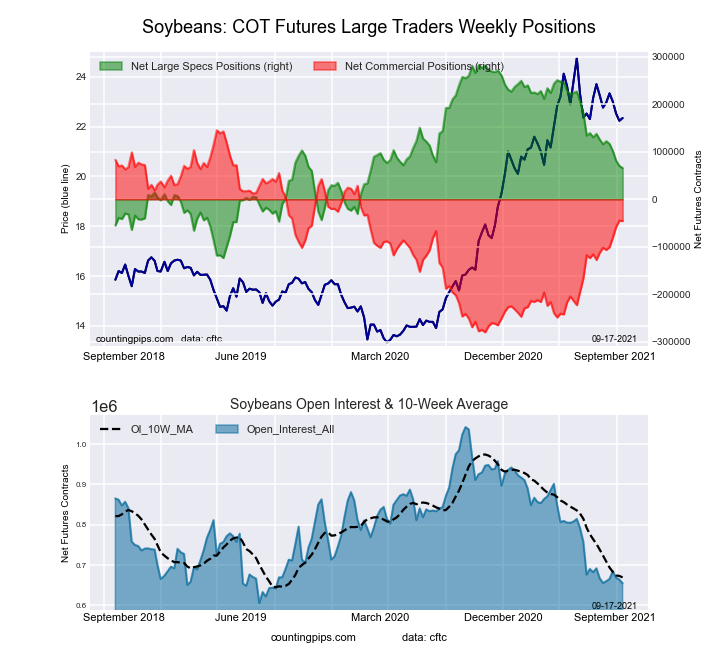 The SOYBEANS large speculator standing this week was a net position of 65,755 contracts in the data reported through Tuesday. This was a weekly reduction of -4,482 contracts from the previous week which had a total of 70,237 net contracts.
This week’s current strength score (the trader positioning range over the past three years, measured from 0 to 100) shows the speculators are currently Bearish with a score of 46.6 percent. The commercials are Bullish with a score of 55.1 percent and the small traders (not shown in chart) are Bearish with a score of 38.3 percent.
| SOYBEANS Futures Statistics | SPECULATORS | COMMERCIALS | SMALL TRADERS |
| – Percent of Open Interest Longs: | 21.9 | 56.4 | 7.2 |
| – Percent of Open Interest Shorts: | 11.8 | 63.4 | 10.3 |
| – Net Position: | 65,755 | -45,602 | -20,153 |
| – Gross Longs: | 143,116 | 369,443 | 47,068 |
| – Gross Shorts: | 77,361 | 415,045 | 67,221 |
| – Long to Short Ratio: | 1.8 to 1 | 0.9 to 1 | 0.7 to 1 |
| NET POSITION TREND: | |||
| – COT Index Score (3 Year Range Pct): | 46.6 | 55.1 | 38.3 |
| – COT Index Reading (3 Year Range): | Bearish | Bullish | Bearish |
| NET POSITION MOVEMENT INDEX: | |||
| – 6-Week Change in Strength Index: | -12.3 | 13.2 | -10.3 |
SOYBEAN MEAL Futures:
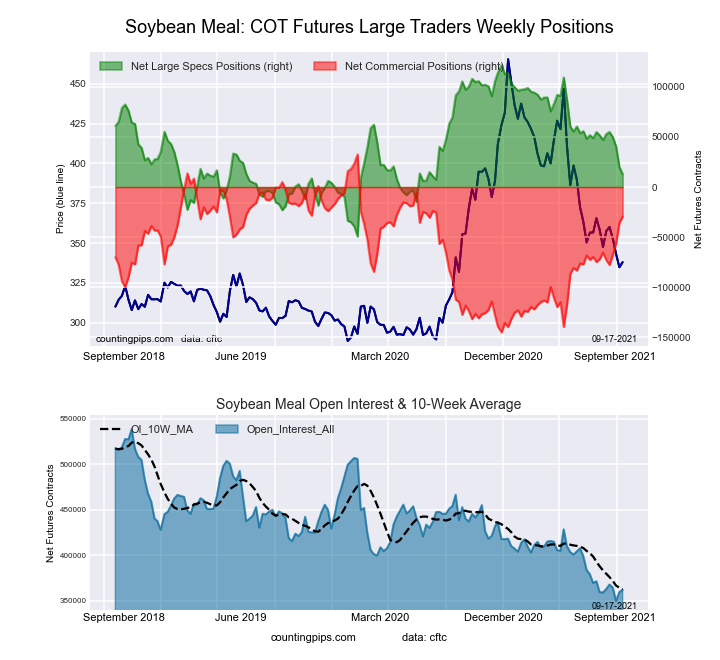 The SOYBEAN MEAL large speculator standing this week was a net position of 12,963 contracts in the data reported through Tuesday. This was a weekly fall of -6,882 contracts from the previous week which had a total of 19,845 net contracts.
This week’s current strength score (the trader positioning range over the past three years, measured from 0 to 100) shows the speculators are currently Bearish with a score of 36.4 percent. The commercials are Bullish with a score of 65.1 percent and the small traders (not shown in chart) are Bearish with a score of 36.8 percent.
| SOYBEAN MEAL Futures Statistics | SPECULATORS | COMMERCIALS | SMALL TRADERS |
| – Percent of Open Interest Longs: | 22.2 | 51.0 | 12.3 |
| – Percent of Open Interest Shorts: | 18.7 | 59.1 | 7.7 |
| – Net Position: | 12,963 | -29,464 | 16,501 |
| – Gross Longs: | 80,420 | 184,292 | 44,489 |
| – Gross Shorts: | 67,457 | 213,756 | 27,988 |
| – Long to Short Ratio: | 1.2 to 1 | 0.9 to 1 | 1.6 to 1 |
| NET POSITION TREND: | |||
| – COT Index Score (3 Year Range Pct): | 36.4 | 65.1 | 36.8 |
| – COT Index Reading (3 Year Range): | Bearish | Bullish | Bearish |
| NET POSITION MOVEMENT INDEX: | |||
| – 6-Week Change in Strength Index: | -19.9 | 20.2 | -7.6 |
LIVE CATTLE Futures:
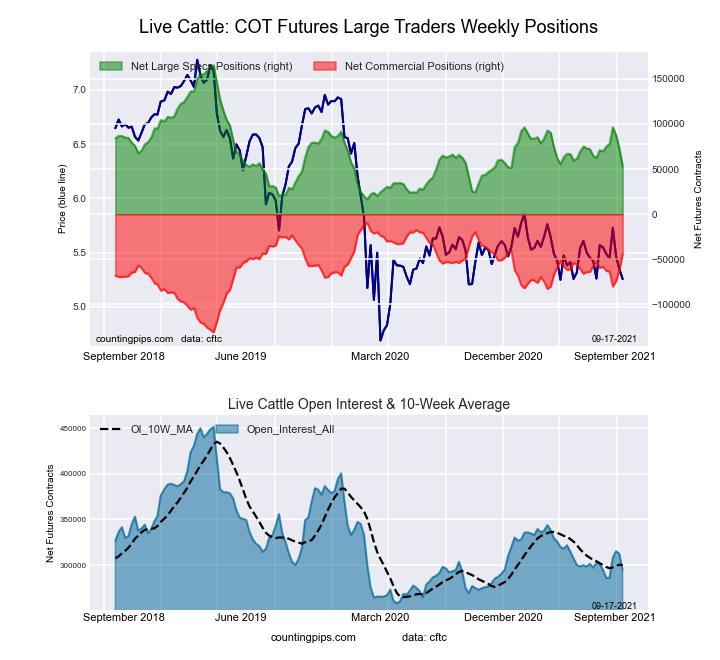 The LIVE CATTLE large speculator standing this week was a net position of 53,155 contracts in the data reported through Tuesday. This was a weekly reduction of -19,344 contracts from the previous week which had a total of 72,499 net contracts.
This week’s current strength score (the trader positioning range over the past three years, measured from 0 to 100) shows the speculators are currently Bearish with a score of 24.7 percent. The commercials are Bullish with a score of 71.7 percent and the small traders (not shown in chart) are Bullish with a score of 64.9 percent.
| LIVE CATTLE Futures Statistics | SPECULATORS | COMMERCIALS | SMALL TRADERS |
| – Percent of Open Interest Longs: | 32.8 | 42.7 | 9.8 |
| – Percent of Open Interest Shorts: | 14.7 | 57.7 | 12.9 |
| – Net Position: | 53,155 | -44,025 | -9,130 |
| – Gross Longs: | 96,535 | 125,695 | 28,935 |
| – Gross Shorts: | 43,380 | 169,720 | 38,065 |
| – Long to Short Ratio: | 2.2 to 1 | 0.7 to 1 | 0.8 to 1 |
| NET POSITION TREND: | |||
| – COT Index Score (3 Year Range Pct): | 24.7 | 71.7 | 64.9 |
| – COT Index Reading (3 Year Range): | Bearish | Bullish | Bullish |
| NET POSITION MOVEMENT INDEX: | |||
| – 6-Week Change in Strength Index: | -11.1 | 11.6 | 6.0 |
LEAN HOGS Futures:
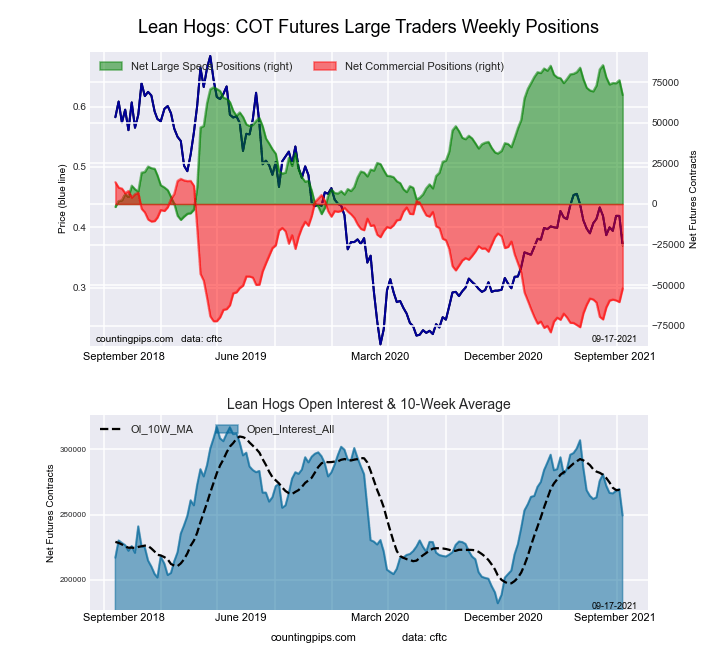 The LEAN HOGS large speculator standing this week was a net position of 67,234 contracts in the data reported through Tuesday. This was a weekly reduction of -9,121 contracts from the previous week which had a total of 76,355 net contracts.
This week’s current strength score (the trader positioning range over the past three years, measured from 0 to 100) shows the speculators are currently Bullish-Extreme with a score of 80.7 percent. The commercials are Bearish with a score of 28.6 percent and the small traders (not shown in chart) are Bearish-Extreme with a score of 5.9 percent.
| LEAN HOGS Futures Statistics | SPECULATORS | COMMERCIALS | SMALL TRADERS |
| – Percent of Open Interest Longs: | 44.9 | 30.8 | 7.3 |
| – Percent of Open Interest Shorts: | 17.9 | 51.7 | 13.4 |
| – Net Position: | 67,234 | -52,069 | -15,165 |
| – Gross Longs: | 111,888 | 76,821 | 18,254 |
| – Gross Shorts: | 44,654 | 128,890 | 33,419 |
| – Long to Short Ratio: | 2.5 to 1 | 0.6 to 1 | 0.5 to 1 |
| NET POSITION TREND: | |||
| – COT Index Score (3 Year Range Pct): | 80.7 | 28.6 | 5.9 |
| – COT Index Reading (3 Year Range): | Bullish-Extreme | Bearish | Bearish-Extreme |
| NET POSITION MOVEMENT INDEX: | |||
| – 6-Week Change in Strength Index: | -19.3 | 20.2 | -3.4 |
COTTON Futures:
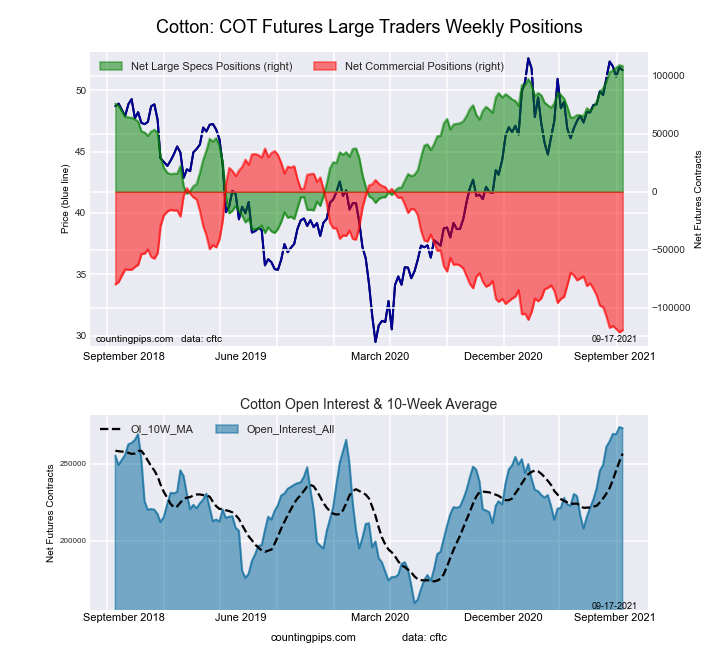 The COTTON large speculator standing this week was a net position of 108,223 contracts in the data reported through Tuesday. This was a weekly reduction of -692 contracts from the previous week which had a total of 108,915 net contracts.
This week’s current strength score (the trader positioning range over the past three years, measured from 0 to 100) shows the speculators are currently Bullish-Extreme with a score of 99.5 percent. The commercials are Bearish-Extreme with a score of 1.1 percent and the small traders (not shown in chart) are Bullish-Extreme with a score of 81.2 percent.
| COTTON Futures Statistics | SPECULATORS | COMMERCIALS | SMALL TRADERS |
| – Percent of Open Interest Longs: | 45.0 | 34.6 | 7.2 |
| – Percent of Open Interest Shorts: | 5.3 | 78.2 | 3.2 |
| – Net Position: | 108,223 | -119,054 | 10,831 |
| – Gross Longs: | 122,838 | 94,610 | 19,575 |
| – Gross Shorts: | 14,615 | 213,664 | 8,744 |
| – Long to Short Ratio: | 8.4 to 1 | 0.4 to 1 | 2.2 to 1 |
| NET POSITION TREND: | |||
| – COT Index Score (3 Year Range Pct): | 99.5 | 1.1 | 81.2 |
| – COT Index Reading (3 Year Range): | Bullish-Extreme | Bearish-Extreme | Bullish-Extreme |
| NET POSITION MOVEMENT INDEX: | |||
| – 6-Week Change in Strength Index: | 13.3 | -12.6 | 4.8 |
COCOA Futures:
 The COCOA large speculator standing this week was a net position of 28,036 contracts in the data reported through Tuesday. This was a weekly decrease of -2,405 contracts from the previous week which had a total of 30,441 net contracts.
This week’s current strength score (the trader positioning range over the past three years, measured from 0 to 100) shows the speculators are currently Bearish with a score of 48.9 percent. The commercials are Bullish with a score of 51.2 percent and the small traders (not shown in chart) are Bearish with a score of 41.9 percent.
| COCOA Futures Statistics | SPECULATORS | COMMERCIALS | SMALL TRADERS |
| – Percent of Open Interest Longs: | 30.0 | 51.7 | 5.1 |
| – Percent of Open Interest Shorts: | 17.9 | 65.1 | 3.8 |
| – Net Position: | 28,036 | -30,978 | 2,942 |
| – Gross Longs: | 69,654 | 119,887 | 11,750 |
| – Gross Shorts: | 41,618 | 150,865 | 8,808 |
| – Long to Short Ratio: | 1.7 to 1 | 0.8 to 1 | 1.3 to 1 |
| NET POSITION TREND: | |||
| – COT Index Score (3 Year Range Pct): | 48.9 | 51.2 | 41.9 |
| – COT Index Reading (3 Year Range): | Bearish | Bullish | Bearish |
| NET POSITION MOVEMENT INDEX: | |||
| – 6-Week Change in Strength Index: | 17.5 | -17.5 | 3.9 |
WHEAT Futures:
 The WHEAT large speculator standing this week was a net position of 4,574 contracts in the data reported through Tuesday. This was a weekly decline of -12,966 contracts from the previous week which had a total of 17,540 net contracts.
This week’s current strength score (the trader positioning range over the past three years, measured from 0 to 100) shows the speculators are currently Bullish with a score of 50.9 percent. The commercials are Bearish with a score of 48.7 percent and the small traders (not shown in chart) are Bearish with a score of 41.2 percent.
| WHEAT Futures Statistics | SPECULATORS | COMMERCIALS | SMALL TRADERS |
| – Percent of Open Interest Longs: | 25.7 | 42.8 | 7.3 |
| – Percent of Open Interest Shorts: | 24.4 | 40.6 | 10.9 |
| – Net Position: | 4,574 | 8,069 | -12,643 |
| – Gross Longs: | 92,418 | 154,026 | 26,416 |
| – Gross Shorts: | 87,844 | 145,957 | 39,059 |
| – Long to Short Ratio: | 1.1 to 1 | 1.1 to 1 | 0.7 to 1 |
| NET POSITION TREND: | |||
| – COT Index Score (3 Year Range Pct): | 50.9 | 48.7 | 41.2 |
| – COT Index Reading (3 Year Range): | Bullish | Bearish | Bearish |
| NET POSITION MOVEMENT INDEX: | |||
| – 6-Week Change in Strength Index: | -31.0 | 35.3 | 0.6 |
Article By CountingPips.com – Receive our weekly COT Reports by Email
*COT Report: The COT data, released weekly to the public each Friday, is updated through the most recent Tuesday (data is 3 days old) and shows a quick view of how large speculators or non-commercials (for-profit traders) were positioned in the futures markets.
The CFTC categorizes trader positions according to commercial hedgers (traders who use futures contracts for hedging as part of the business), non-commercials (large traders who speculate to realize trading profits) and nonreportable traders (usually small traders/speculators).
Find CFTC criteria here: (http://www.cftc.gov/MarketReports/CommitmentsofTraders/ExplanatoryNotes/index.htm).

- COT Metals Charts: Weekly Speculator Bets led by Copper & Steel Jul 18, 2026
- COT Bonds Charts: Weekly Speculator Bets led by 2-Year, SOFR 3M & 5-Year Bonds Jul 18, 2026
- COT Energy Charts: Weekly Speculator Bets led by Brent Oil & Heating Oil Jul 18, 2026
- COT Soft Commodities Charts: Weekly Speculator Bets led by Wheat, Corn & Soybean Meal Jul 18, 2026
- The Bank of Canada kept its interest rate unchanged. Platinum prices reached a three‑week high Jul 16, 2026
- Stock indices rose after the release of US inflation data. China’s GDP slowed sharply Jul 15, 2026
- GBP/USD Awaits Political News: What Will Happen Next Jul 15, 2026
- USD/JPY Holds at Highs: Pressure Lingers on Yen Jul 14, 2026
- Oil prices jumped 4% amid a new wave of escalation between the US and Iran Jul 13, 2026
- EUR/USD: US Inflation Will Determine Everything Jul 13, 2026