
By CountingPips.com COT Home | Data Tables | Data Downloads | Newsletter
Here are the latest charts and statistics for the Commitment of Traders (COT) data published by the Commodities Futures Trading Commission (CFTC).
The latest COT data is updated through Tuesday September 7th 2021 and shows a quick view of how large traders (for-profit speculators and commercial entities) were positioned in the futures markets.
CORN Futures:
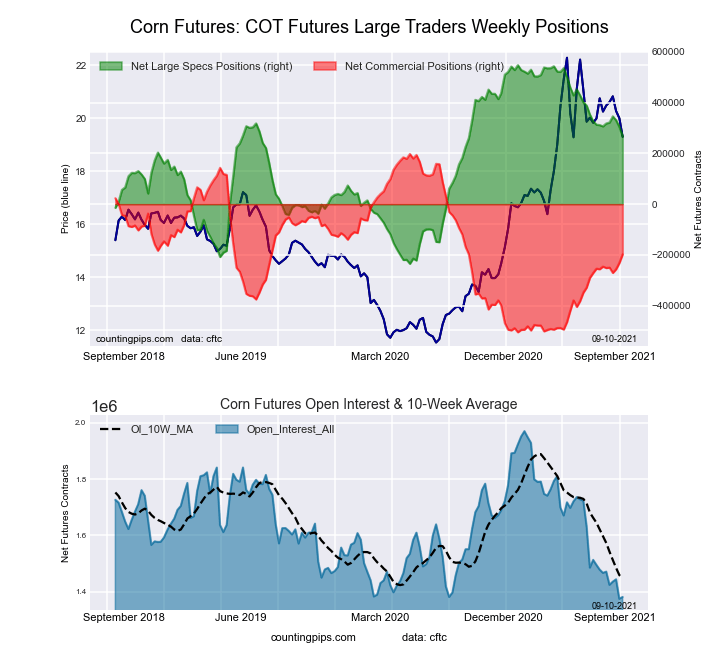 The CORN large speculator standing this week came in at a net position of 267,777 contracts in the data reported through Tuesday. This was a weekly decline of -36,395 contracts from the previous week which had a total of 304,172 net contracts.
This week’s current strength score (the trader positioning range over the past three years, measured from 0 to 100) shows the speculators are currently Bullish with a score of 64.2 percent. The commercials are Bearish with a score of 43.7 percent and the small traders (not shown in chart) are Bearish-Extreme with a score of 3.1 percent.
| CORN Futures Statistics | SPECULATORS | COMMERCIALS | SMALL TRADERS |
| – Percent of Open Interest Longs: | 27.7 | 50.1 | 8.0 |
| – Percent of Open Interest Shorts: | 8.3 | 64.5 | 13.0 |
| – Net Position: | 267,777 | -198,239 | -69,538 |
| – Gross Longs: | 382,214 | 692,539 | 110,557 |
| – Gross Shorts: | 114,437 | 890,778 | 180,095 |
| – Long to Short Ratio: | 3.3 to 1 | 0.8 to 1 | 0.6 to 1 |
| NET POSITION TREND: | |||
| – COT Index Score (3 Year Range Pct): | 64.2 | 43.7 | 3.1 |
| – COT Index Reading (3 Year Range): | Bullish | Bearish | Bearish-Extreme |
| NET POSITION MOVEMENT INDEX: | |||
| – 6-Week Change in Strength Index: | -5.0 | 6.8 | -5.3 |
Free Reports:
 Sign Up for Our Stock Market Newsletter – Get updated on News, Charts & Rankings of Public Companies when you join our Stocks Newsletter
 Get our Weekly Commitment of Traders Reports - See where the biggest traders (Hedge Funds and Commercial Hedgers) are positioned in the futures markets on a weekly basis.
SUGAR Futures:
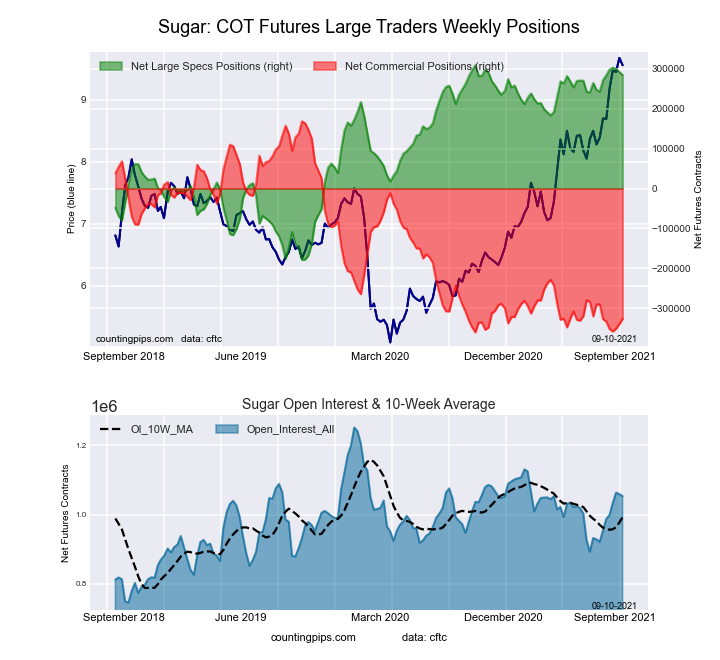 The SUGAR large speculator standing this week came in at a net position of 283,929 contracts in the data reported through Tuesday. This was a weekly fall of -7,503 contracts from the previous week which had a total of 291,432 net contracts.
This week’s current strength score (the trader positioning range over the past three years, measured from 0 to 100) shows the speculators are currently Bullish-Extreme with a score of 95.0 percent. The commercials are Bearish-Extreme with a score of 6.4 percent and the small traders (not shown in chart) are Bullish with a score of 59.5 percent.
| SUGAR Futures Statistics | SPECULATORS | COMMERCIALS | SMALL TRADERS |
| – Percent of Open Interest Longs: | 31.1 | 45.1 | 8.3 |
| – Percent of Open Interest Shorts: | 4.2 | 76.0 | 4.4 |
| – Net Position: | 283,929 | -325,732 | 41,803 |
| – Gross Longs: | 327,732 | 474,810 | 87,890 |
| – Gross Shorts: | 43,803 | 800,542 | 46,087 |
| – Long to Short Ratio: | 7.5 to 1 | 0.6 to 1 | 1.9 to 1 |
| NET POSITION TREND: | |||
| – COT Index Score (3 Year Range Pct): | 95.0 | 6.4 | 59.5 |
| – COT Index Reading (3 Year Range): | Bullish-Extreme | Bearish-Extreme | Bullish |
| NET POSITION MOVEMENT INDEX: | |||
| – 6-Week Change in Strength Index: | 2.7 | 0.2 | -17.2 |
COFFEE Futures:
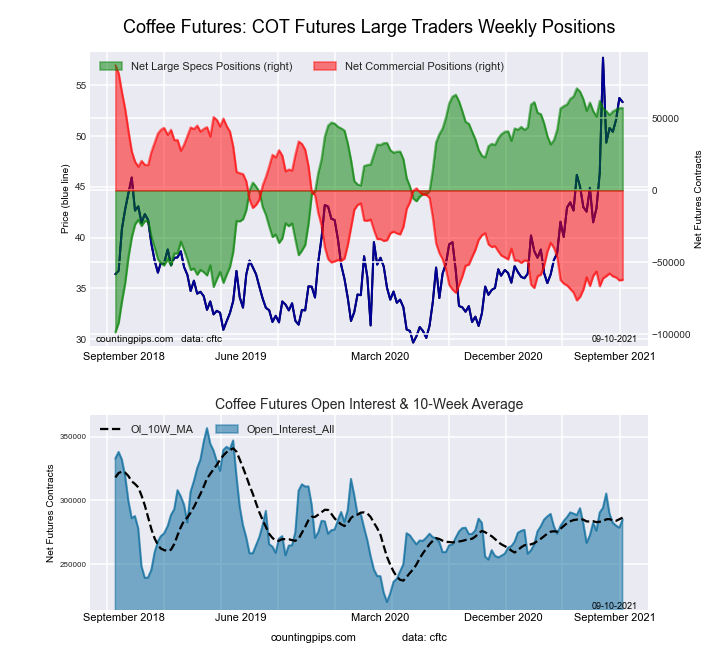 The COFFEE large speculator standing this week came in at a net position of 57,115 contracts in the data reported through Tuesday. This was a weekly gain of 42 contracts from the previous week which had a total of 57,073 net contracts.
This week’s current strength score (the trader positioning range over the past three years, measured from 0 to 100) shows the speculators are currently Bullish-Extreme with a score of 91.9 percent. The commercials are Bearish-Extreme with a score of 8.7 percent and the small traders (not shown in chart) are Bearish with a score of 22.7 percent.
| COFFEE Futures Statistics | SPECULATORS | COMMERCIALS | SMALL TRADERS |
| – Percent of Open Interest Longs: | 26.5 | 43.4 | 3.7 |
| – Percent of Open Interest Shorts: | 6.5 | 65.2 | 2.0 |
| – Net Position: | 57,115 | -62,088 | 4,973 |
| – Gross Longs: | 75,617 | 123,710 | 10,679 |
| – Gross Shorts: | 18,502 | 185,798 | 5,706 |
| – Long to Short Ratio: | 4.1 to 1 | 0.7 to 1 | 1.9 to 1 |
| NET POSITION TREND: | |||
| – COT Index Score (3 Year Range Pct): | 91.9 | 8.7 | 22.7 |
| – COT Index Reading (3 Year Range): | Bullish-Extreme | Bearish-Extreme | Bearish |
| NET POSITION MOVEMENT INDEX: | |||
| – 6-Week Change in Strength Index: | 0.2 | -0.6 | 4.3 |
SOYBEANS Futures:
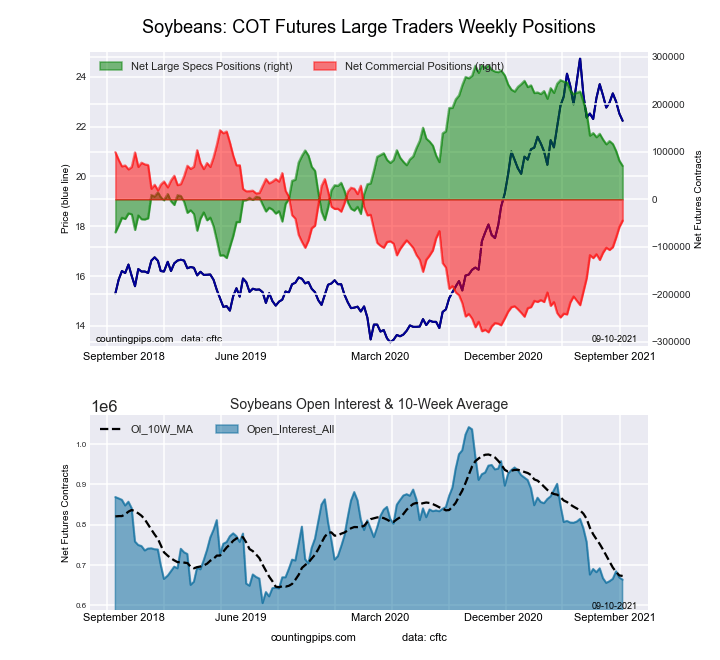 The SOYBEANS large speculator standing this week came in at a net position of 70,237 contracts in the data reported through Tuesday. This was a weekly decrease of -10,898 contracts from the previous week which had a total of 81,135 net contracts.
This week’s current strength score (the trader positioning range over the past three years, measured from 0 to 100) shows the speculators are currently Bearish with a score of 47.8 percent. The commercials are Bullish with a score of 55.3 percent and the small traders (not shown in chart) are Bearish with a score of 29.6 percent.
| SOYBEANS Futures Statistics | SPECULATORS | COMMERCIALS | SMALL TRADERS |
| – Percent of Open Interest Longs: | 22.4 | 55.7 | 6.8 |
| – Percent of Open Interest Shorts: | 11.8 | 62.5 | 10.6 |
| – Net Position: | 70,237 | -44,835 | -25,402 |
| – Gross Longs: | 148,848 | 370,121 | 44,966 |
| – Gross Shorts: | 78,611 | 414,956 | 70,368 |
| – Long to Short Ratio: | 1.9 to 1 | 0.9 to 1 | 0.6 to 1 |
| NET POSITION TREND: | |||
| – COT Index Score (3 Year Range Pct): | 47.8 | 55.3 | 29.6 |
| – COT Index Reading (3 Year Range): | Bearish | Bullish | Bearish |
| NET POSITION MOVEMENT INDEX: | |||
| – 6-Week Change in Strength Index: | -13.7 | 15.9 | -20.1 |
SOYBEAN MEAL Futures:
 The SOYBEAN MEAL large speculator standing this week came in at a net position of 19,845 contracts in the data reported through Tuesday. This was a weekly reduction of -20,663 contracts from the previous week which had a total of 40,508 net contracts.
This week’s current strength score (the trader positioning range over the past three years, measured from 0 to 100) shows the speculators are currently Bearish with a score of 40.4 percent. The commercials are Bullish with a score of 61.5 percent and the small traders (not shown in chart) are Bearish with a score of 34.5 percent.
| SOYBEAN MEAL Futures Statistics | SPECULATORS | COMMERCIALS | SMALL TRADERS |
| – Percent of Open Interest Longs: | 23.1 | 51.1 | 12.6 |
| – Percent of Open Interest Shorts: | 17.6 | 61.0 | 8.2 |
| – Net Position: | 19,845 | -35,775 | 15,930 |
| – Gross Longs: | 83,161 | 183,582 | 45,390 |
| – Gross Shorts: | 63,316 | 219,357 | 29,460 |
| – Long to Short Ratio: | 1.3 to 1 | 0.8 to 1 | 1.5 to 1 |
| NET POSITION TREND: | |||
| – COT Index Score (3 Year Range Pct): | 40.4 | 61.5 | 34.5 |
| – COT Index Reading (3 Year Range): | Bearish | Bullish | Bearish |
| NET POSITION MOVEMENT INDEX: | |||
| – 6-Week Change in Strength Index: | -18.5 | 20.4 | -18.2 |
LIVE CATTLE Futures:
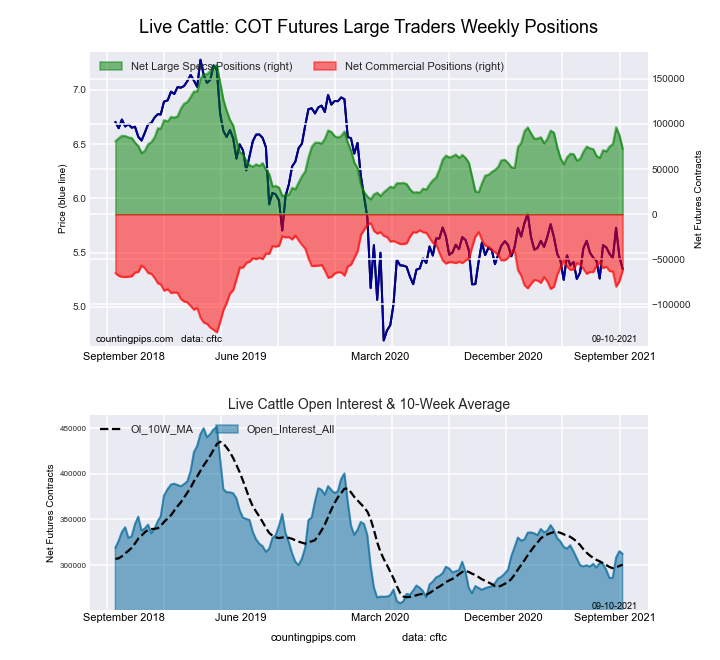 The LIVE CATTLE large speculator standing this week came in at a net position of 72,499 contracts in the data reported through Tuesday. This was a weekly fall of -15,066 contracts from the previous week which had a total of 87,565 net contracts.
This week’s current strength score (the trader positioning range over the past three years, measured from 0 to 100) shows the speculators are currently Bearish with a score of 37.7 percent. The commercials are Bullish with a score of 56.8 percent and the small traders (not shown in chart) are Bullish with a score of 61.7 percent.
| LIVE CATTLE Futures Statistics | SPECULATORS | COMMERCIALS | SMALL TRADERS |
| – Percent of Open Interest Longs: | 34.9 | 38.5 | 9.2 |
| – Percent of Open Interest Shorts: | 11.7 | 58.4 | 12.6 |
| – Net Position: | 72,499 | -62,073 | -10,426 |
| – Gross Longs: | 108,885 | 120,354 | 28,857 |
| – Gross Shorts: | 36,386 | 182,427 | 39,283 |
| – Long to Short Ratio: | 3.0 to 1 | 0.7 to 1 | 0.7 to 1 |
| NET POSITION TREND: | |||
| – COT Index Score (3 Year Range Pct): | 37.7 | 56.8 | 61.7 |
| – COT Index Reading (3 Year Range): | Bearish | Bullish | Bullish |
| NET POSITION MOVEMENT INDEX: | |||
| – 6-Week Change in Strength Index: | 1.0 | -2.0 | 2.2 |
LEAN HOGS Futures:
 The LEAN HOGS large speculator standing this week came in at a net position of 76,355 contracts in the data reported through Tuesday. This was a weekly gain of 1,869 contracts from the previous week which had a total of 74,486 net contracts.
This week’s current strength score (the trader positioning range over the past three years, measured from 0 to 100) shows the speculators are currently Bullish-Extreme with a score of 90.3 percent. The commercials are Bearish-Extreme with a score of 19.7 percent and the small traders (not shown in chart) are Bearish-Extreme with a score of 2.5 percent.
| LEAN HOGS Futures Statistics | SPECULATORS | COMMERCIALS | SMALL TRADERS |
| – Percent of Open Interest Longs: | 44.8 | 31.5 | 7.1 |
| – Percent of Open Interest Shorts: | 16.5 | 53.9 | 13.0 |
| – Net Position: | 76,355 | -60,456 | -15,899 |
| – Gross Longs: | 120,834 | 84,803 | 19,074 |
| – Gross Shorts: | 44,479 | 145,259 | 34,973 |
| – Long to Short Ratio: | 2.7 to 1 | 0.6 to 1 | 0.5 to 1 |
| NET POSITION TREND: | |||
| – COT Index Score (3 Year Range Pct): | 90.3 | 19.7 | 2.5 |
| – COT Index Reading (3 Year Range): | Bullish-Extreme | Bearish-Extreme | Bearish-Extreme |
| NET POSITION MOVEMENT INDEX: | |||
| – 6-Week Change in Strength Index: | -7.0 | 9.6 | -11.5 |
COTTON Futures:
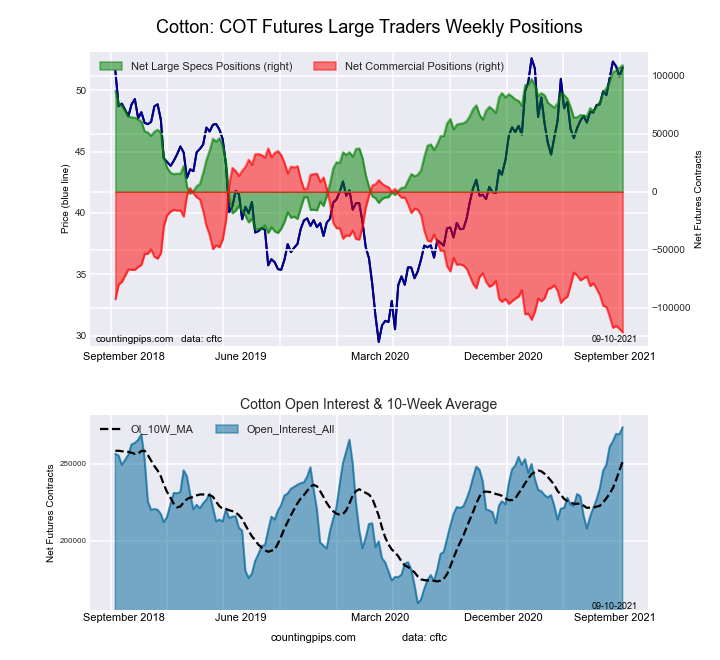 The COTTON large speculator standing this week came in at a net position of 108,915 contracts in the data reported through Tuesday. This was a weekly rise of 2,201 contracts from the previous week which had a total of 106,714 net contracts.
This week’s current strength score (the trader positioning range over the past three years, measured from 0 to 100) shows the speculators are currently Bullish-Extreme with a score of 100.0 percent. The commercials are Bearish-Extreme with a score of 0.0 percent and the small traders (not shown in chart) are Bullish-Extreme with a score of 88.1 percent.
| COTTON Futures Statistics | SPECULATORS | COMMERCIALS | SMALL TRADERS |
| – Percent of Open Interest Longs: | 44.8 | 34.8 | 7.2 |
| – Percent of Open Interest Shorts: | 5.0 | 78.9 | 2.8 |
| – Net Position: | 108,915 | -120,863 | 11,948 |
| – Gross Longs: | 122,708 | 95,353 | 19,691 |
| – Gross Shorts: | 13,793 | 216,216 | 7,743 |
| – Long to Short Ratio: | 8.9 to 1 | 0.4 to 1 | 2.5 to 1 |
| NET POSITION TREND: | |||
| – COT Index Score (3 Year Range Pct): | 100.0 | 0.0 | 88.1 |
| – COT Index Reading (3 Year Range): | Bullish-Extreme | Bearish-Extreme | Bullish-Extreme |
| NET POSITION MOVEMENT INDEX: | |||
| – 6-Week Change in Strength Index: | 16.0 | -14.5 | -0.6 |
COCOA Futures:
 The COCOA large speculator standing this week came in at a net position of 30,441 contracts in the data reported through Tuesday. This was a weekly lift of 2,532 contracts from the previous week which had a total of 27,909 net contracts.
This week’s current strength score (the trader positioning range over the past three years, measured from 0 to 100) shows the speculators are currently Bullish with a score of 51.1 percent. The commercials are Bearish with a score of 48.2 percent and the small traders (not shown in chart) are Bullish with a score of 53.2 percent.
| COCOA Futures Statistics | SPECULATORS | COMMERCIALS | SMALL TRADERS |
| – Percent of Open Interest Longs: | 29.6 | 52.2 | 5.2 |
| – Percent of Open Interest Shorts: | 16.4 | 67.2 | 3.5 |
| – Net Position: | 30,441 | -34,369 | 3,928 |
| – Gross Longs: | 68,187 | 120,163 | 12,015 |
| – Gross Shorts: | 37,746 | 154,532 | 8,087 |
| – Long to Short Ratio: | 1.8 to 1 | 0.8 to 1 | 1.5 to 1 |
| NET POSITION TREND: | |||
| – COT Index Score (3 Year Range Pct): | 51.1 | 48.2 | 53.2 |
| – COT Index Reading (3 Year Range): | Bullish | Bearish | Bullish |
| NET POSITION MOVEMENT INDEX: | |||
| – 6-Week Change in Strength Index: | 20.8 | -21.4 | 12.8 |
WHEAT Futures:
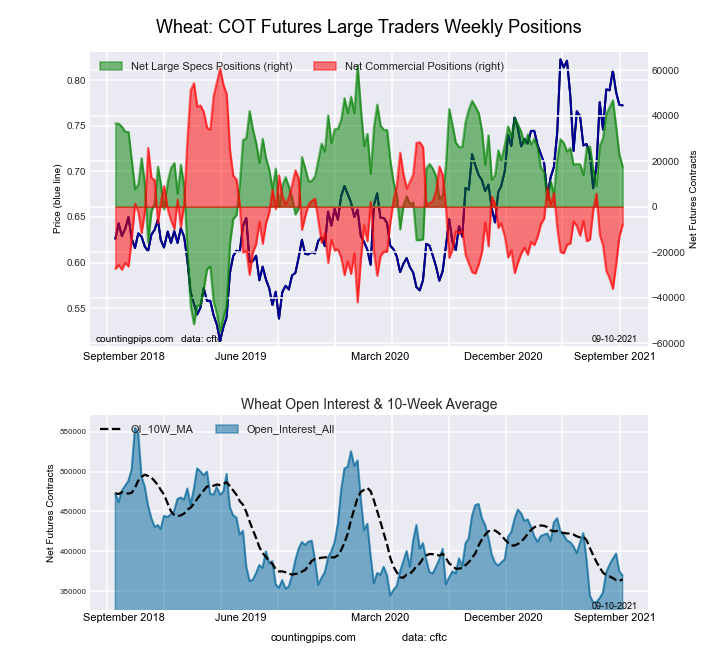 The WHEAT large speculator standing this week came in at a net position of 17,540 contracts in the data reported through Tuesday. This was a weekly fall of -5,265 contracts from the previous week which had a total of 22,805 net contracts.
This week’s current strength score (the trader positioning range over the past three years, measured from 0 to 100) shows the speculators are currently Bullish with a score of 62.0 percent. The commercials are Bearish with a score of 33.2 percent and the small traders (not shown in chart) are Bullish with a score of 55.1 percent.
| WHEAT Futures Statistics | SPECULATORS | COMMERCIALS | SMALL TRADERS |
| – Percent of Open Interest Longs: | 29.3 | 39.4 | 7.4 |
| – Percent of Open Interest Shorts: | 24.6 | 41.5 | 10.0 |
| – Net Position: | 17,540 | -7,819 | -9,721 |
| – Gross Longs: | 108,298 | 145,427 | 27,296 |
| – Gross Shorts: | 90,758 | 153,246 | 37,017 |
| – Long to Short Ratio: | 1.2 to 1 | 0.9 to 1 | 0.7 to 1 |
| NET POSITION TREND: | |||
| – COT Index Score (3 Year Range Pct): | 62.0 | 33.2 | 55.1 |
| – COT Index Reading (3 Year Range): | Bullish | Bearish | Bullish |
| NET POSITION MOVEMENT INDEX: | |||
| – 6-Week Change in Strength Index: | -10.8 | 8.9 | 16.8 |
Article By CountingPips.com – Receive our weekly COT Reports by Email
*COT Report: The COT data, released weekly to the public each Friday, is updated through the most recent Tuesday (data is 3 days old) and shows a quick view of how large speculators or non-commercials (for-profit traders) were positioned in the futures markets.
The CFTC categorizes trader positions according to commercial hedgers (traders who use futures contracts for hedging as part of the business), non-commercials (large traders who speculate to realize trading profits) and nonreportable traders (usually small traders/speculators).
Find CFTC criteria here: (http://www.cftc.gov/MarketReports/CommitmentsofTraders/ExplanatoryNotes/index.htm).

- COT Metals Charts: Weekly Speculator Bets led by Copper & Steel Jul 18, 2026
- COT Bonds Charts: Weekly Speculator Bets led by 2-Year, SOFR 3M & 5-Year Bonds Jul 18, 2026
- COT Energy Charts: Weekly Speculator Bets led by Brent Oil & Heating Oil Jul 18, 2026
- COT Soft Commodities Charts: Weekly Speculator Bets led by Wheat, Corn & Soybean Meal Jul 18, 2026
- The Bank of Canada kept its interest rate unchanged. Platinum prices reached a three‑week high Jul 16, 2026
- Stock indices rose after the release of US inflation data. China’s GDP slowed sharply Jul 15, 2026
- GBP/USD Awaits Political News: What Will Happen Next Jul 15, 2026
- USD/JPY Holds at Highs: Pressure Lingers on Yen Jul 14, 2026
- Oil prices jumped 4% amid a new wave of escalation between the US and Iran Jul 13, 2026
- EUR/USD: US Inflation Will Determine Everything Jul 13, 2026