By CountingPips.com COT Home | Data Tables | Data Downloads | Newsletter
Here are the latest charts and statistics for the Commitment of Traders (COT) data published by the Commodities Futures Trading Commission (CFTC).
The latest COT data is updated through Tuesday August 31 2021 and shows a quick view of how large traders (for-profit speculators and commercial entities) were positioned in the futures markets. All currency positions are in direct relation to the US dollar where, for example, a bet for the euro is a bet that the euro will rise versus the dollar while a bet against the euro will be a bet that the euro will decline versus the dollar.
US Dollar Index Futures:
 The US Dollar Index large speculator standing this week totaled a net position of 20,690 contracts in the data reported through Tuesday. This was a weekly rise of 328 contracts from the previous week which had a total of 20,362 net contracts.
This week’s current strength score (the trader positioning range over the past three years, measured from 0 to 100) shows the speculators are currently Bullish with a score of 61.5 percent. The commercials are Bearish with a score of 31.1 percent and the small traders (not shown in chart) are Bullish-Extreme with a score of 97.0 percent.
| US DOLLAR INDEX Statistics | SPECULATORS | COMMERCIALS | SMALL TRADERS |
| – Percent of Open Interest Longs: | 73.5 | 4.3 | 15.4 |
| – Percent of Open Interest Shorts: | 31.1 | 57.9 | 4.2 |
| – Net Position: | 20,690 | -26,183 | 5,493 |
| – Gross Longs: | 35,902 | 2,091 | 7,535 |
| – Gross Shorts: | 15,212 | 28,274 | 2,042 |
| – Long to Short Ratio: | 2.4 to 1 | 0.1 to 1 | 3.7 to 1 |
| NET POSITION TREND: | |||
| – COT Index Score (3 Year Range Pct): | 61.5 | 31.1 | 97.0 |
| – COT Index Reading (3 Year Range): | Bullish | Bearish | Bullish-Extreme |
| NET POSITION MOVEMENT INDEX: | |||
| – 6-Week Change in Strength Index: | 14.7 | -13.9 | -1.7 |
Free Reports:
 Get our Weekly Commitment of Traders Reports - See where the biggest traders (Hedge Funds and Commercial Hedgers) are positioned in the futures markets on a weekly basis.
 Download Our Metatrader 4 Indicators – Put Our Free MetaTrader 4 Custom Indicators on your charts when you join our Weekly Newsletter
Euro Currency Futures:
 The Euro Currency large speculator standing this week totaled a net position of 10,476 contracts in the data reported through Tuesday. This was a weekly reduction of -14,154 contracts from the previous week which had a total of 24,630 net contracts.
This week’s current strength score (the trader positioning range over the past three years, measured from 0 to 100) shows the speculators are currently Bearish with a score of 38.2 percent. The commercials are Bullish with a score of 61.0 percent and the small traders (not shown in chart) are Bearish with a score of 46.0 percent.
| EURO Currency Statistics | SPECULATORS | COMMERCIALS | SMALL TRADERS |
| – Percent of Open Interest Longs: | 27.0 | 57.4 | 13.5 |
| – Percent of Open Interest Shorts: | 25.5 | 64.8 | 7.6 |
| – Net Position: | 10,476 | -52,212 | 41,736 |
| – Gross Longs: | 190,593 | 404,630 | 95,205 |
| – Gross Shorts: | 180,117 | 456,842 | 53,469 |
| – Long to Short Ratio: | 1.1 to 1 | 0.9 to 1 | 1.8 to 1 |
| NET POSITION TREND: | |||
| – COT Index Score (3 Year Range Pct): | 38.2 | 61.0 | 46.0 |
| – COT Index Reading (3 Year Range): | Bearish | Bullish | Bearish |
| NET POSITION MOVEMENT INDEX: | |||
| – 6-Week Change in Strength Index: | -10.8 | 8.5 | 8.2 |
British Pound Sterling Futures:
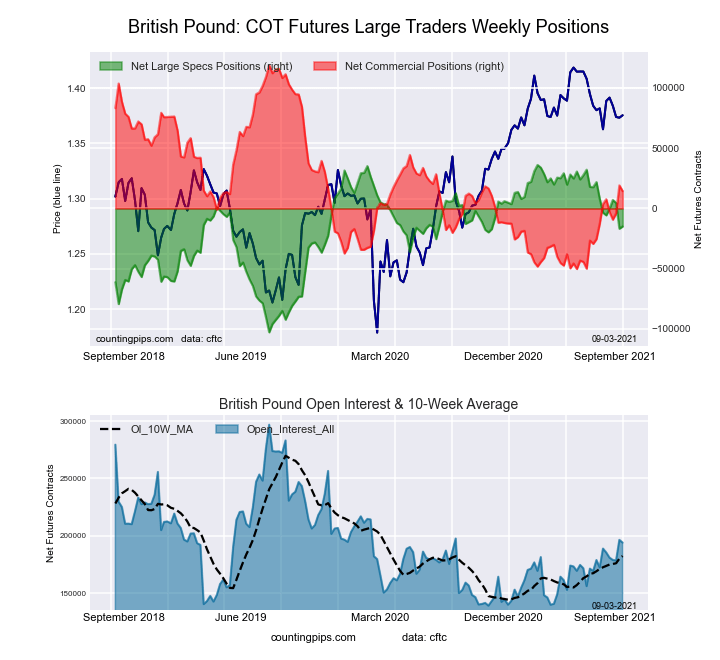 The British Pound Sterling large speculator standing this week totaled a net position of -14,900 contracts in the data reported through Tuesday. This was a weekly boost of 1,845 contracts from the previous week which had a total of -16,745 net contracts.
This week’s current strength score (the trader positioning range over the past three years, measured from 0 to 100) shows the speculators are currently Bullish with a score of 63.3 percent. The commercials are Bearish with a score of 38.2 percent and the small traders (not shown in chart) are Bullish with a score of 56.6 percent.
| BRITISH POUND Statistics | SPECULATORS | COMMERCIALS | SMALL TRADERS |
| – Percent of Open Interest Longs: | 18.8 | 65.2 | 14.9 |
| – Percent of Open Interest Shorts: | 26.5 | 57.7 | 14.7 |
| – Net Position: | -14,900 | 14,435 | 465 |
| – Gross Longs: | 36,544 | 126,407 | 28,992 |
| – Gross Shorts: | 51,444 | 111,972 | 28,527 |
| – Long to Short Ratio: | 0.7 to 1 | 1.1 to 1 | 1.0 to 1 |
| NET POSITION TREND: | |||
| – COT Index Score (3 Year Range Pct): | 63.3 | 38.2 | 56.6 |
| – COT Index Reading (3 Year Range): | Bullish | Bearish | Bullish |
| NET POSITION MOVEMENT INDEX: | |||
| – 6-Week Change in Strength Index: | -8.2 | 6.3 | 1.5 |
Japanese Yen Futures:
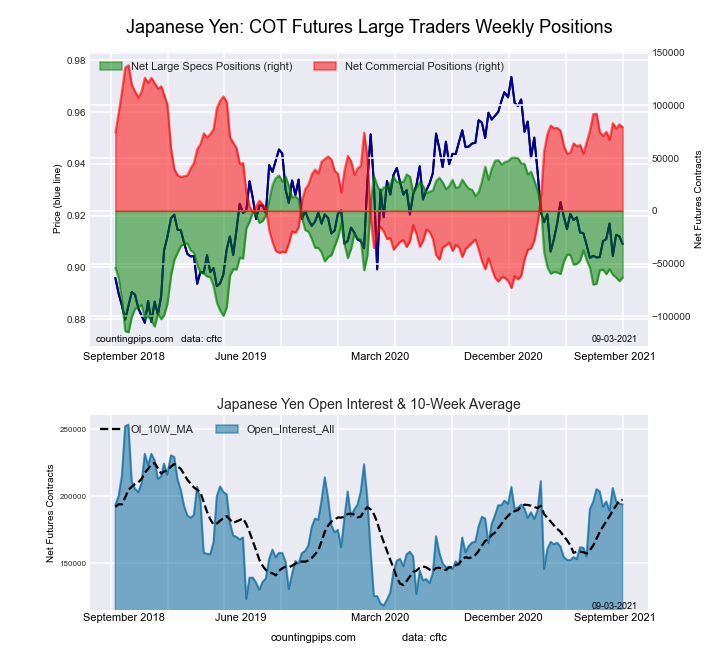 The Japanese Yen large speculator standing this week totaled a net position of -63,130 contracts in the data reported through Tuesday. This was a weekly rise of 3,541 contracts from the previous week which had a total of -66,671 net contracts.
This week’s current strength score (the trader positioning range over the past three years, measured from 0 to 100) shows the speculators are currently Bearish with a score of 31.4 percent. The commercials are Bullish with a score of 72.2 percent and the small traders (not shown in chart) are Bearish with a score of 25.1 percent.
| JAPANESE YEN Statistics | SPECULATORS | COMMERCIALS | SMALL TRADERS |
| – Percent of Open Interest Longs: | 15.0 | 74.7 | 9.8 |
| – Percent of Open Interest Shorts: | 47.5 | 33.7 | 18.2 |
| – Net Position: | -63,130 | 79,415 | -16,285 |
| – Gross Longs: | 29,030 | 144,849 | 18,955 |
| – Gross Shorts: | 92,160 | 65,434 | 35,240 |
| – Long to Short Ratio: | 0.3 to 1 | 2.2 to 1 | 0.5 to 1 |
| NET POSITION TREND: | |||
| – COT Index Score (3 Year Range Pct): | 31.4 | 72.2 | 25.1 |
| – COT Index Reading (3 Year Range): | Bearish | Bullish | Bearish |
| NET POSITION MOVEMENT INDEX: | |||
| – 6-Week Change in Strength Index: | -4.5 | 3.9 | -1.4 |
Swiss Franc Futures:
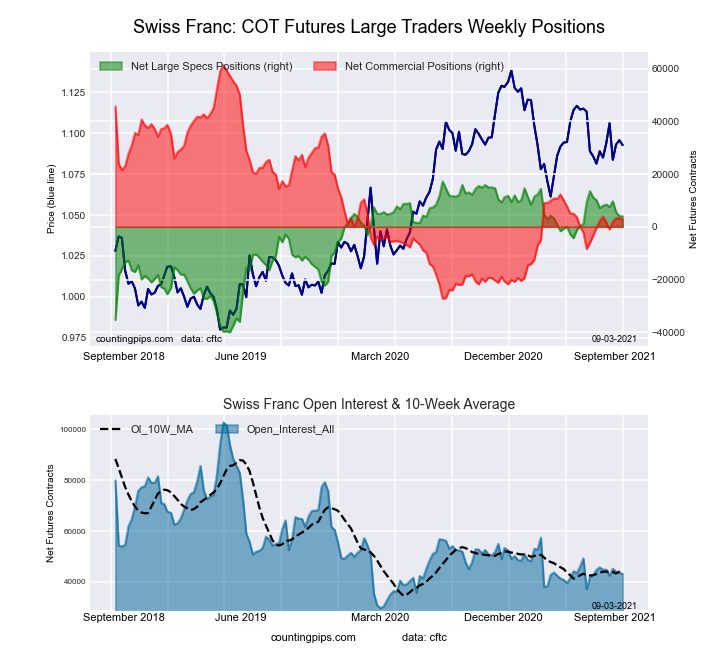 The Swiss Franc large speculator standing this week totaled a net position of 3,975 contracts in the data reported through Tuesday. This was a weekly lowering of -119 contracts from the previous week which had a total of 4,094 net contracts.
This week’s current strength score (the trader positioning range over the past three years, measured from 0 to 100) shows the speculators are currently Bullish with a score of 76.9 percent. The commercials are Bearish with a score of 33.9 percent and the small traders (not shown in chart) are Bearish with a score of 43.6 percent.
| SWISS FRANC Statistics | SPECULATORS | COMMERCIALS | SMALL TRADERS |
| – Percent of Open Interest Longs: | 33.1 | 42.1 | 24.2 |
| – Percent of Open Interest Shorts: | 23.9 | 35.7 | 39.8 |
| – Net Position: | 3,975 | 2,741 | -6,716 |
| – Gross Longs: | 14,259 | 18,116 | 10,411 |
| – Gross Shorts: | 10,284 | 15,375 | 17,127 |
| – Long to Short Ratio: | 1.4 to 1 | 1.2 to 1 | 0.6 to 1 |
| NET POSITION TREND: | |||
| – COT Index Score (3 Year Range Pct): | 76.9 | 33.9 | 43.6 |
| – COT Index Reading (3 Year Range): | Bullish | Bearish | Bearish |
| NET POSITION MOVEMENT INDEX: | |||
| – 6-Week Change in Strength Index: | -7.1 | -1.2 | 15.0 |
Canadian Dollar Futures:
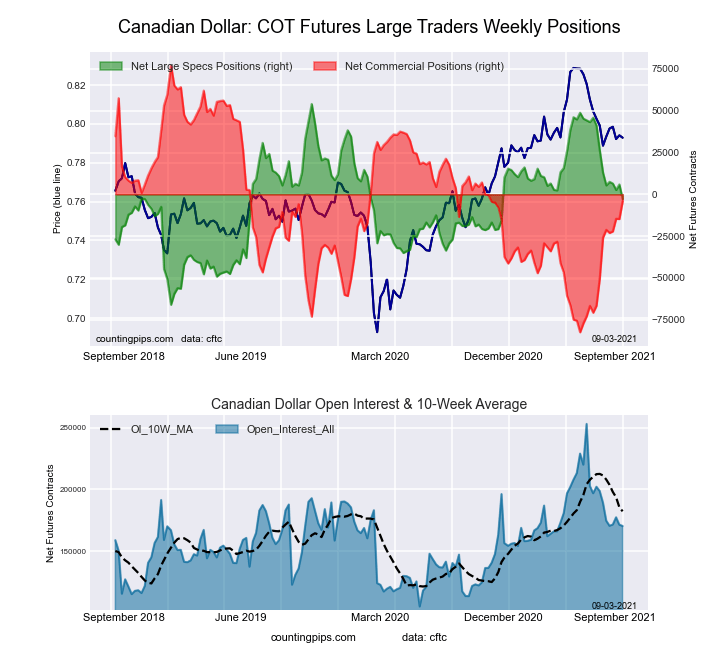 The Canadian Dollar large speculator standing this week totaled a net position of -2,848 contracts in the data reported through Tuesday. This was a weekly reduction of -8,725 contracts from the previous week which had a total of 5,877 net contracts.
This week’s current strength score (the trader positioning range over the past three years, measured from 0 to 100) shows the speculators are currently Bullish with a score of 52.6 percent. The commercials are Bearish with a score of 49.1 percent and the small traders (not shown in chart) are Bullish with a score of 57.3 percent.
| CANADIAN DOLLAR Statistics | SPECULATORS | COMMERCIALS | SMALL TRADERS |
| – Percent of Open Interest Longs: | 23.9 | 54.3 | 20.2 |
| – Percent of Open Interest Shorts: | 25.5 | 56.7 | 16.1 |
| – Net Position: | -2,848 | -4,102 | 6,950 |
| – Gross Longs: | 40,686 | 92,528 | 34,457 |
| – Gross Shorts: | 43,534 | 96,630 | 27,507 |
| – Long to Short Ratio: | 0.9 to 1 | 1.0 to 1 | 1.3 to 1 |
| NET POSITION TREND: | |||
| – COT Index Score (3 Year Range Pct): | 52.6 | 49.1 | 57.3 |
| – COT Index Reading (3 Year Range): | Bullish | Bearish | Bullish |
| NET POSITION MOVEMENT INDEX: | |||
| – 6-Week Change in Strength Index: | -13.1 | 13.6 | -9.1 |
Australian Dollar Futures:
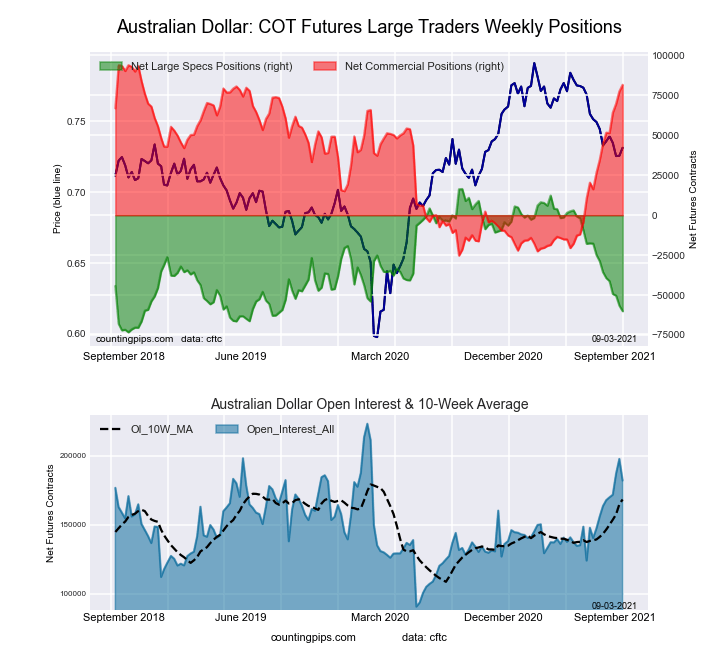 The Australian Dollar large speculator standing this week totaled a net position of -60,078 contracts in the data reported through Tuesday. This was a weekly reduction of -3,478 contracts from the previous week which had a total of -56,600 net contracts.
This week’s current strength score (the trader positioning range over the past three years, measured from 0 to 100) shows the speculators are currently Bearish-Extreme with a score of 14.7 percent. The commercials are Bullish-Extreme with a score of 89.7 percent and the small traders (not shown in chart) are Bearish-Extreme with a score of 9.4 percent.
| AUSTRALIAN DOLLAR Statistics | SPECULATORS | COMMERCIALS | SMALL TRADERS |
| – Percent of Open Interest Longs: | 26.0 | 63.1 | 8.1 |
| – Percent of Open Interest Shorts: | 59.0 | 18.3 | 19.9 |
| – Net Position: | -60,078 | 81,581 | -21,503 |
| – Gross Longs: | 47,384 | 114,931 | 14,812 |
| – Gross Shorts: | 107,462 | 33,350 | 36,315 |
| – Long to Short Ratio: | 0.4 to 1 | 3.4 to 1 | 0.4 to 1 |
| NET POSITION TREND: | |||
| – COT Index Score (3 Year Range Pct): | 14.7 | 89.7 | 9.4 |
| – COT Index Reading (3 Year Range): | Bearish-Extreme | Bullish-Extreme | Bearish-Extreme |
| NET POSITION MOVEMENT INDEX: | |||
| – 6-Week Change in Strength Index: | -27.2 | 30.7 | -27.0 |
New Zealand Dollar Futures:
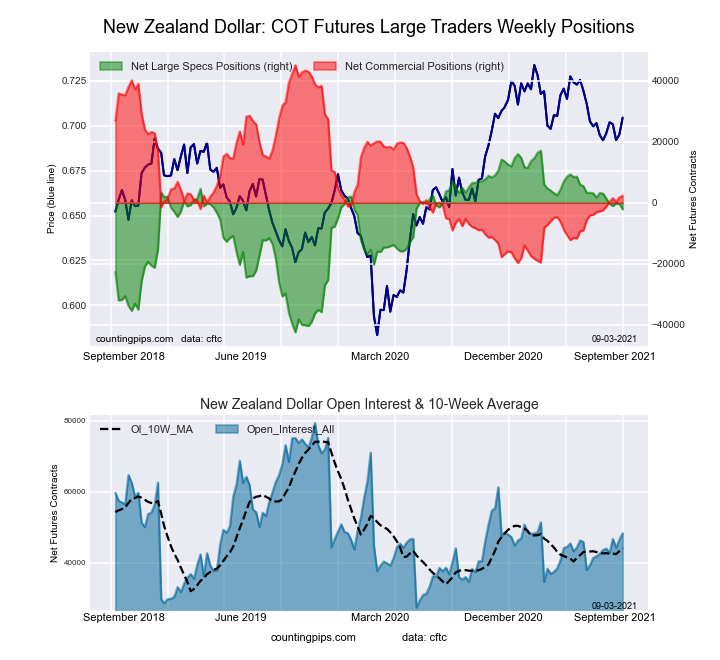 The New Zealand Dollar large speculator standing this week totaled a net position of -2,141 contracts in the data reported through Tuesday. This was a weekly lowering of -1,779 contracts from the previous week which had a total of -362 net contracts.
This week’s current strength score (the trader positioning range over the past three years, measured from 0 to 100) shows the speculators are currently Bullish with a score of 67.7 percent. The commercials are Bearish with a score of 34.1 percent and the small traders (not shown in chart) are Bullish with a score of 50.7 percent.
| NEW ZEALAND DOLLAR Statistics | SPECULATORS | COMMERCIALS | SMALL TRADERS |
| – Percent of Open Interest Longs: | 36.6 | 48.5 | 8.1 |
| – Percent of Open Interest Shorts: | 41.1 | 43.6 | 8.6 |
| – Net Position: | -2,141 | 2,372 | -231 |
| – Gross Longs: | 17,692 | 23,425 | 3,919 |
| – Gross Shorts: | 19,833 | 21,053 | 4,150 |
| – Long to Short Ratio: | 0.9 to 1 | 1.1 to 1 | 0.9 to 1 |
| NET POSITION TREND: | |||
| – COT Index Score (3 Year Range Pct): | 67.7 | 34.1 | 50.7 |
| – COT Index Reading (3 Year Range): | Bullish | Bearish | Bullish |
| NET POSITION MOVEMENT INDEX: | |||
| – 6-Week Change in Strength Index: | -8.7 | 7.4 | 4.1 |
Mexican Peso Futures:
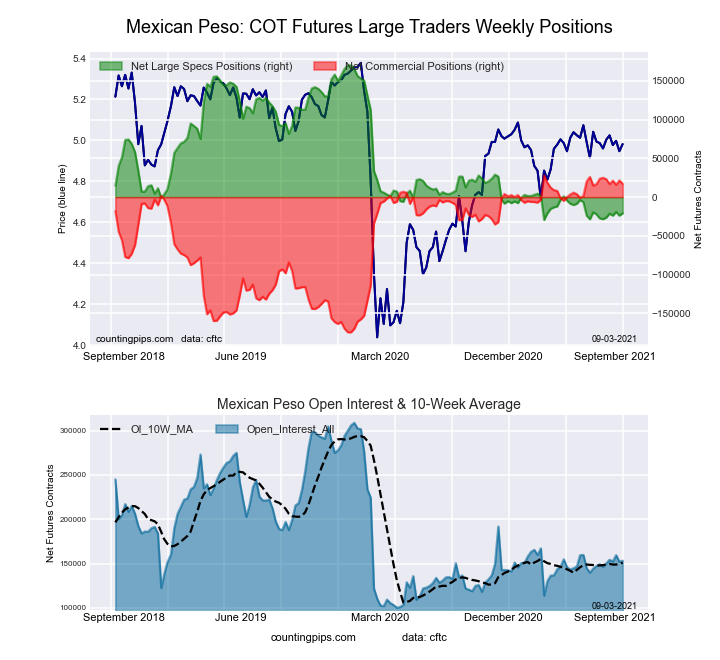 The Mexican Peso large speculator standing this week totaled a net position of -21,043 contracts in the data reported through Tuesday. This was a weekly gain of 2,787 contracts from the previous week which had a total of -23,830 net contracts.
This week’s current strength score (the trader positioning range over the past three years, measured from 0 to 100) shows the speculators are currently Bearish-Extreme with a score of 4.2 percent. The commercials are Bullish-Extreme with a score of 94.6 percent and the small traders (not shown in chart) are Bullish with a score of 59.5 percent.
| MEXICAN PESO Statistics | SPECULATORS | COMMERCIALS | SMALL TRADERS |
| – Percent of Open Interest Longs: | 47.0 | 45.5 | 4.5 |
| – Percent of Open Interest Shorts: | 60.7 | 34.3 | 2.0 |
| – Net Position: | -21,043 | 17,157 | 3,886 |
| – Gross Longs: | 72,052 | 69,809 | 6,924 |
| – Gross Shorts: | 93,095 | 52,652 | 3,038 |
| – Long to Short Ratio: | 0.8 to 1 | 1.3 to 1 | 2.3 to 1 |
| NET POSITION TREND: | |||
| – COT Index Score (3 Year Range Pct): | 4.2 | 94.6 | 59.5 |
| – COT Index Reading (3 Year Range): | Bearish-Extreme | Bullish-Extreme | Bullish |
| NET POSITION MOVEMENT INDEX: | |||
| – 6-Week Change in Strength Index: | 3.7 | -3.9 | 1.9 |
Brazilian Real Futures:
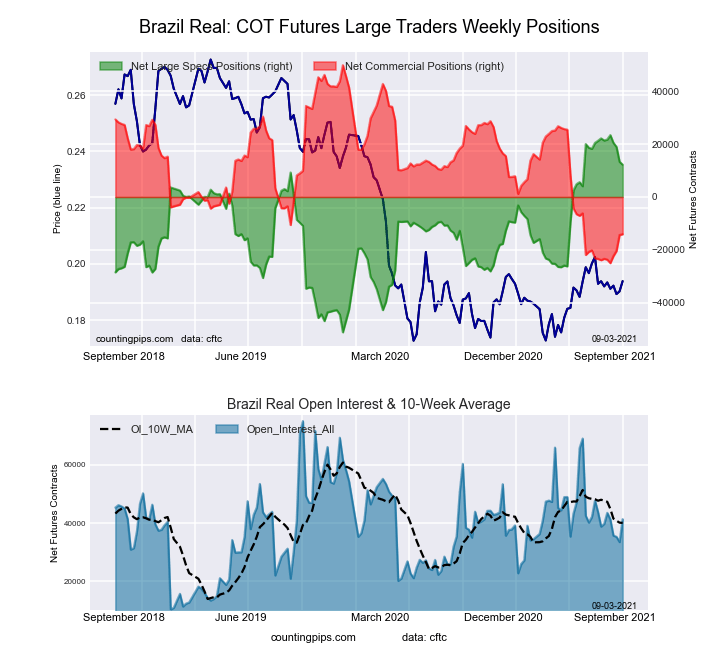 The Brazilian Real large speculator standing this week totaled a net position of 12,258 contracts in the data reported through Tuesday. This was a weekly lowering of -1,088 contracts from the previous week which had a total of 13,346 net contracts.
This week’s current strength score (the trader positioning range over the past three years, measured from 0 to 100) shows the speculators are currently Bullish-Extreme with a score of 85.0 percent. The commercials are Bearish-Extreme with a score of 14.6 percent and the small traders (not shown in chart) are Bullish-Extreme with a score of 89.3 percent.
| BRAZIL REAL Statistics | SPECULATORS | COMMERCIALS | SMALL TRADERS |
| – Percent of Open Interest Longs: | 48.8 | 36.5 | 8.2 |
| – Percent of Open Interest Shorts: | 19.1 | 70.7 | 3.7 |
| – Net Position: | 12,258 | -14,116 | 1,858 |
| – Gross Longs: | 20,165 | 15,078 | 3,398 |
| – Gross Shorts: | 7,907 | 29,194 | 1,540 |
| – Long to Short Ratio: | 2.6 to 1 | 0.5 to 1 | 2.2 to 1 |
| NET POSITION TREND: | |||
| – COT Index Score (3 Year Range Pct): | 85.0 | 14.6 | 89.3 |
| – COT Index Reading (3 Year Range): | Bullish-Extreme | Bearish-Extreme | Bullish-Extreme |
| NET POSITION MOVEMENT INDEX: | |||
| – 6-Week Change in Strength Index: | -12.3 | 12.4 | -2.0 |
Russian Ruble Futures:
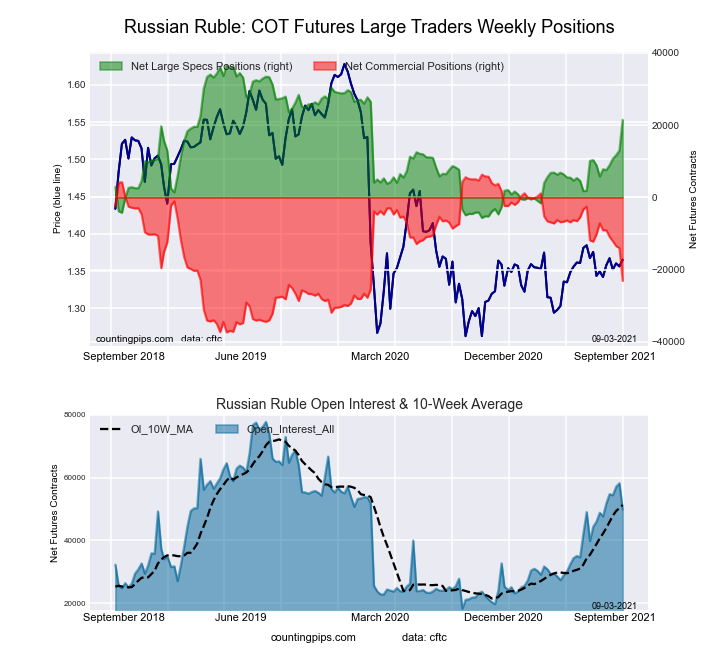 The Russian Ruble large speculator standing this week totaled a net position of 21,471 contracts in the data reported through Tuesday. This was a weekly gain of 8,506 contracts from the previous week which had a total of 12,965 net contracts.
This week’s current strength score (the trader positioning range over the past three years, measured from 0 to 100) shows the speculators are currently Bullish with a score of 64.2 percent. The commercials are Bearish with a score of 32.6 percent and the small traders (not shown in chart) are Bullish-Extreme with a score of 88.9 percent.
| RUSSIAN RUBLE Statistics | SPECULATORS | COMMERCIALS | SMALL TRADERS |
| – Percent of Open Interest Longs: | 51.4 | 43.6 | 5.0 |
| – Percent of Open Interest Shorts: | 8.3 | 89.9 | 1.7 |
| – Net Position: | 21,471 | -23,082 | 1,611 |
| – Gross Longs: | 25,605 | 21,704 | 2,469 |
| – Gross Shorts: | 4,134 | 44,786 | 858 |
| – Long to Short Ratio: | 6.2 to 1 | 0.5 to 1 | 2.9 to 1 |
| NET POSITION TREND: | |||
| – COT Index Score (3 Year Range Pct): | 64.2 | 32.6 | 88.9 |
| – COT Index Reading (3 Year Range): | Bullish | Bearish | Bullish-Extreme |
| NET POSITION MOVEMENT INDEX: | |||
| – 6-Week Change in Strength Index: | 32.4 | -32.1 | 10.1 |
Bitcoin Futures:
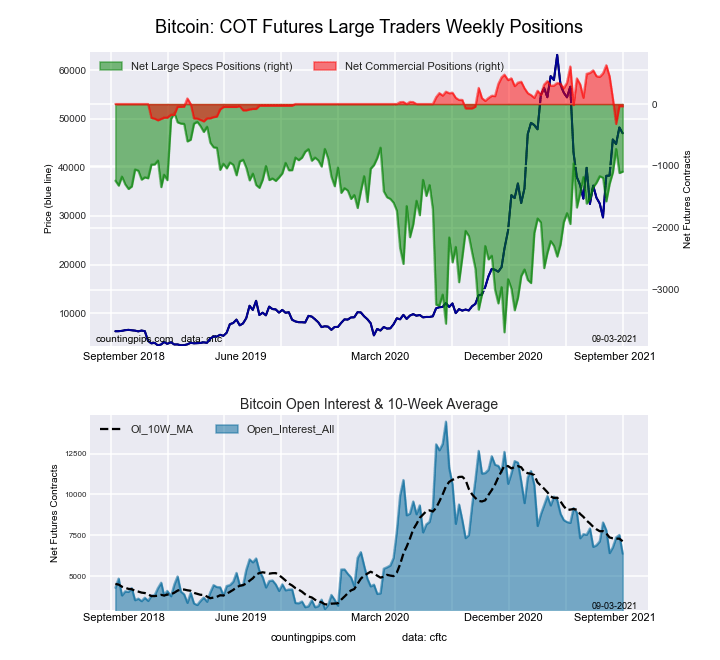 The Bitcoin large speculator standing this week totaled a net position of -1,092 contracts in the data reported through Tuesday. This was a weekly advance of 22 contracts from the previous week which had a total of -1,114 net contracts.
This week’s current strength score (the trader positioning range over the past three years, measured from 0 to 100) shows the speculators are currently Bullish with a score of 73.2 percent. The commercials are Bearish with a score of 29.9 percent and the small traders (not shown in chart) are Bearish with a score of 26.8 percent.
| BITCOIN Statistics | SPECULATORS | COMMERCIALS | SMALL TRADERS |
| – Percent of Open Interest Longs: | 63.9 | 5.6 | 27.0 |
| – Percent of Open Interest Shorts: | 81.1 | 6.2 | 9.3 |
| – Net Position: | -1,092 | -37 | 1,129 |
| – Gross Longs: | 4,066 | 358 | 1,720 |
| – Gross Shorts: | 5,158 | 395 | 591 |
| – Long to Short Ratio: | 0.8 to 1 | 0.9 to 1 | 2.9 to 1 |
| NET POSITION TREND: | |||
| – COT Index Score (3 Year Range Pct): | 73.2 | 29.9 | 26.8 |
| – COT Index Reading (3 Year Range): | Bullish | Bearish | Bearish |
| NET POSITION MOVEMENT INDEX: | |||
| – 6-Week Change in Strength Index: | 2.8 | -56.2 | 14.3 |
Article By CountingPips.com – Receive our weekly COT Reports by Email
*COT Report: The COT data, released weekly to the public each Friday, is updated through the most recent Tuesday (data is 3 days old) and shows a quick view of how large speculators or non-commercials (for-profit traders) were positioned in the futures markets.
The CFTC categorizes trader positions according to commercial hedgers (traders who use futures contracts for hedging as part of the business), non-commercials (large traders who speculate to realize trading profits) and nonreportable traders (usually small traders/speculators).
Find CFTC criteria here: (http://www.cftc.gov/MarketReports/CommitmentsofTraders/ExplanatoryNotes/index.htm).

- Trump announces exemption of key tech goods from imposed tariffs Apr 14, 2025
- COT Metals Charts: Speculator Bets led lower by Gold, Platinum & Silver Apr 13, 2025
- COT Bonds Charts: Speculator Bets led by SOFR-3M, Fed Funds & Ultra Treasury Bonds Apr 13, 2025
- COT Soft Commodities Charts: Speculator Bets led by Soybean Oil & Wheat Apr 13, 2025
- COT Stock Market Charts: Speculator Bets led higher by Nasdaq, Russell & DowJones Apr 13, 2025
- The US stocks are back to selling off. The US raised tariffs on China to 145% Apr 11, 2025
- EUR/USD Hits Three-Year High as the US Dollar Suffers Heavy Losses Apr 11, 2025
- Markets rallied sharply on the back of a 90-day tariff postponement. China became an exception with tariffs of 125% Apr 10, 2025
- Pound Rallies Sharply Weak Dollar Boosts GBP, but BoE Rate Outlook May Complicate Future Gains Apr 10, 2025
- Tariffs on US imports come into effect today. The RBNZ expectedly lowered the rate by 0.25% Apr 9, 2025
