
By Ino.com
This week we have a stock market forecast for the week of 8/295/21 from our friend Bo Yoder of the Market Forecasting Academy. Be sure to leave a comment and let us know what you think!
The S&P 500 (SPY)
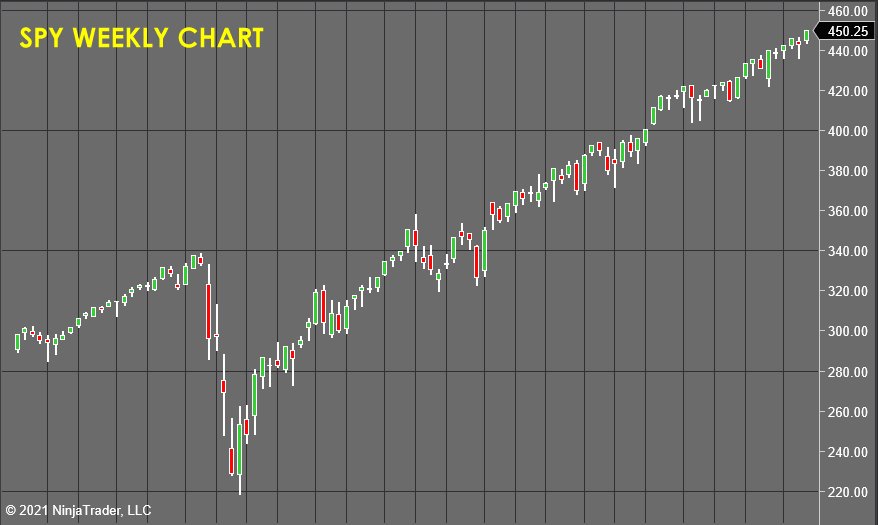
Another week has gone by, and another week of drifting from the markets as we work our way through the August doldrums.
The market keeps drifting higher, and I’ve been enjoying the summer and keeping my powder dry as I wait for a catalyst to break us out of this inflation-driven drift.
With a heavy heart, I see what I think is that catalyst in the form of a Category 4 hurricane, which is currently pummeling the state of Louisiana as it makes landfall with 140MPH+ winds.
Free Reports:
 Download Our Metatrader 4 Indicators – Put Our Free MetaTrader 4 Custom Indicators on your charts when you join our Weekly Newsletter
 Get our Weekly Commitment of Traders Reports - See where the biggest traders (Hedge Funds and Commercial Hedgers) are positioned in the futures markets on a weekly basis.
I put off publishing this forecast as long as I could in order to find out how bad things were likely to be before I could make as accurate a forecast as possible for all of you…
At this moment, it looks like there will be a lot of devastating damage to people and property, and that will likely provoke a knee-jerk emotional reaction in the market indexes on Monday.
Imagine that you are a long-term investor who is amazed at how well your funds are up this year, and then you see the awful images that will saturate the news for weeks.
Are you likely to buy more?
Or go YIKES and take profits off the table?
Under normal circumstances, I would expect the markets to gap down hard on Monday, and the odds are high that the gap open would price itself BELOW the lows of the big green day printed on Friday ($446), which would trigger a nasty bull trap.
However, I have to hedge because of the clown world we currently live in. I also see a scenario where the policy forecasters see the disaster unfolding in Louisiana as a trigger event for even MORE STIMULUS and money printing.
So keep an eye on the political news for any big announcement about relief, and we will see next week what transpires.
For now, I am happy with the exposure I have open on a weekly level and will be focused on intraday trading on the short side next week as the storm news causes the markets to be volatile.
SPDR Gold Shares (GLD)
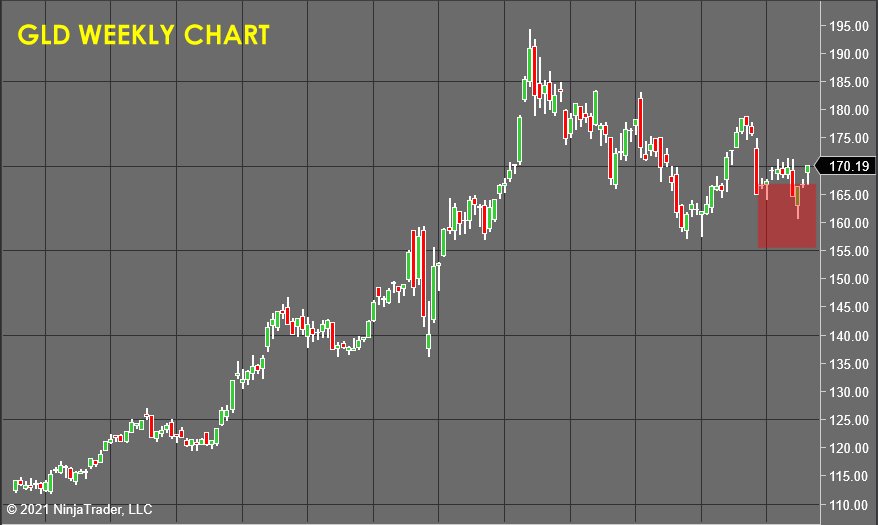
Gold had a superb week, and this accumulation is likely to begin accelerating as it breaks above the minor highs around $171.50. We might see a big week if the instability of the Afghanistan collapse and damage caused by Hurricane Ida spook investors. They run to hide in the perceived safety of the precious metals markets.
The PNC Financial Services Group, Inc. (PNC)
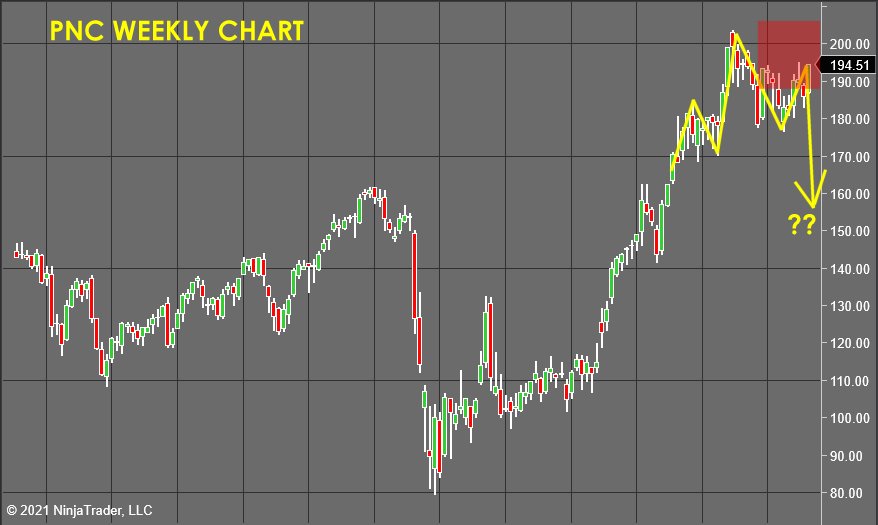
PNC is wiggling back up to “rinse out” the daily highs. This back and forth waffling isn’t relevant to us since this forecast is based on the weekly chart, but it creates a nice “teachable moment” as we wait…
Notice the price pattern I drew out in yellow on the weekly chart of PNC…
This is a classic technical analysis pattern known as a “head and shoulders,” It predicts that this market is reversing.
Now, the markets are ALWAYS cycling, and these cycles behave very much the same way no matter what asset class or timeframe you are looking at.
To see what I expect PNC to do over the next couple of months, let’s look at another chart I traded this week.
This Week’s Lesson: The Markets Are NOT RANDOM (And They Are FRACTAL)!
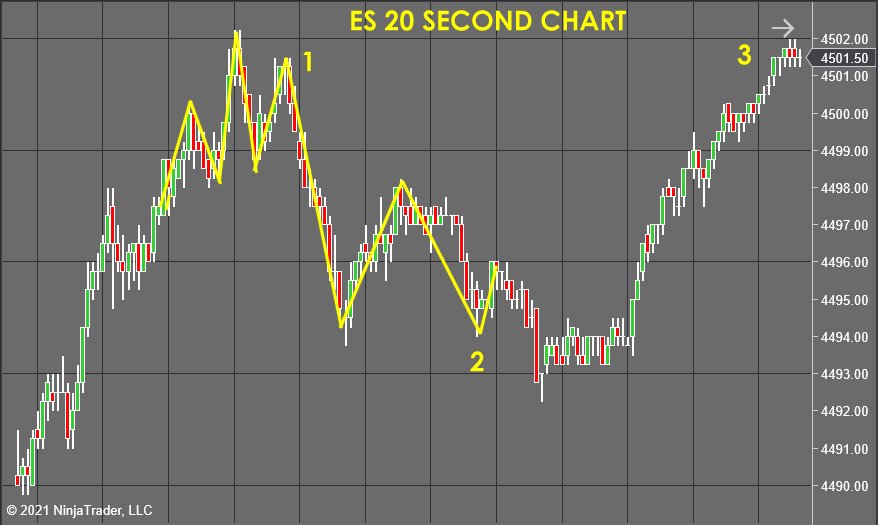
Take a minute to scroll back up and contrast the price pattern shown here with the one currently unfolding in PNC.
They look really similar… right?
Well, what’s interesting is that PNC is a weekly chart, and the chart above is a 20 SECOND chart of the S&P 500 futures.
Yet the price action is the same…
Just that the cycles I’m forecasting and exploiting on a 20-sec chart take less than an hour to complete vs. months for a weekly trade.
I identified the same head and shoulders pattern as PNC in the “ES” (1) in this trade. That gave me the exact same trade plan, with stops set up above the highs of the pattern.
This trade worked out nicely, offering a quick drop out of the patterns trigger…
Then it formed another pattern…
This is a “double bottom” (2) and is a bullish reversal signal, so profits were taken, and the trade was closed out.
This second pattern DID indeed reverse the market, and price rallied all the way back up to the original entry price (3).
Three powerful lessons here for you to ponder…
- 1. You can take EVERYTHING you learn here and use it in any timeframe you choose to spend time analyzing.
- 2. You can’t get emotionally involved in a move because they will reverse at some point and give back all the gains you USED to have more often than not!
- 3. The money velocity for an intraday trader is staggeringly high. I can find 2-10 trades in any given week in these small timeframes. At the same time, basically, nothing has happened in all the open weekly trades.
The goal of these columns is to open your eyes and give you a new perspective on how predictable and forecastable the markets truly are…
If you have the right “Lens” to look through. That’s what the methodology we teach at Market Forecasting Academy delivers. It measures the pressures in the markets on a bar by bar basis, just like the storm forecasters are using all the atmospheric pressure readings to forecast the hurricane’s path.
If you would like to see this forecasting process happen a lot faster, we have a number of videos with recordings of us forecasting the markets in real-time you might enjoy seeing. Click on the link below to visit the site and see from the 5 days worth of videos what is truly possible in the world of market forecasting.
To Learn How To Accurately and Consistently Forecast Market Prices Just Like Me, Using Market Vulnerability Analysis™, visit Market Forecasting Academy for the Free 5 Day Market Forecasting Primer.
Check back to see my next post!
Bo Yoder
Market Forecasting Academy
About Bo Yoder:
Beginning his full-time trading career in 1997, Bo is a professional trader, partner at Market Forecasting Academy, developer of The Myalolipsis Technique, two-time author, and consultant to the financial industry on matters of market analysis and edge optimization.
Bo has been a featured speaker internationally for decades and has developed a reputation for trading live in front of an audience as a real-time example of what it is like to trade for a living.
In addition to his two books for McGraw-Hill, Mastering Futures Trading and Optimize Your Trading Edge (translated into German and Japanese), Bo has written articles published in top publications such as TheStreet.com, Technical Analysis of Stocks & Commodities, Trader’s, Active Trader Magazine and Forbes to name a few.
Bo currently spends his time with his wife and son in the great state of Maine, where he trades, researches behavioral economics & neuropsychology, and is an enthusiastic sailboat racer.
He has an MBA from The Boston University School of Management.
Disclosure: This article is the opinion of the contributor themselves. The above is a matter of opinion provided for general information purposes only and is not intended as investment advice. This contributor is not receiving compensation for their opinion.
By Ino.com – See our Trader Blog, INO TV Free & Market Analysis Alerts
Source: Weekly Stock Market Forecast

- COT Metals Charts: Weekly Speculator Bets led by Copper & Steel Jul 18, 2026
- COT Bonds Charts: Weekly Speculator Bets led by 2-Year, SOFR 3M & 5-Year Bonds Jul 18, 2026
- COT Energy Charts: Weekly Speculator Bets led by Brent Oil & Heating Oil Jul 18, 2026
- COT Soft Commodities Charts: Weekly Speculator Bets led by Wheat, Corn & Soybean Meal Jul 18, 2026
- The Bank of Canada kept its interest rate unchanged. Platinum prices reached a three‑week high Jul 16, 2026
- Stock indices rose after the release of US inflation data. China’s GDP slowed sharply Jul 15, 2026
- GBP/USD Awaits Political News: What Will Happen Next Jul 15, 2026
- USD/JPY Holds at Highs: Pressure Lingers on Yen Jul 14, 2026
- Oil prices jumped 4% amid a new wave of escalation between the US and Iran Jul 13, 2026
- EUR/USD: US Inflation Will Determine Everything Jul 13, 2026