
Article By RoboForex.com
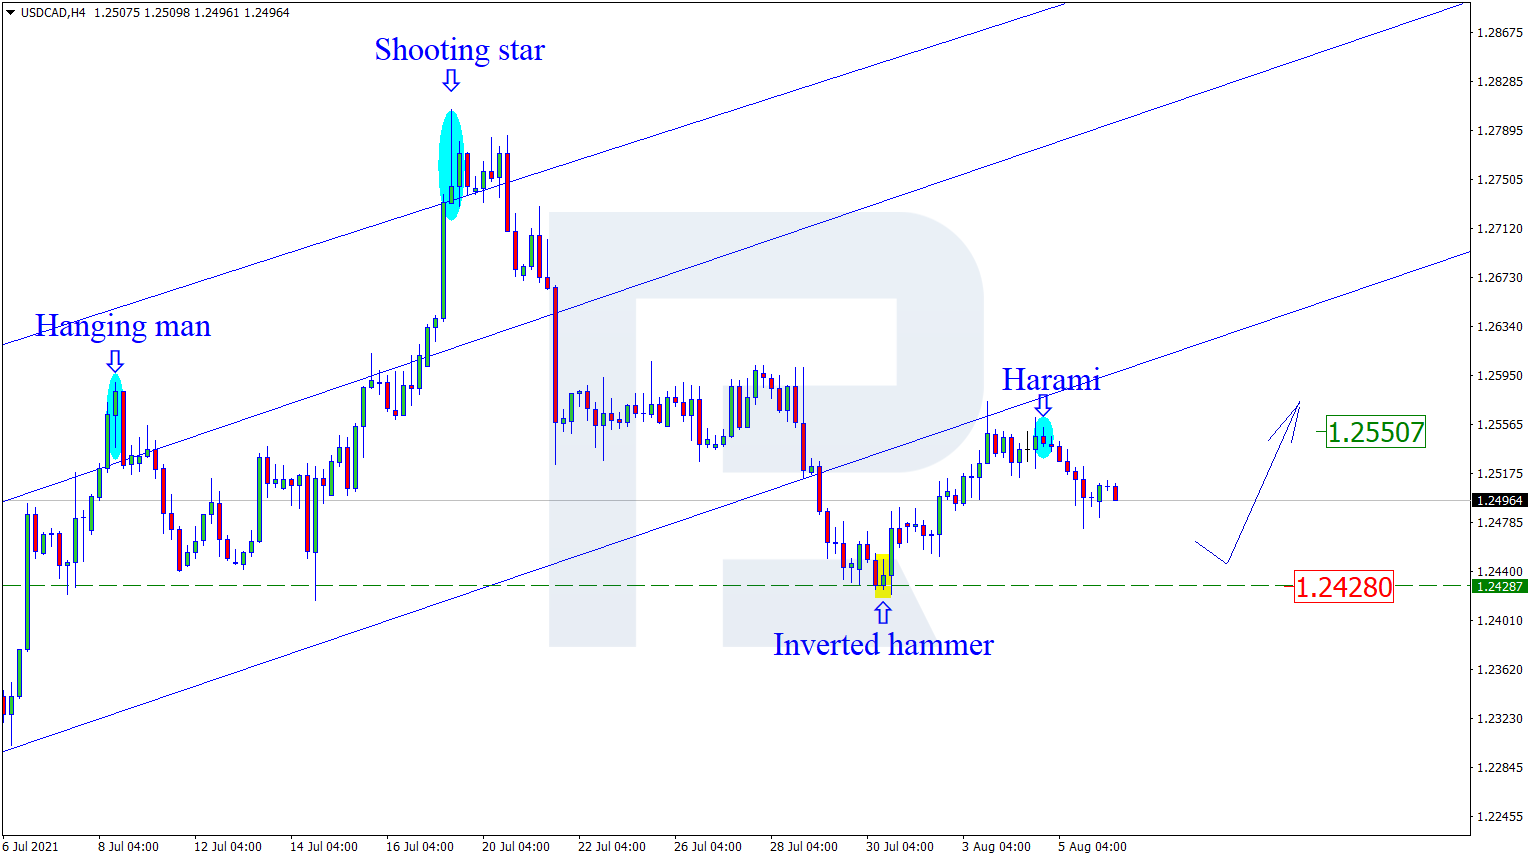
USDCAD, “US Dollar vs Canadian Dollar”
USDCAD keeps correcting. At the resistance level, it has formed several reversal patterns, including a Harami. Going by the reversal signal, the pair might go on pulling back with the aim of the support level at 1.2428. However, the quotations might still grow to 1.2550 without testing the support level.

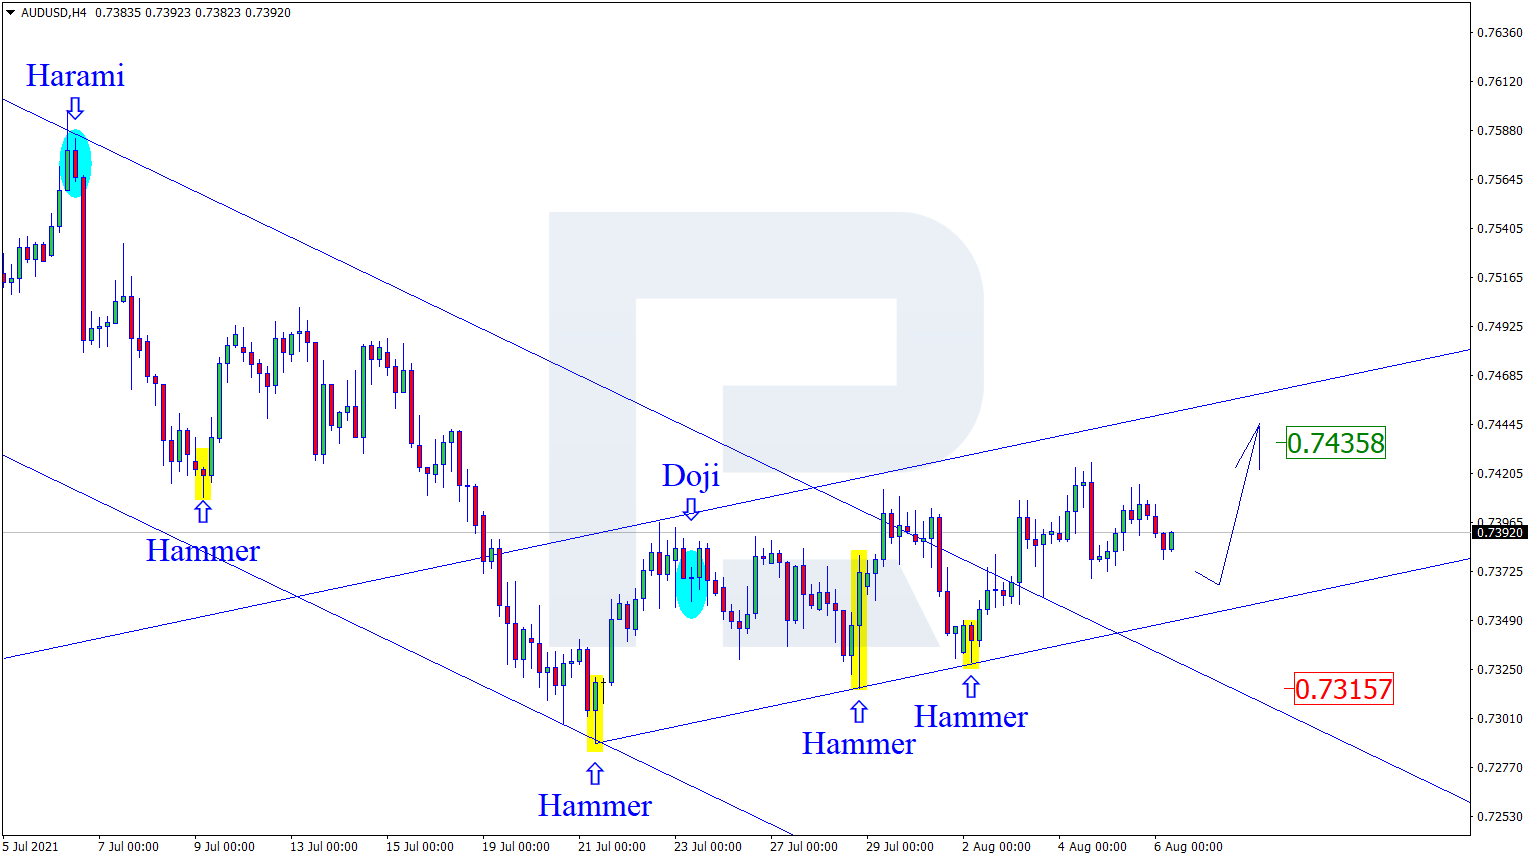
AUDUSD, “Australian Dollar vs US Dollar”
On H4, at the support level, the pair has formed several reversal patterns, including a Hammer. Currently, going by the reversal signal, the pair might continue growing to the resistance level with the aim remaining at 0.7435. However, the pair might decline to 0.7315 and continue the downtrend without testing the resistance level.
Free Reports:
 Sign Up for Our Stock Market Newsletter – Get updated on News, Charts & Rankings of Public Companies when you join our Stocks Newsletter
 Get our Weekly Commitment of Traders Reports - See where the biggest traders (Hedge Funds and Commercial Hedgers) are positioned in the futures markets on a weekly basis.
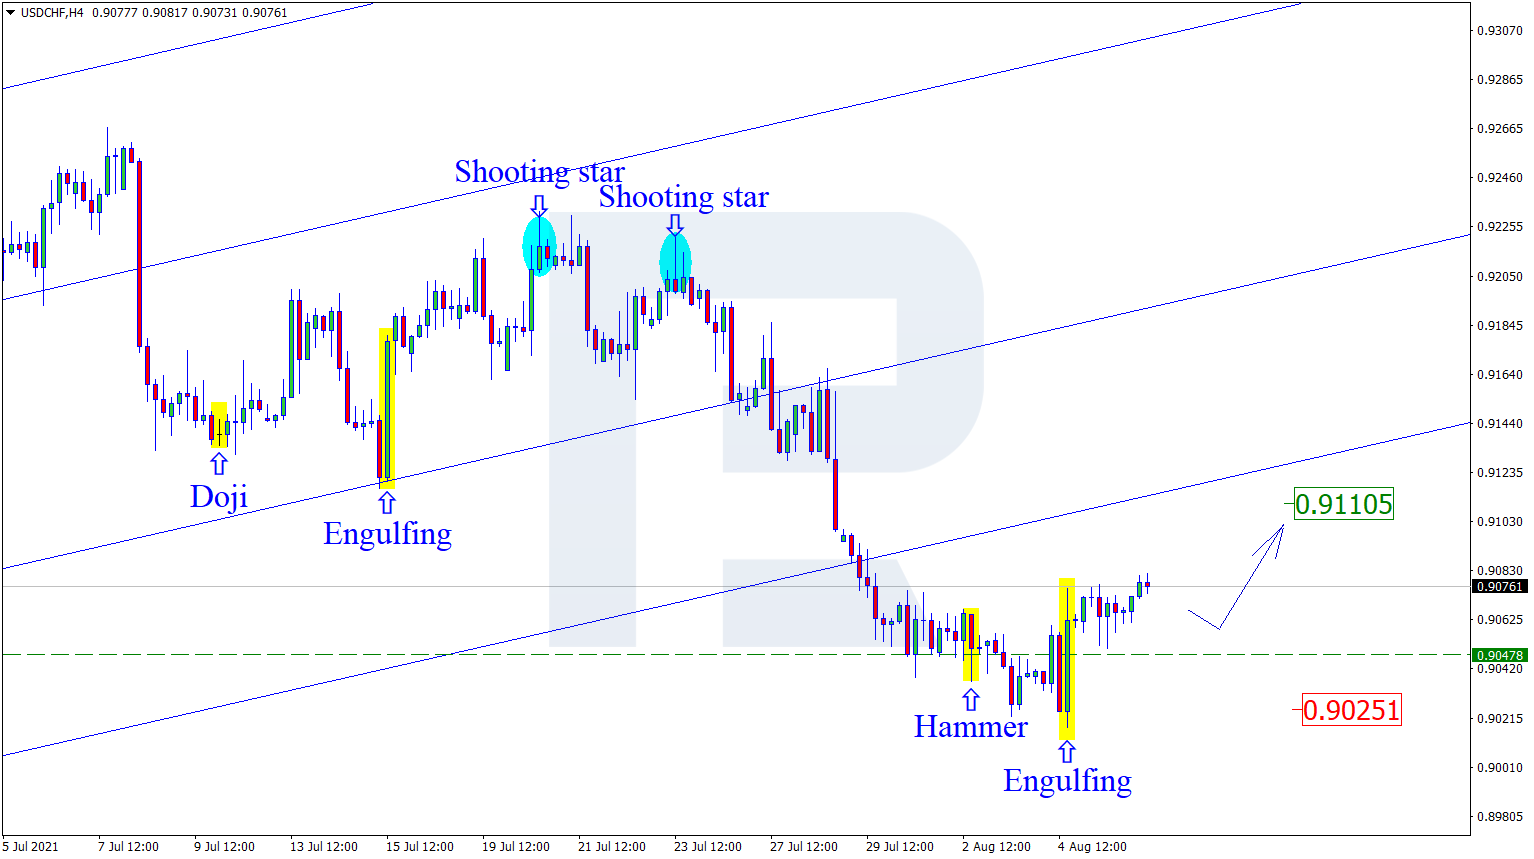
USDCHF, “US Dollar vs Swiss Franc”
On H4, the pair keeps correcting. Near the support level, the pair has formed several reversal patterns including a Hammer and a ln Engulfing. Currently, going by the signal, the pair might end up at the resistance level with the aim at 0.9110. However, the quotations might just fall to 0.9025 without testing the resistance level.
Article By RoboForex.com
Attention!
Forecasts presented in this section only reflect the author’s private opinion and should not be considered as guidance for trading. RoboForex LP bears no responsibility for trading results based on trading recommendations described in these analytical reviews.

- The Bank of Canada kept its interest rate unchanged. Platinum prices reached a three‑week high Jul 16, 2026
- Stock indices rose after the release of US inflation data. China’s GDP slowed sharply Jul 15, 2026
- GBP/USD Awaits Political News: What Will Happen Next Jul 15, 2026
- USD/JPY Holds at Highs: Pressure Lingers on Yen Jul 14, 2026
- Oil prices jumped 4% amid a new wave of escalation between the US and Iran Jul 13, 2026
- EUR/USD: US Inflation Will Determine Everything Jul 13, 2026
- COT Metals Charts: Weekly Speculator Bets see small gains for Silver & Gold Jul 12, 2026
- COT Bonds Charts: Speculator Bets led by SOFR 3-Months & 2-Year Bonds Jul 12, 2026
- COT Energy Charts: Weekly Speculator Changes led by Brent Oil Jul 12, 2026
- COT Soft Commodities Charts: Weekly Speculator Changes led by Sugar, Corn & Soybeans Jul 12, 2026