
By Orbex
USDCHF breaks support
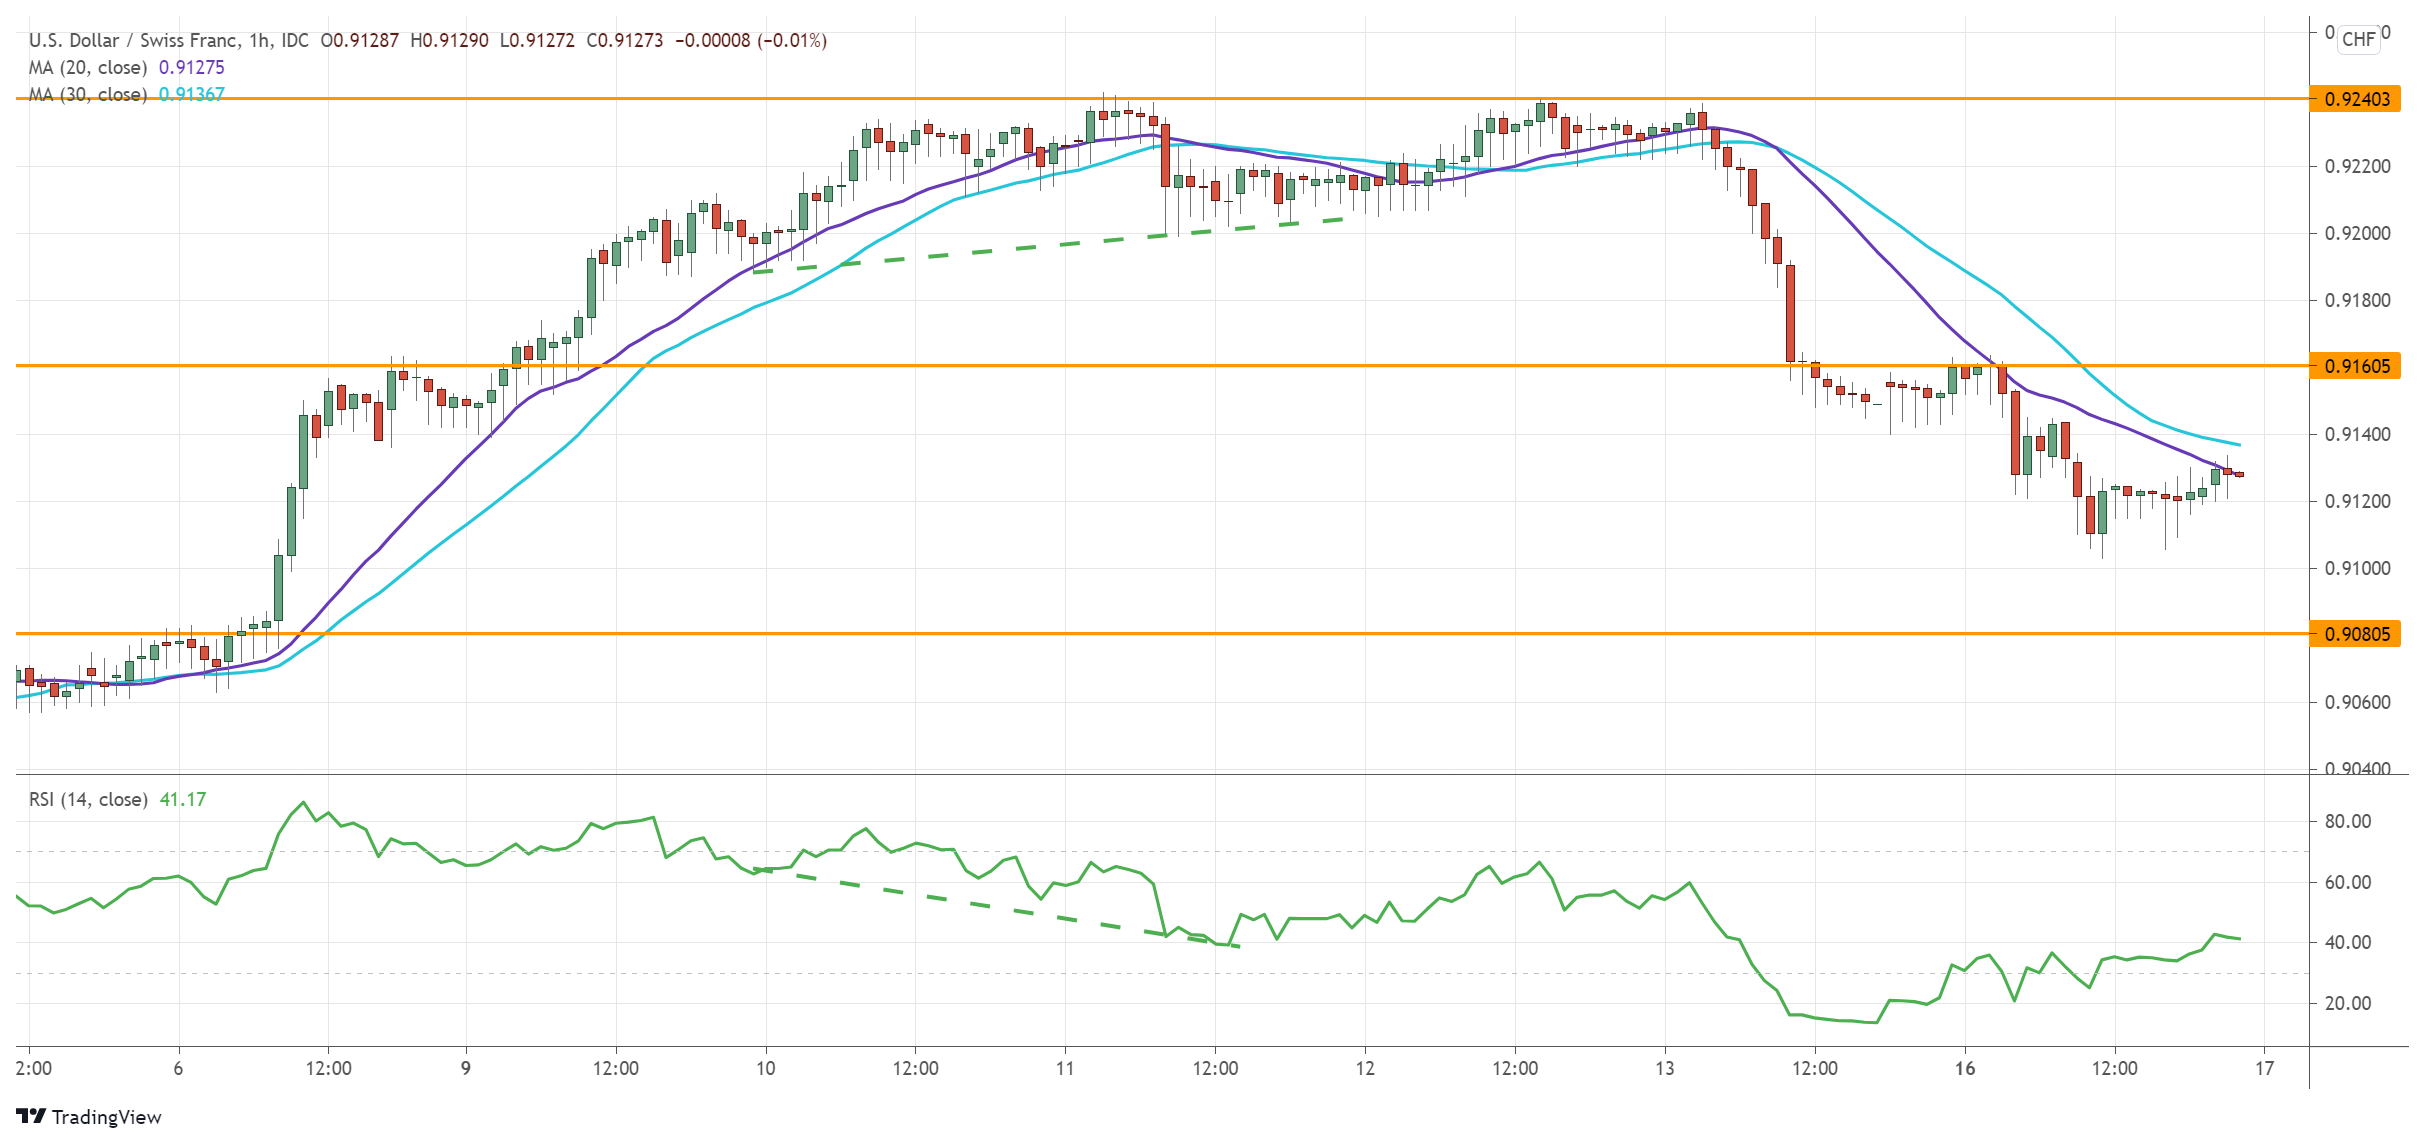
The US dollar tumbles as traders take profit ahead of Wednesday’s FOMC minutes.
The break above the daily resistance at 0.9230 has led to an overextension. The RSI divergence at the supply area near 0.9260 was a warning that a retracement could be in the making.
The confirmation came in in the form of a fall below 0.9190. The sell-off has then gained momentum after 0.9140 failed to secure bids.
0.9160 is now a fresh resistance. The base of the previous breakout at 0.9080 would be the next target.
Free Reports:
 Get our Weekly Commitment of Traders Reports - See where the biggest traders (Hedge Funds and Commercial Hedgers) are positioned in the futures markets on a weekly basis.
 Sign Up for Our Stock Market Newsletter – Get updated on News, Charts & Rankings of Public Companies when you join our Stocks Newsletter
USDNOK awaits breakout
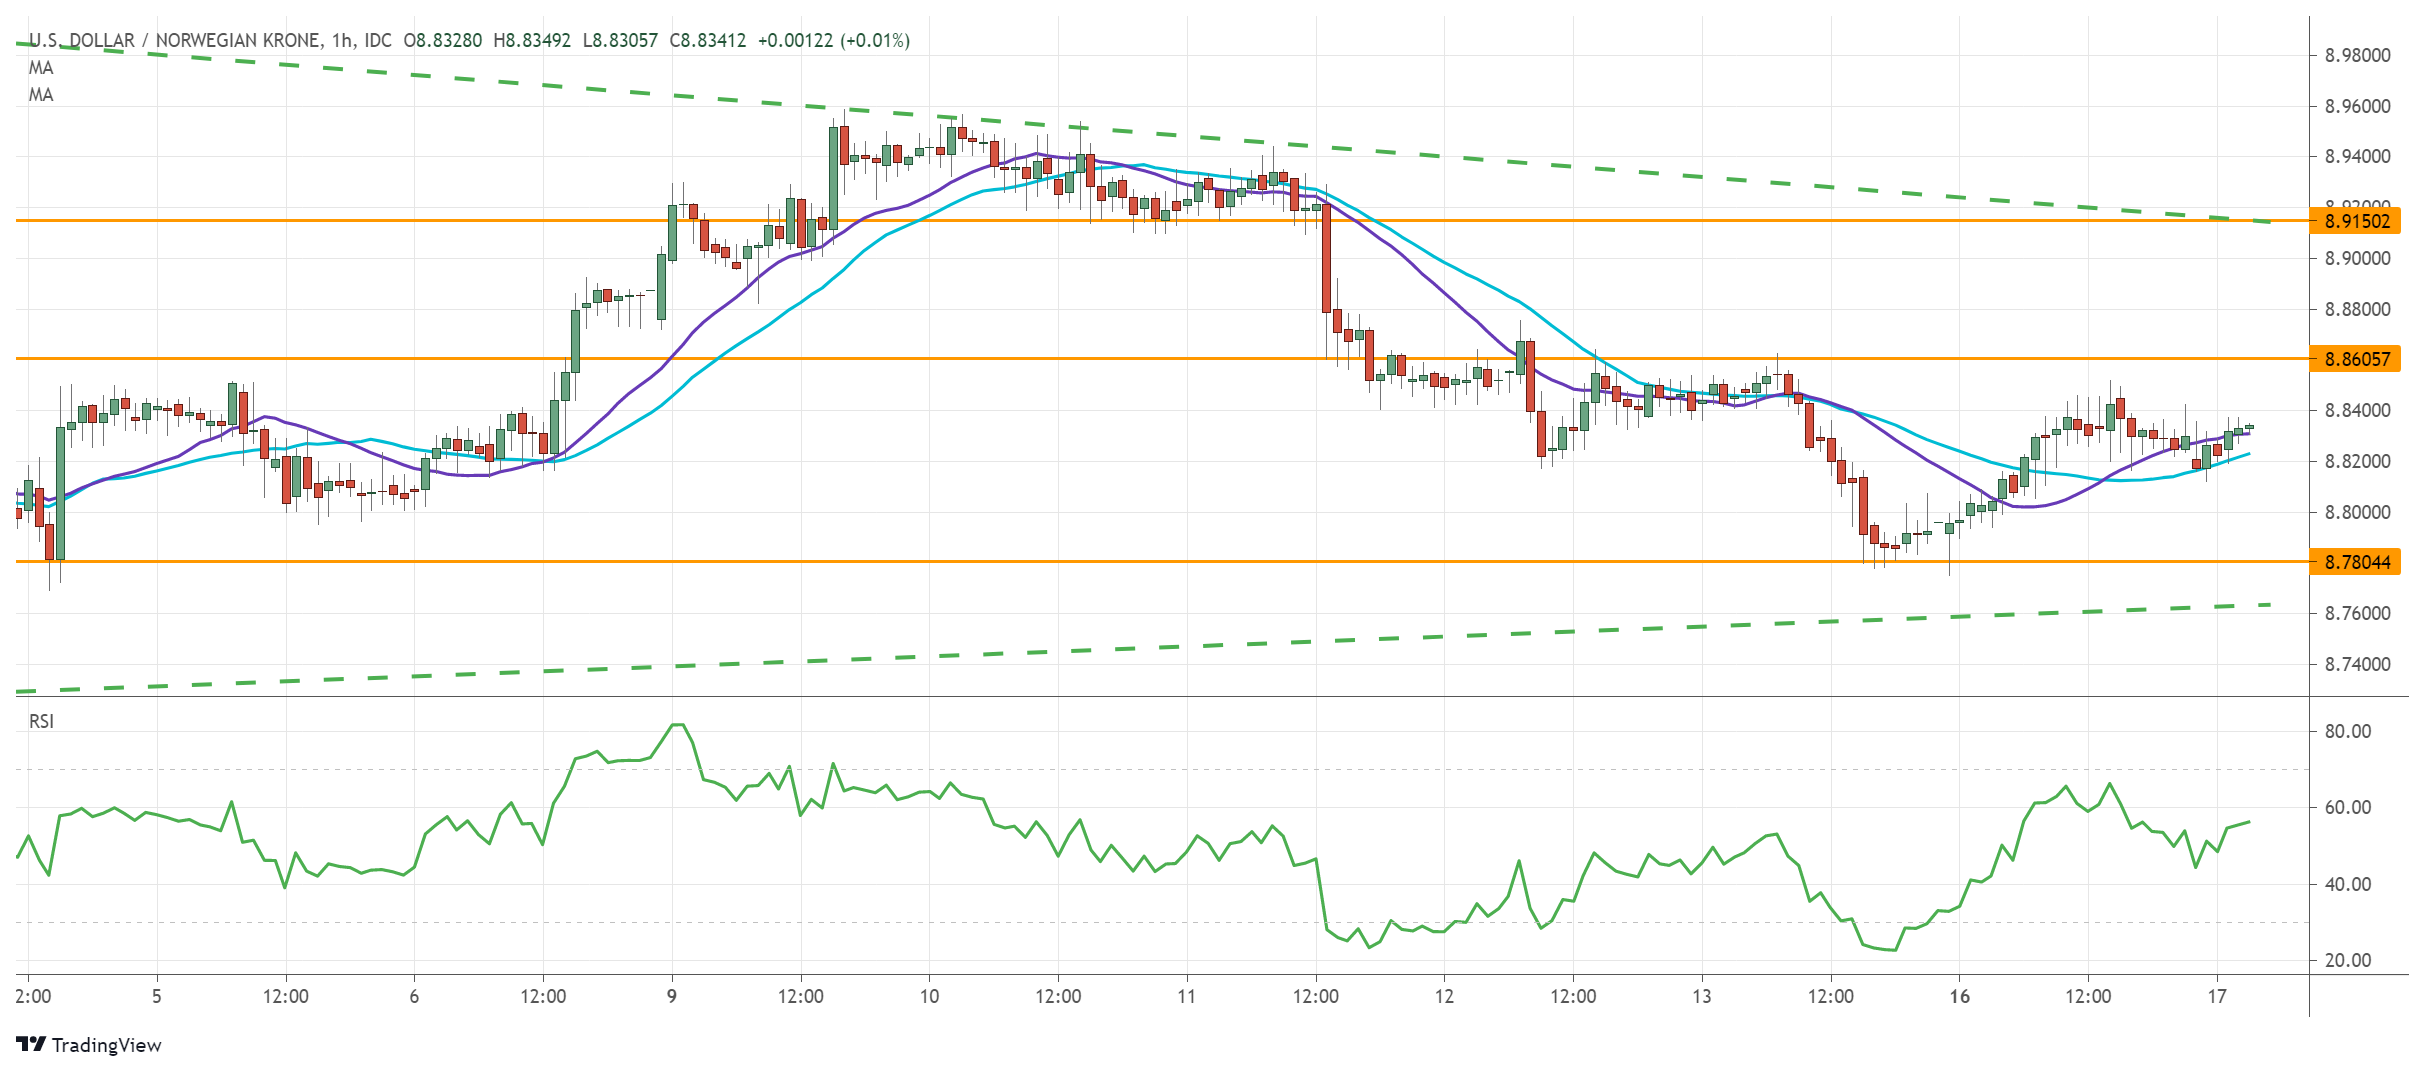
The Norwegian krone weakens as oil prices struggle amid demand uncertainty.
The pair is in a pennant consolidation on the daily chart following a rally above last December’s high at 8.9000. The narrowing range is a sign of hesitation and a breakout would dictate the direction for the days to come.
8.7800 near the 30-day moving average is the closest support. A close above 8.8600 may challenge the key resistance at 8.9150, and a bullish breakout would confirm the uptrend’s continuation.
UK100 bounces off support
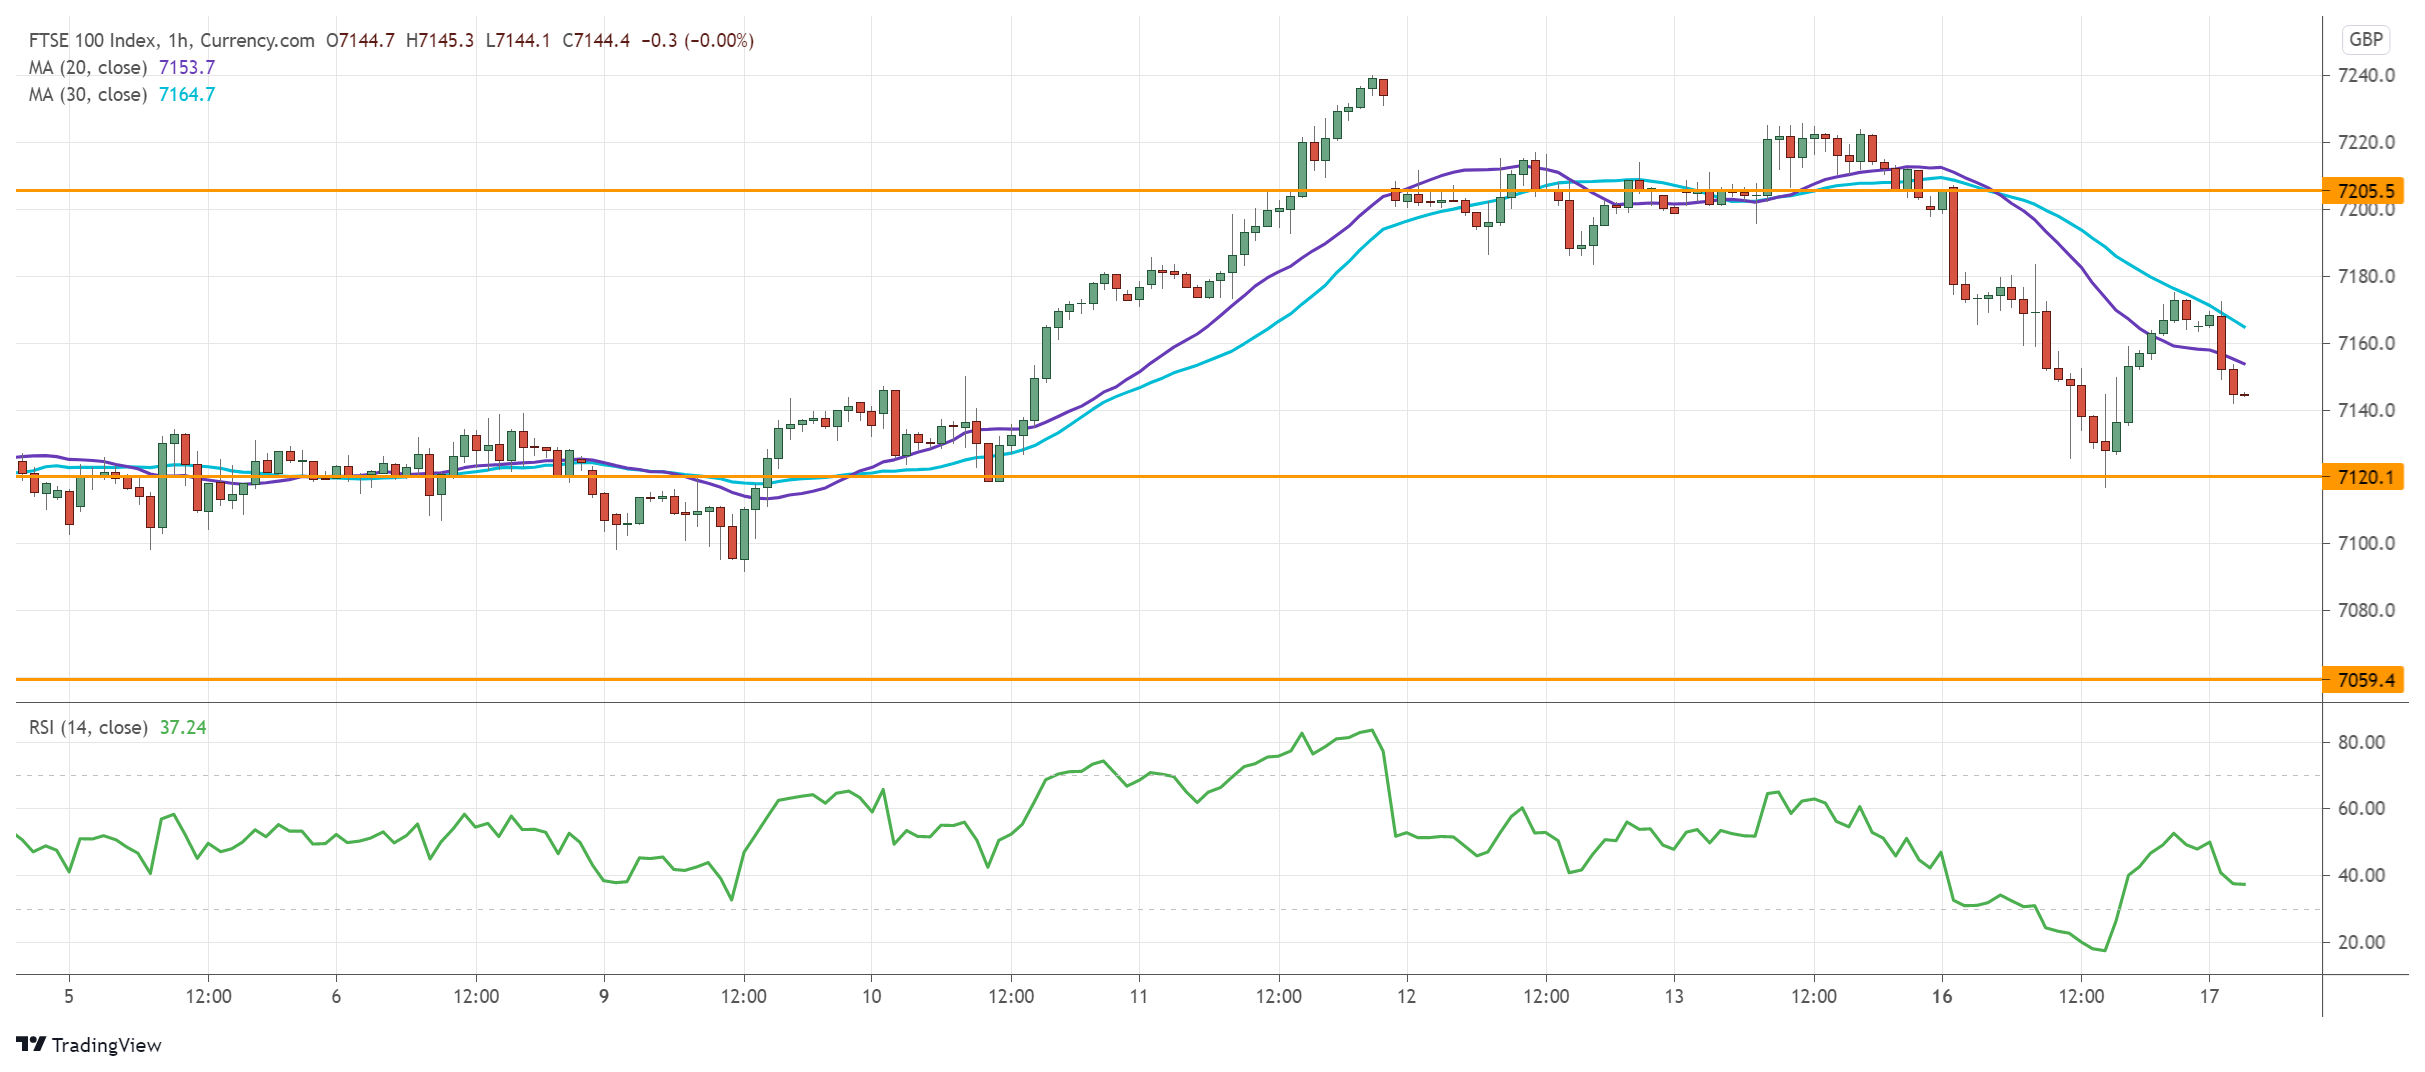
Commodity stocks dragged down the FTSE 100 index after weak economic data from China.
The rise above June’s peak at 7215 was a sign of commitment from the long side. However, a pullback is necessary to keep the rally sustainable.
The drop below 7175 suggests that buyers took profit when the RSI showed an overbought situation. As the RSI swings back into neutrality, between 7095 and 7120 lies the demand zone which coincides with the 20-day moving average.
A break above 7205 may resume the uptrend.
By Orbex

- Australian trade balance returned to positive territory Aug 6, 2026
- Results in Line for Most Reporting Companies Aug 5, 2026
- Stock indices continue to break records. Oil is falling amid intensified diplomatic dialogue between the US and Iran Aug 5, 2026
- USD/JPY Holds Steady After Intervention: Outlook Remains Uncertain Aug 5, 2026
- EUR/USD: Busy Week Ahead Aug 3, 2026
- Positive sentiment in the AI sector supported stock indices. Oil prices remain volatile Aug 3, 2026
- The Tech‑heavy NASDAQ Index jumped by more than 3.3%. The offshore yuan is trading at its highest level since 2023 Jul 31, 2026
- USD/JPY After Volatility: Multiple Events in One Day Jul 31, 2026
- The US indices sell off amid renewed US-Iran clashes. Oil jumps by 7% Jul 30, 2026
- USD/JPY Temporary in Equilibrium: Multiple Factors in Focus Jul 30, 2026
