
By CountingPips.com COT Home | Data Tables | Data Downloads | Newsletter
Here are the latest charts and statistics for the Commitment of Traders (COT) data published by the Commodities Futures Trading Commission (CFTC).
The latest COT data is updated through Tuesday August 10 2021 and shows a quick view of how large traders (for-profit speculators and commercial entities) were positioned in the futures markets. All currency positions are in direct relation to the US dollar where, for example, a bet for the euro is a bet that the euro will rise versus the dollar while a bet against the euro will be a bet that the euro will decline versus the dollar.
US Dollar Index Futures:
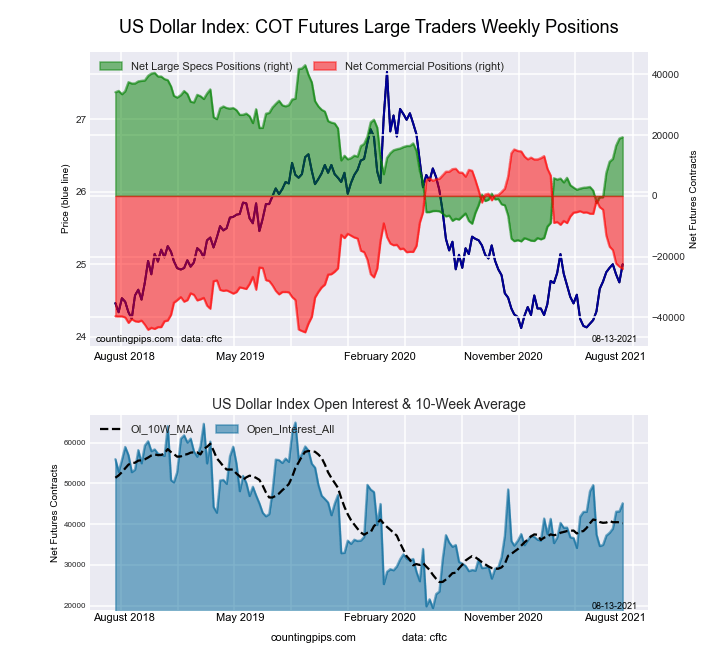
The US Dollar Index large speculator standing this week totaled a net position of 19,326 contracts in the data reported through Tuesday. This was a weekly lift of 445 contracts from the previous week which had a total of 18,881 net contracts.
This week’s current strength score (the trader positioning range over the past three years, measured from 0 to 100) shows the speculators are currently Bullish with a score of 59.1 percent. The commercials are Bearish with a score of 34.7 percent and the small traders (not shown in chart) are Bullish-Extreme with a score of 80.6 percent.
| US DOLLAR INDEX Statistics | SPECULATORS | COMMERCIALS | SMALL TRADERS |
| – Percent of Open Interest Longs: | 79.7 | 2.5 | 15.2 |
| – Percent of Open Interest Shorts: | 36.9 | 55.6 | 4.9 |
| – Net Position: | 19,326 | -23,998 | 4,672 |
| – Gross Longs: | 35,975 | 1,114 | 6,862 |
| – Gross Shorts: | 16,649 | 25,112 | 2,190 |
| – Long to Short Ratio: | 2.2 to 1 | 0.0 to 1 | 3.1 to 1 |
| NET POSITION TREND: | |||
| – COT Index Score (3 Year Range Pct): | 59.1 | 34.7 | 80.6 |
| – COT Index Reading (3 Year Range): | Bullish | Bearish | Bullish-Extreme |
| NET POSITION MOVEMENT INDEX: | |||
| – 6-Week Change in Strength Index: | 34.1 | -32.4 | -3.7 |
Free Reports:
 Sign Up for Our Stock Market Newsletter – Get updated on News, Charts & Rankings of Public Companies when you join our Stocks Newsletter
 Get our Weekly Commitment of Traders Reports - See where the biggest traders (Hedge Funds and Commercial Hedgers) are positioned in the futures markets on a weekly basis.
Euro Currency Futures:
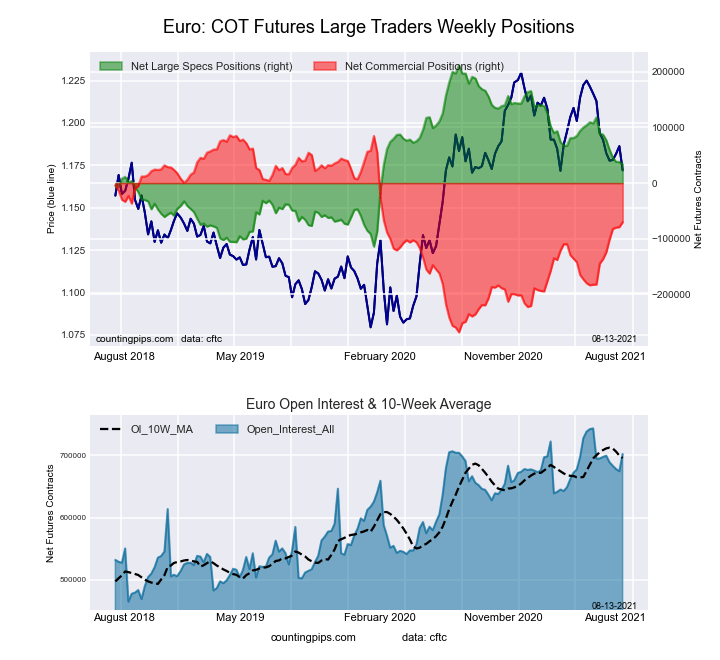 The Euro Currency large speculator standing this week totaled a net position of 33,857 contracts in the data reported through Tuesday. This was a weekly fall of -4,150 contracts from the previous week which had a total of 38,007 net contracts.
This week’s current strength score (the trader positioning range over the past three years, measured from 0 to 100) shows the speculators are currently Bearish with a score of 45.4 percent. The commercials are Bullish with a score of 55.9 percent and the small traders (not shown in chart) are Bearish with a score of 41.0 percent.
| EURO Currency Statistics | SPECULATORS | COMMERCIALS | SMALL TRADERS |
| – Percent of Open Interest Longs: | 30.3 | 55.4 | 13.2 |
| – Percent of Open Interest Shorts: | 25.5 | 65.4 | 8.0 |
| – Net Position: | 33,857 | -70,059 | 36,202 |
| – Gross Longs: | 212,809 | 388,866 | 92,351 |
| – Gross Shorts: | 178,952 | 458,925 | 56,149 |
| – Long to Short Ratio: | 1.2 to 1 | 0.8 to 1 | 1.6 to 1 |
| NET POSITION TREND: | |||
| – COT Index Score (3 Year Range Pct): | 45.4 | 55.9 | 41.0 |
| – COT Index Reading (3 Year Range): | Bearish | Bullish | Bearish |
| NET POSITION MOVEMENT INDEX: | |||
| – 6-Week Change in Strength Index: | -16.4 | 18.8 | -19.7 |
British Pound Sterling Futures:
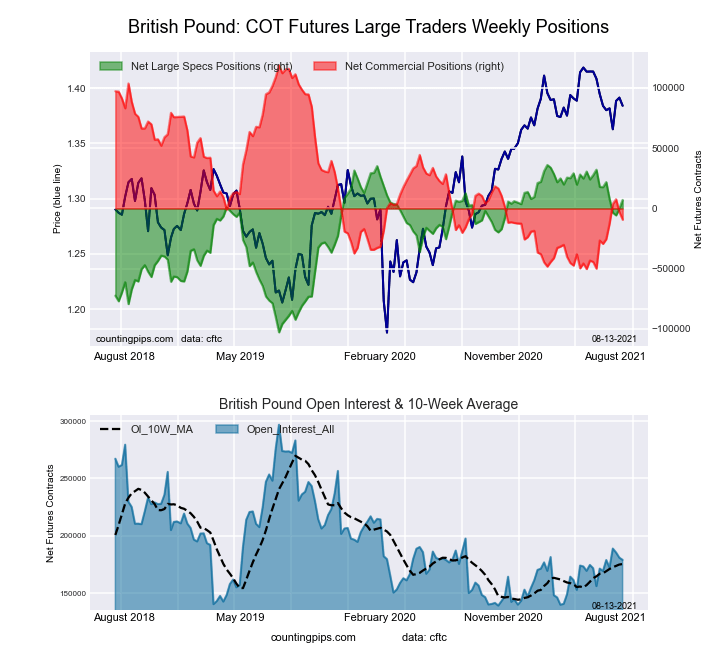 The British Pound Sterling large speculator standing this week totaled a net position of 7,070 contracts in the data reported through Tuesday. This was a weekly rise of 7,156 contracts from the previous week which had a total of -86 net contracts.
This week’s current strength score (the trader positioning range over the past three years, measured from 0 to 100) shows the speculators are currently Bullish with a score of 79.1 percent. The commercials are Bearish with a score of 24.2 percent and the small traders (not shown in chart) are Bullish with a score of 60.2 percent.
| BRITISH POUND Statistics | SPECULATORS | COMMERCIALS | SMALL TRADERS |
| – Percent of Open Interest Longs: | 25.0 | 56.9 | 16.7 |
| – Percent of Open Interest Shorts: | 21.1 | 62.1 | 15.5 |
| – Net Position: | 7,070 | -9,263 | 2,193 |
| – Gross Longs: | 44,750 | 101,835 | 29,887 |
| – Gross Shorts: | 37,680 | 111,098 | 27,694 |
| – Long to Short Ratio: | 1.2 to 1 | 0.9 to 1 | 1.1 to 1 |
| NET POSITION TREND: | |||
| – COT Index Score (3 Year Range Pct): | 79.1 | 24.2 | 60.2 |
| – COT Index Reading (3 Year Range): | Bullish | Bearish | Bullish |
| NET POSITION MOVEMENT INDEX: | |||
| – 6-Week Change in Strength Index: | -7.7 | 11.9 | -19.5 |
Japanese Yen Futures:
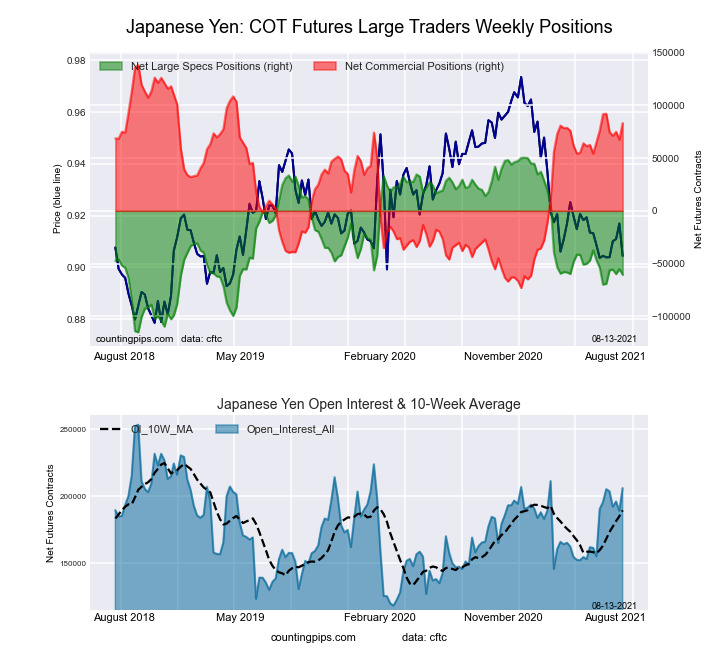 The Japanese Yen large speculator standing this week totaled a net position of -60,657 contracts in the data reported through Tuesday. This was a weekly fall of -5,467 contracts from the previous week which had a total of -55,190 net contracts.
This week’s current strength score (the trader positioning range over the past three years, measured from 0 to 100) shows the speculators are currently Bearish with a score of 32.9 percent. The commercials are Bullish with a score of 74.0 percent and the small traders (not shown in chart) are Bearish-Extreme with a score of 13.0 percent.
| JAPANESE YEN Statistics | SPECULATORS | COMMERCIALS | SMALL TRADERS |
| – Percent of Open Interest Longs: | 17.8 | 73.6 | 8.4 |
| – Percent of Open Interest Shorts: | 47.2 | 33.2 | 19.3 |
| – Net Position: | -60,657 | 83,261 | -22,604 |
| – Gross Longs: | 36,684 | 151,720 | 17,266 |
| – Gross Shorts: | 97,341 | 68,459 | 39,870 |
| – Long to Short Ratio: | 0.4 to 1 | 2.2 to 1 | 0.4 to 1 |
| NET POSITION TREND: | |||
| – COT Index Score (3 Year Range Pct): | 32.9 | 74.0 | 13.0 |
| – COT Index Reading (3 Year Range): | Bearish | Bullish | Bearish-Extreme |
| NET POSITION MOVEMENT INDEX: | |||
| – 6-Week Change in Strength Index: | 5.6 | -4.0 | -1.5 |
Swiss Franc Futures:
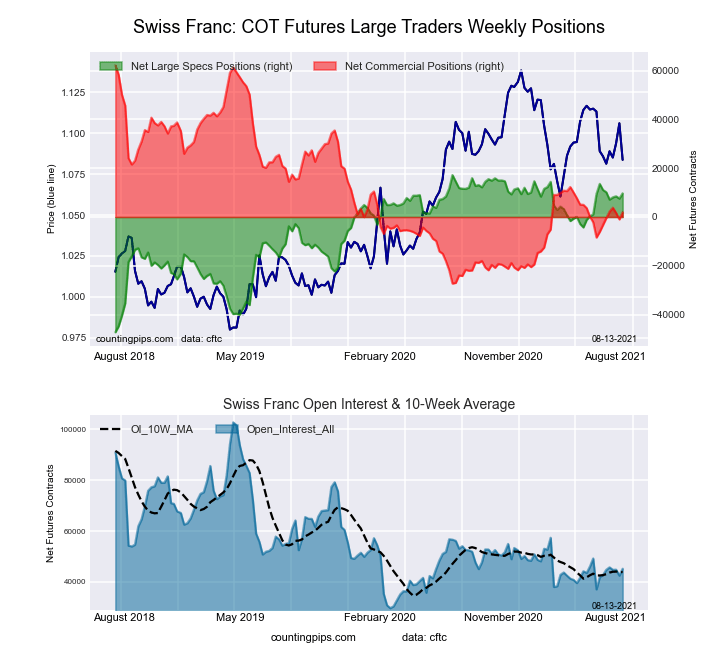 The Swiss Franc large speculator standing this week totaled a net position of 9,678 contracts in the data reported through Tuesday. This was a weekly lift of 2,135 contracts from the previous week which had a total of 7,543 net contracts.
This week’s current strength score (the trader positioning range over the past three years, measured from 0 to 100) shows the speculators are currently Bullish-Extreme with a score of 88.4 percent. The commercials are Bearish with a score of 32.6 percent and the small traders (not shown in chart) are Bearish with a score of 29.2 percent.
| SWISS FRANC Statistics | SPECULATORS | COMMERCIALS | SMALL TRADERS |
| – Percent of Open Interest Longs: | 41.0 | 37.8 | 20.1 |
| – Percent of Open Interest Shorts: | 19.6 | 33.6 | 45.8 |
| – Net Position: | 9,678 | 1,926 | -11,604 |
| – Gross Longs: | 18,537 | 17,089 | 9,092 |
| – Gross Shorts: | 8,859 | 15,163 | 20,696 |
| – Long to Short Ratio: | 2.1 to 1 | 1.1 to 1 | 0.4 to 1 |
| NET POSITION TREND: | |||
| – COT Index Score (3 Year Range Pct): | 88.4 | 32.6 | 29.2 |
| – COT Index Reading (3 Year Range): | Bullish-Extreme | Bearish | Bearish |
| NET POSITION MOVEMENT INDEX: | |||
| – 6-Week Change in Strength Index: | -2.2 | 5.8 | -11.1 |
Canadian Dollar Futures:
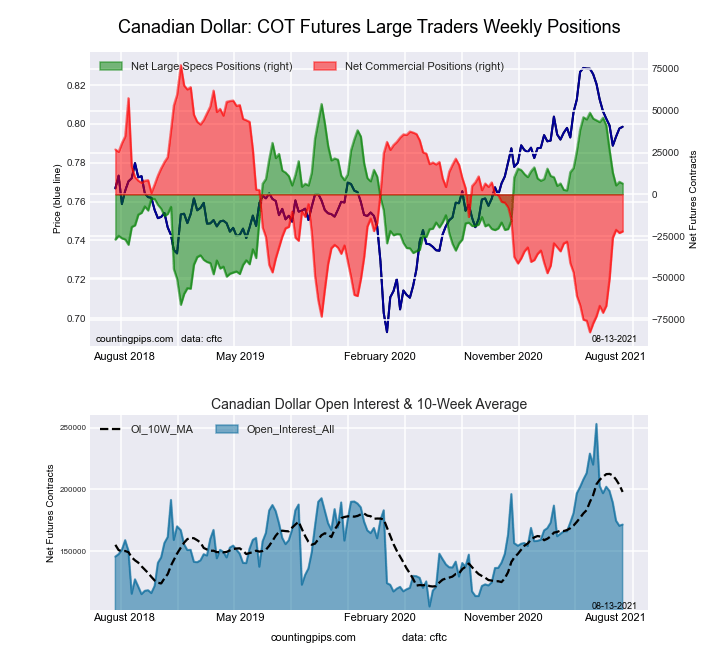 The Canadian Dollar large speculator standing this week totaled a net position of 6,465 contracts in the data reported through Tuesday. This was a weekly fall of -995 contracts from the previous week which had a total of 7,460 net contracts.
This week’s current strength score (the trader positioning range over the past three years, measured from 0 to 100) shows the speculators are currently Bullish with a score of 60.4 percent. The commercials are Bearish with a score of 37.8 percent and the small traders (not shown in chart) are Bullish with a score of 70.5 percent.
| CANADIAN DOLLAR Statistics | SPECULATORS | COMMERCIALS | SMALL TRADERS |
| – Percent of Open Interest Longs: | 26.5 | 50.0 | 22.2 |
| – Percent of Open Interest Shorts: | 22.7 | 62.9 | 13.0 |
| – Net Position: | 6,465 | -22,171 | 15,706 |
| – Gross Longs: | 45,445 | 85,808 | 38,066 |
| – Gross Shorts: | 38,980 | 107,979 | 22,360 |
| – Long to Short Ratio: | 1.2 to 1 | 0.8 to 1 | 1.7 to 1 |
| NET POSITION TREND: | |||
| – COT Index Score (3 Year Range Pct): | 60.4 | 37.8 | 70.5 |
| – COT Index Reading (3 Year Range): | Bullish | Bearish | Bullish |
| NET POSITION MOVEMENT INDEX: | |||
| – 6-Week Change in Strength Index: | -32.8 | 30.4 | -14.0 |
Australian Dollar Futures:
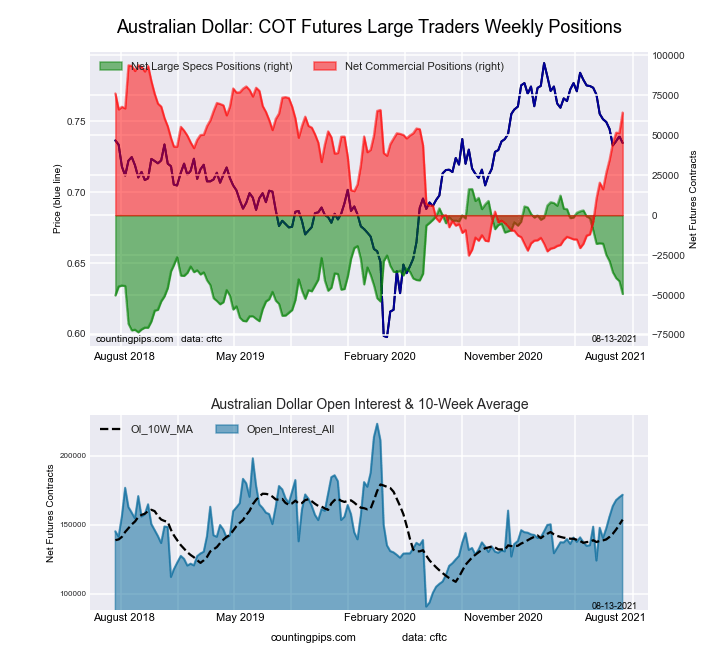 The Australian Dollar large speculator standing this week totaled a net position of -49,313 contracts in the data reported through Tuesday. This was a weekly decrease of -8,030 contracts from the previous week which had a total of -41,283 net contracts.
This week’s current strength score (the trader positioning range over the past three years, measured from 0 to 100) shows the speculators are currently Bearish with a score of 26.7 percent. The commercials are Bullish with a score of 75.1 percent and the small traders (not shown in chart) are Bearish with a score of 24.3 percent.
| AUSTRALIAN DOLLAR Statistics | SPECULATORS | COMMERCIALS | SMALL TRADERS |
| – Percent of Open Interest Longs: | 33.4 | 54.8 | 10.0 |
| – Percent of Open Interest Shorts: | 62.1 | 17.4 | 18.7 |
| – Net Position: | -49,313 | 64,248 | -14,935 |
| – Gross Longs: | 57,323 | 94,109 | 17,148 |
| – Gross Shorts: | 106,636 | 29,861 | 32,083 |
| – Long to Short Ratio: | 0.5 to 1 | 3.2 to 1 | 0.5 to 1 |
| NET POSITION TREND: | |||
| – COT Index Score (3 Year Range Pct): | 26.7 | 75.1 | 24.3 |
| – COT Index Reading (3 Year Range): | Bearish | Bullish | Bearish |
| NET POSITION MOVEMENT INDEX: | |||
| – 6-Week Change in Strength Index: | -35.2 | 40.3 | -36.2 |
New Zealand Dollar Futures:
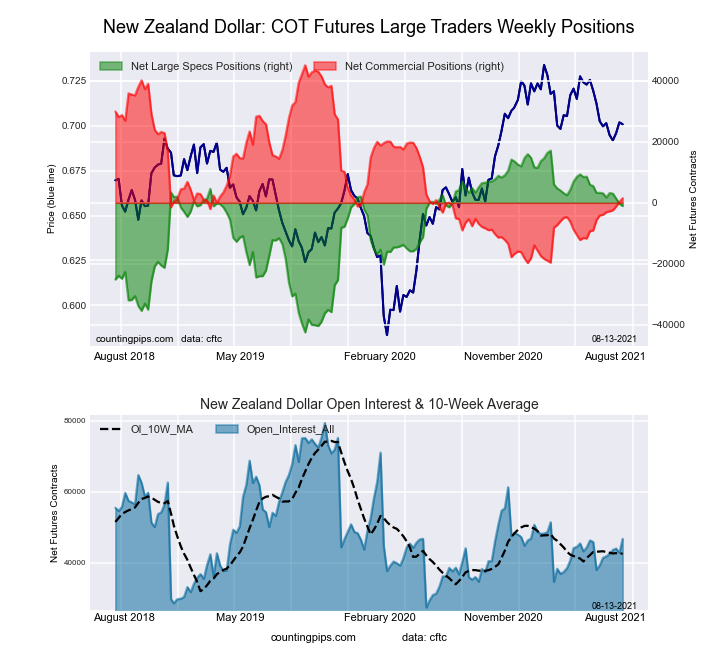 The New Zealand Dollar large speculator standing this week totaled a net position of -1,032 contracts in the data reported through Tuesday. This was a weekly fall of -707 contracts from the previous week which had a total of -325 net contracts.
This week’s current strength score (the trader positioning range over the past three years, measured from 0 to 100) shows the speculators are currently Bullish with a score of 69.5 percent. The commercials are Bearish with a score of 32.8 percent and the small traders (not shown in chart) are Bearish with a score of 47.8 percent.
| NEW ZEALAND DOLLAR Statistics | SPECULATORS | COMMERCIALS | SMALL TRADERS |
| – Percent of Open Interest Longs: | 37.0 | 46.0 | 8.1 |
| – Percent of Open Interest Shorts: | 39.3 | 42.7 | 9.2 |
| – Net Position: | -1,032 | 1,544 | -512 |
| – Gross Longs: | 17,295 | 21,486 | 3,769 |
| – Gross Shorts: | 18,327 | 19,942 | 4,281 |
| – Long to Short Ratio: | 0.9 to 1 | 1.1 to 1 | 0.9 to 1 |
| NET POSITION TREND: | |||
| – COT Index Score (3 Year Range Pct): | 69.5 | 32.8 | 47.8 |
| – COT Index Reading (3 Year Range): | Bullish | Bearish | Bearish |
| NET POSITION MOVEMENT INDEX: | |||
| – 6-Week Change in Strength Index: | -7.0 | 8.4 | -14.5 |
Mexican Peso Futures:
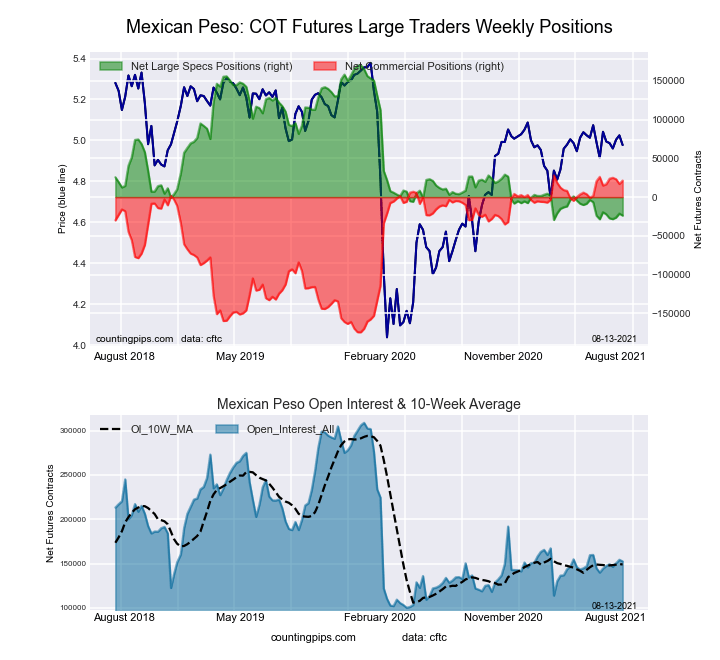 The Mexican Peso large speculator standing this week totaled a net position of -23,887 contracts in the data reported through Tuesday. This was a weekly fall of -2,590 contracts from the previous week which had a total of -21,297 net contracts.
This week’s current strength score (the trader positioning range over the past three years, measured from 0 to 100) shows the speculators are currently Bearish-Extreme with a score of 2.8 percent. The commercials are Bullish-Extreme with a score of 96.7 percent and the small traders (not shown in chart) are Bullish with a score of 54.0 percent.
| MEXICAN PESO Statistics | SPECULATORS | COMMERCIALS | SMALL TRADERS |
| – Percent of Open Interest Longs: | 45.8 | 49.1 | 4.1 |
| – Percent of Open Interest Shorts: | 61.4 | 35.1 | 2.4 |
| – Net Position: | -23,887 | 21,295 | 2,592 |
| – Gross Longs: | 69,818 | 74,870 | 6,248 |
| – Gross Shorts: | 93,705 | 53,575 | 3,656 |
| – Long to Short Ratio: | 0.7 to 1 | 1.4 to 1 | 1.7 to 1 |
| NET POSITION TREND: | |||
| – COT Index Score (3 Year Range Pct): | 2.8 | 96.7 | 54.0 |
| – COT Index Reading (3 Year Range): | Bearish-Extreme | Bullish-Extreme | Bullish |
| NET POSITION MOVEMENT INDEX: | |||
| – 6-Week Change in Strength Index: | -2.2 | 3.1 | -8.2 |
Brazilian Real Futures:
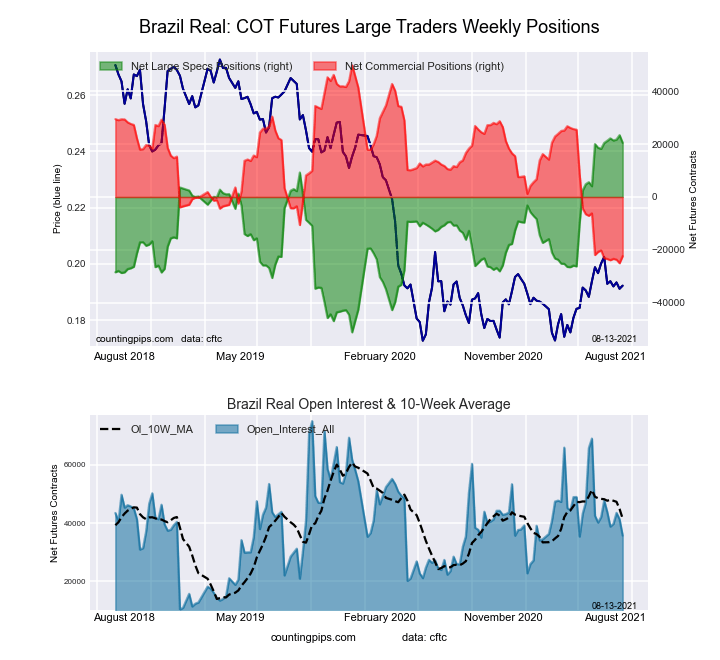 The Brazilian Real large speculator standing this week totaled a net position of 20,538 contracts in the data reported through Tuesday. This was a weekly decrease of -2,906 contracts from the previous week which had a total of 23,444 net contracts.
This week’s current strength score (the trader positioning range over the past three years, measured from 0 to 100) shows the speculators are currently Bullish-Extreme with a score of 96.1 percent. The commercials are Bearish-Extreme with a score of 3.5 percent and the small traders (not shown in chart) are Bullish-Extreme with a score of 89.5 percent.
| BRAZIL REAL Statistics | SPECULATORS | COMMERCIALS | SMALL TRADERS |
| – Percent of Open Interest Longs: | 73.3 | 17.0 | 9.6 |
| – Percent of Open Interest Shorts: | 15.8 | 79.8 | 4.4 |
| – Net Position: | 20,538 | -22,412 | 1,874 |
| – Gross Longs: | 26,162 | 6,074 | 3,429 |
| – Gross Shorts: | 5,624 | 28,486 | 1,555 |
| – Long to Short Ratio: | 4.7 to 1 | 0.2 to 1 | 2.2 to 1 |
| NET POSITION TREND: | |||
| – COT Index Score (3 Year Range Pct): | 96.1 | 3.5 | 89.5 |
| – COT Index Reading (3 Year Range): | Bullish-Extreme | Bearish-Extreme | Bullish-Extreme |
| NET POSITION MOVEMENT INDEX: | |||
| – 6-Week Change in Strength Index: | 0.1 | 1.1 | -10.5 |
Russian Ruble Futures:
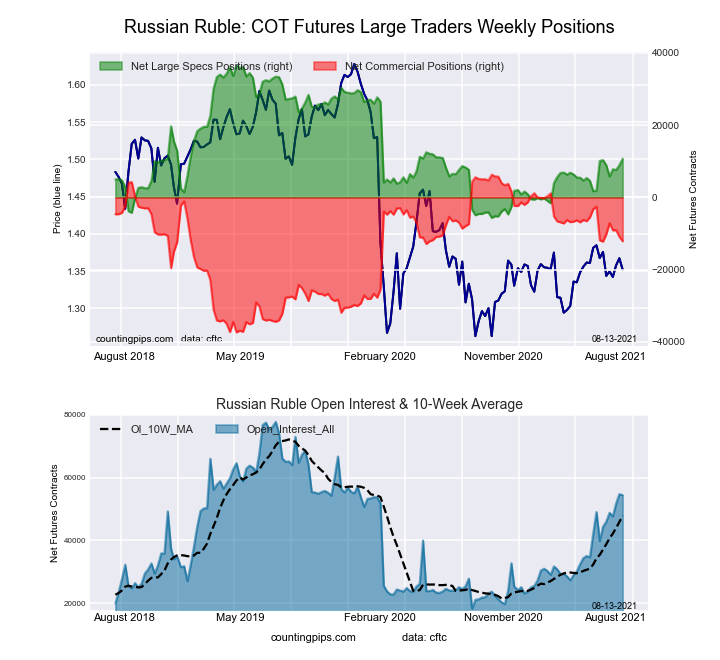 The Russian Ruble large speculator standing this week totaled a net position of 10,702 contracts in the data reported through Tuesday. This was a weekly lift of 1,779 contracts from the previous week which had a total of 8,923 net contracts.
This week’s current strength score (the trader positioning range over the past three years, measured from 0 to 100) shows the speculators are currently Bearish with a score of 38.7 percent. The commercials are Bullish with a score of 57.8 percent and the small traders (not shown in chart) are Bullish-Extreme with a score of 83.0 percent.
| RUSSIAN RUBLE Statistics | SPECULATORS | COMMERCIALS | SMALL TRADERS |
| – Percent of Open Interest Longs: | 40.5 | 54.3 | 5.2 |
| – Percent of Open Interest Shorts: | 20.8 | 76.6 | 2.6 |
| – Net Position: | 10,702 | -12,121 | 1,419 |
| – Gross Longs: | 22,018 | 29,534 | 2,808 |
| – Gross Shorts: | 11,316 | 41,655 | 1,389 |
| – Long to Short Ratio: | 1.9 to 1 | 0.7 to 1 | 2.0 to 1 |
| NET POSITION TREND: | |||
| – COT Index Score (3 Year Range Pct): | 38.7 | 57.8 | 83.0 |
| – COT Index Reading (3 Year Range): | Bearish | Bullish | Bullish-Extreme |
| NET POSITION MOVEMENT INDEX: | |||
| – 6-Week Change in Strength Index: | 0.9 | 0.2 | -13.9 |
Bitcoin Futures:
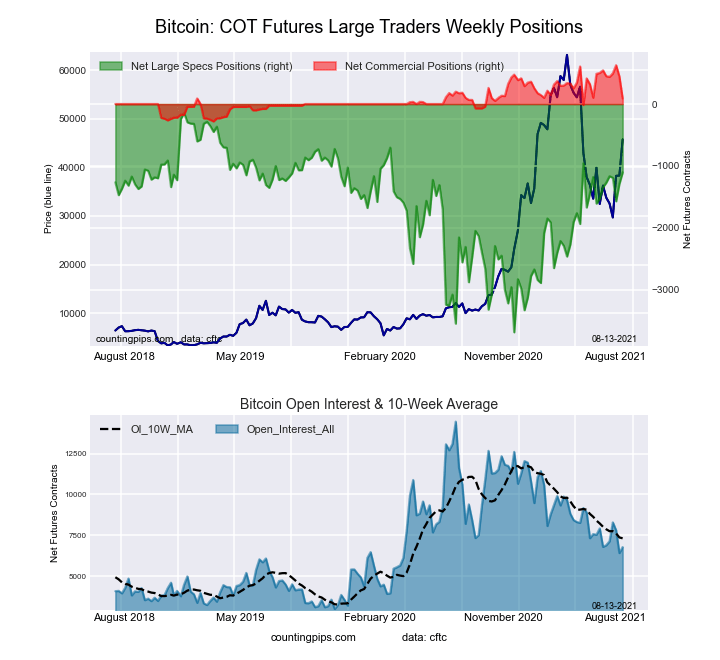 The Bitcoin large speculator standing this week totaled a net position of -1,104 contracts in the data reported through Tuesday. This was a weekly advance of 186 contracts from the previous week which had a total of -1,290 net contracts.
This week’s current strength score (the trader positioning range over the past three years, measured from 0 to 100) shows the speculators are currently Bullish with a score of 72.9 percent. The commercials are Bearish with a score of 40.6 percent and the small traders (not shown in chart) are Bearish with a score of 23.1 percent.
| BITCOIN Statistics | SPECULATORS | COMMERCIALS | SMALL TRADERS |
| – Percent of Open Interest Longs: | 64.5 | 4.2 | 26.2 |
| – Percent of Open Interest Shorts: | 80.8 | 2.9 | 11.2 |
| – Net Position: | -1,104 | 88 | 1,016 |
| – Gross Longs: | 4,368 | 286 | 1,774 |
| – Gross Shorts: | 5,472 | 198 | 758 |
| – Long to Short Ratio: | 0.8 to 1 | 1.4 to 1 | 2.3 to 1 |
| NET POSITION TREND: | |||
| – COT Index Score (3 Year Range Pct): | 72.9 | 40.6 | 23.1 |
| – COT Index Reading (3 Year Range): | Bullish | Bearish | Bearish |
| NET POSITION MOVEMENT INDEX: | |||
| – 6-Week Change in Strength Index: | 6.8 | -50.3 | 7.1 |
Article By CountingPips & InvestMacro – Receive our weekly COT Reports by Email
*COT Report: The COT data, released weekly to the public each Friday, is updated through the most recent Tuesday (data is 3 days old) and shows a quick view of how large speculators or non-commercials (for-profit traders) were positioned in the futures markets.
The CFTC categorizes trader positions according to commercial hedgers (traders who use futures contracts for hedging as part of the business), non-commercials (large traders who speculate to realize trading profits) and nonreportable traders (usually small traders/speculators).
Find CFTC criteria here: (http://www.cftc.gov/MarketReports/CommitmentsofTraders/ExplanatoryNotes/index.htm).

- The Tech‑heavy NASDAQ Index jumped by more than 3.3%. The offshore yuan is trading at its highest level since 2023 Jul 31, 2026
- USD/JPY After Volatility: Multiple Events in One Day Jul 31, 2026
- The US indices sell off amid renewed US-Iran clashes. Oil jumps by 7% Jul 30, 2026
- USD/JPY Temporary in Equilibrium: Multiple Factors in Focus Jul 30, 2026
- GBP/USD at Month’s Lows: The Outlook Remains Weak Jul 29, 2026
- Crude oil falls below $80 per barrel. Australia sees inflation slowdown Jul 29, 2026
- The US Tech sector hit by sell‑off. Oil prices decline on renewed negotiations Jul 28, 2026
- Gold Declines, Focus on Fed and Falling Oil Prices Jul 28, 2026
- This week will be one of the most crowded for central‑bank meetings Jul 27, 2026
- EUR/USD Ahead of a Key Week: Holding Near Lows Jul 27, 2026