
By Orbex
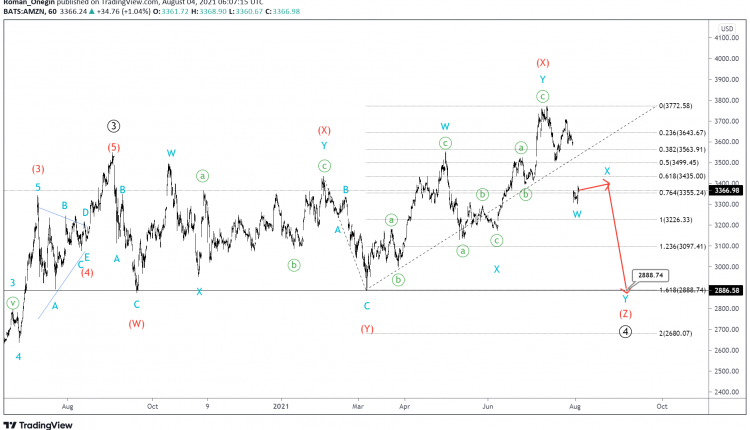
AMZN seems to be forming a bullish impulse, which includes the formation of a long fourth wave.
The primary correction wave ④ takes the form of an intermediate triple combination. The second intervening wave (X), which took the form of a double zigzag, has ended.
In the medium term, the final intermediate wave (Z) is likely to emerge as shown in the chart. This can be a complex zigzag structure W-X-Y.
The wave (Z) could end near 2888.74, where it will be at 161.8% of wave (Y).
Free Reports:
 Get our Weekly Commitment of Traders Reports - See where the biggest traders (Hedge Funds and Commercial Hedgers) are positioned in the futures markets on a weekly basis.
 Download Our Metatrader 4 Indicators – Put Our Free MetaTrader 4 Custom Indicators on your charts when you join our Weekly Newsletter

However, the formation of the primary correction ④ could have been completed earlier. In this case, the last fifth wave may be forming now.
It is possible that the primary wave ⑤ will have the internal structure of an ending diagonal. It seems that the market has recently completed the development of the intermediate wave (4), so in the near future, it could rise in the final intermediate wave (5) to 4066.64.
At that level, primary wave ⑤ will be at 61.8% of primary impulse wave ③.
By Orbex

- The Central Bank of Mexico kept its interest rate unchanged. Iran plans to introduce strict bans for US and Israeli vessels in the Strait of Hormuz Aug 7, 2026
- USD/JPY Holds Firm: Yen Loses Some Support Aug 7, 2026
- Australian trade balance returned to positive territory Aug 6, 2026
- Results in Line for Most Reporting Companies Aug 5, 2026
- Stock indices continue to break records. Oil is falling amid intensified diplomatic dialogue between the US and Iran Aug 5, 2026
- USD/JPY Holds Steady After Intervention: Outlook Remains Uncertain Aug 5, 2026
- EUR/USD: Busy Week Ahead Aug 3, 2026
- Positive sentiment in the AI sector supported stock indices. Oil prices remain volatile Aug 3, 2026
- The Tech‑heavy NASDAQ Index jumped by more than 3.3%. The offshore yuan is trading at its highest level since 2023 Jul 31, 2026
- USD/JPY After Volatility: Multiple Events in One Day Jul 31, 2026
