
By CountingPips.com COT Home | Data Tables | Data Downloads | Newsletter
Here are the latest charts and statistics for the Commitment of Traders (COT) data published by the Commodities Futures Trading Commission (CFTC).
The latest COT data is updated through Tuesday July 6th 2021 and shows a quick view of how large traders (for-profit speculators and commercial entities) were positioned in the futures markets.
Gold Comex Futures:
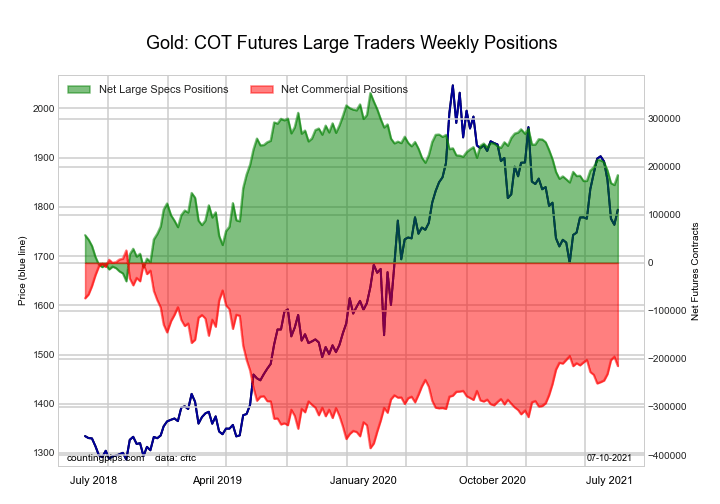 The Gold Comex Futures large speculator standing this week resulted in a net position of 182,821 contracts in the data reported through Tuesday. This was a weekly gain of 20,595 contracts from the previous week which had a total of 162,226 net contracts.
This week’s current strength score (the trader positioning range over the past three years, measured from 0 to 100) shows the speculators are currently Bullish with a score of 56.4 percent. The commercials are Bearish with a score of 41.5 percent and the small traders (not shown in chart) are Bullish with a score of 61.0 percent.
| Gold Futures Statistics | SPECULATORS | COMMERCIALS | SMALL TRADERS |
| – Percent of Open Interest Longs: | 58.1 | 23.1 | 10.7 |
| – Percent of Open Interest Shorts: | 18.8 | 69.2 | 3.9 |
| – Net Position: | 182,821 | -214,726 | 31,905 |
| – Gross Longs: | 270,545 | 107,675 | 49,928 |
| – Gross Shorts: | 87,724 | 322,401 | 18,023 |
| – Long to Short Ratio: | 3.1 to 1 | 0.3 to 1 | 2.8 to 1 |
| NET POSITION TREND: | |||
| – COT Index Score (3 Year Range Pct): | 56.4 | 41.5 | 61.0 |
| – COT Index Reading (3 Year Range): | Bullish | Bearish | Bullish |
| NET POSITION MOVEMENT INDEX: | |||
| – 6-Week Change in Strength Index: | -8.1 | 8.8 | -10.6 |
Free Reports:
 Get our Weekly Commitment of Traders Reports - See where the biggest traders (Hedge Funds and Commercial Hedgers) are positioned in the futures markets on a weekly basis.
 Download Our Metatrader 4 Indicators – Put Our Free MetaTrader 4 Custom Indicators on your charts when you join our Weekly Newsletter
Silver Comex Futures:
 The Silver Comex Futures large speculator standing this week resulted in a net position of 44,488 contracts in the data reported through Tuesday. This was a weekly lift of 3,011 contracts from the previous week which had a total of 41,477 net contracts.
This week’s current strength score (the trader positioning range over the past three years, measured from 0 to 100) shows the speculators are currently Bullish with a score of 68.8 percent. The commercials are Bearish with a score of 32.7 percent and the small traders (not shown in chart) are Bearish with a score of 49.4 percent.
| Silver Futures Statistics | SPECULATORS | COMMERCIALS | SMALL TRADERS |
| – Percent of Open Interest Longs: | 48.8 | 27.9 | 17.9 |
| – Percent of Open Interest Shorts: | 20.5 | 68.1 | 6.0 |
| – Net Position: | 44,488 | -63,097 | 18,609 |
| – Gross Longs: | 76,790 | 43,915 | 28,067 |
| – Gross Shorts: | 32,302 | 107,012 | 9,458 |
| – Long to Short Ratio: | 2.4 to 1 | 0.4 to 1 | 3.0 to 1 |
| NET POSITION TREND: | |||
| – COT Index Score (3 Year Range Pct): | 68.8 | 32.7 | 49.4 |
| – COT Index Reading (3 Year Range): | Bullish | Bearish | Bearish |
| NET POSITION MOVEMENT INDEX: | |||
| – 6-Week Change in Strength Index: | -5.6 | 8.0 | -19.2 |
Copper Grade #1 Futures:
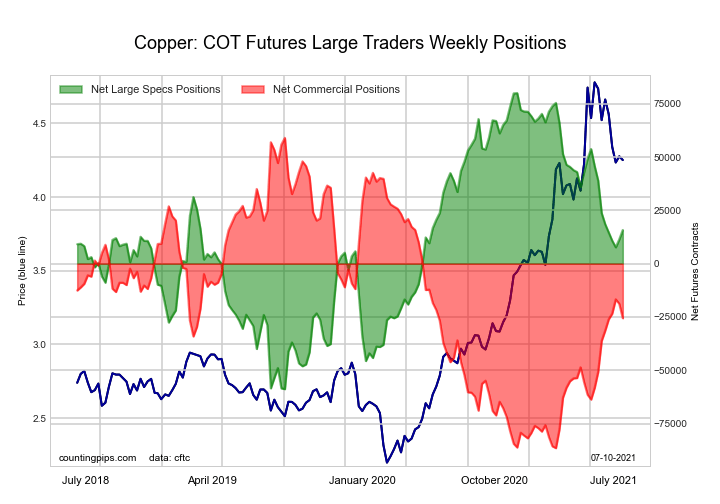 The Copper Grade #1 Futures large speculator standing this week resulted in a net position of 15,773 contracts in the data reported through Tuesday. This was a weekly lift of 4,412 contracts from the previous week which had a total of 11,361 net contracts.
This week’s current strength score (the trader positioning range over the past three years, measured from 0 to 100) shows the speculators are currently Bullish with a score of 53.7 percent. The commercials are Bearish with a score of 41.9 percent and the small traders (not shown in chart) are Bullish-Extreme with a score of 82.0 percent.
| Copper Futures Statistics | SPECULATORS | COMMERCIALS | SMALL TRADERS |
| – Percent of Open Interest Longs: | 41.6 | 37.4 | 10.6 |
| – Percent of Open Interest Shorts: | 33.8 | 50.0 | 5.8 |
| – Net Position: | 15,773 | -25,582 | 9,809 |
| – Gross Longs: | 84,324 | 75,804 | 21,489 |
| – Gross Shorts: | 68,551 | 101,386 | 11,680 |
| – Long to Short Ratio: | 1.2 to 1 | 0.7 to 1 | 1.8 to 1 |
| NET POSITION TREND: | |||
| – COT Index Score (3 Year Range Pct): | 53.7 | 41.9 | 82.0 |
| – COT Index Reading (3 Year Range): | Bullish | Bearish | Bullish-Extreme |
| NET POSITION MOVEMENT INDEX: | |||
| – 6-Week Change in Strength Index: | -5.7 | 7.3 | -15.5 |
Platinum Futures:
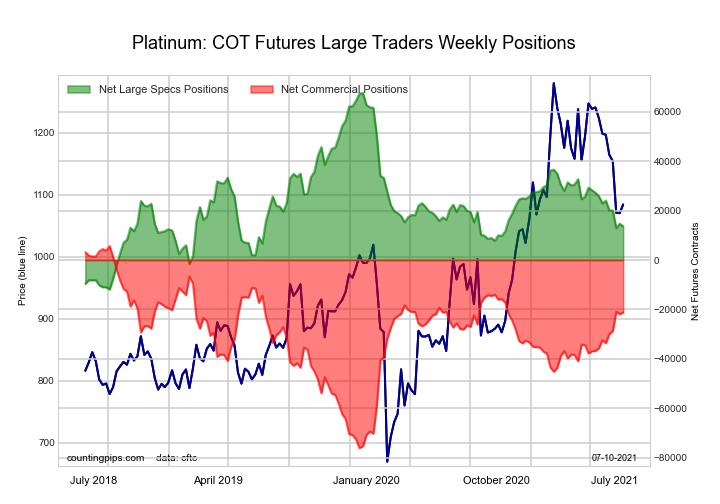 The Platinum Futures large speculator standing this week resulted in a net position of 13,576 contracts in the data reported through Tuesday. This was a weekly decrease of -1,168 contracts from the previous week which had a total of 14,744 net contracts.
This week’s current strength score (the trader positioning range over the past three years, measured from 0 to 100) shows the speculators are currently Bearish with a score of 32.1 percent. The commercials are Bullish with a score of 67.2 percent and the small traders (not shown in chart) are Bullish with a score of 68.2 percent.
| Platinum Futures Statistics | SPECULATORS | COMMERCIALS | SMALL TRADERS |
| – Percent of Open Interest Longs: | 51.2 | 28.5 | 18.0 |
| – Percent of Open Interest Shorts: | 26.7 | 66.7 | 4.3 |
| – Net Position: | 13,576 | -21,181 | 7,605 |
| – Gross Longs: | 28,390 | 15,797 | 9,993 |
| – Gross Shorts: | 14,814 | 36,978 | 2,388 |
| – Long to Short Ratio: | 1.9 to 1 | 0.4 to 1 | 4.2 to 1 |
| NET POSITION TREND: | |||
| – COT Index Score (3 Year Range Pct): | 32.1 | 67.2 | 68.2 |
| – COT Index Reading (3 Year Range): | Bearish | Bullish | Bullish |
| NET POSITION MOVEMENT INDEX: | |||
| – 6-Week Change in Strength Index: | -11.8 | 13.7 | -25.6 |
Palladium Futures:
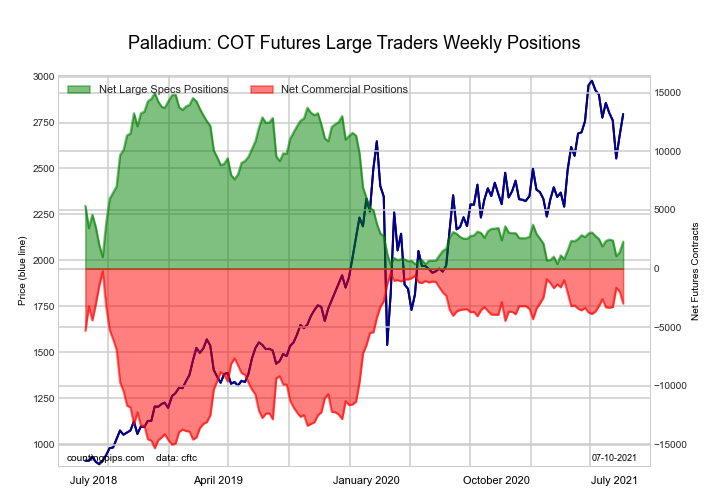 The Palladium Futures large speculator standing this week resulted in a net position of 2,303 contracts in the data reported through Tuesday. This was a weekly gain of 895 contracts from the previous week which had a total of 1,408 net contracts.
This week’s current strength score (the trader positioning range over the past three years, measured from 0 to 100) shows the speculators are currently Bearish-Extreme with a score of 13.7 percent. The commercials are Bullish-Extreme with a score of 81.7 percent and the small traders (not shown in chart) are Bullish-Extreme with a score of 84.4 percent.
| Palladium Futures Statistics | SPECULATORS | COMMERCIALS | SMALL TRADERS |
| – Percent of Open Interest Longs: | 52.7 | 30.0 | 15.0 |
| – Percent of Open Interest Shorts: | 30.0 | 59.4 | 8.4 |
| – Net Position: | 2,303 | -2,976 | 673 |
| – Gross Longs: | 5,334 | 3,030 | 1,518 |
| – Gross Shorts: | 3,031 | 6,006 | 845 |
| – Long to Short Ratio: | 1.8 to 1 | 0.5 to 1 | 1.8 to 1 |
| NET POSITION TREND: | |||
| – COT Index Score (3 Year Range Pct): | 13.7 | 81.7 | 84.4 |
| – COT Index Reading (3 Year Range): | Bearish-Extreme | Bullish-Extreme | Bullish-Extreme |
| NET POSITION MOVEMENT INDEX: | |||
| – 6-Week Change in Strength Index: | 2.8 | -2.5 | -1.9 |
Article By CountingPips.com – Receive our weekly COT Reports by Email
*COT Report: The COT data, released weekly to the public each Friday, is updated through the most recent Tuesday (data is 3 days old) and shows a quick view of how large speculators or non-commercials (for-profit traders) were positioned in the futures markets.
The CFTC categorizes trader positions according to commercial hedgers (traders who use futures contracts for hedging as part of the business), non-commercials (large traders who speculate to realize trading profits) and nonreportable traders (usually small traders/speculators).
Find CFTC criteria here: (http://www.cftc.gov/MarketReports/CommitmentsofTraders/ExplanatoryNotes/index.htm).

- Investors run to safe-haven assets amid Middle East escalation Mar 6, 2026
- EUR/USD Under Pressure: Middle East Risks Outweigh All Else Mar 6, 2026
- Bitcoin shows resilience to Middle East events. Oil market stabilizes Mar 5, 2026
- GBP/USD: Market Not Expecting BoE Rate Cut in March Mar 5, 2026
- Brent headed for $100? Mar 4, 2026
- Global stock indices continue sell-off due to Middle East conflict Mar 4, 2026
- USD/JPY to Quickly Return to Growth: Momentum Favours the US Dollar Mar 4, 2026
- European equities plunge amid Persian Gulf military conflict Mar 3, 2026
- Gold Rallies for Fifth Day, With External Risks Mounting Mar 3, 2026
- Iran Crisis: A Dangerous Turning Point Mar 2, 2026