
By CountingPips.com COT Home | Data Tables | Data Downloads | Newsletter
Here are the latest charts and statistics for the Commitment of Traders (COT) data published by the Commodities Futures Trading Commission (CFTC).
The latest COT data is updated through Tuesday June 08 2021 and shows a quick view of how large traders (for-profit speculators and commercial entities) were positioned in the futures markets.
Gold Comex Futures Futures:

The Gold Comex Futures large speculator standing this week came in at a net position of 209,387 contracts in the data reported through Tuesday. This was a weekly decrease of -4,314 contracts from the previous week which had a total of 213,701 net contracts.
This week’s current strength score (the trader positioning range over the past three years, measured from 0 to 100) shows the speculators are currently Bullish with a score of 63.2 percent. The commercials are Bearish with a score of 34.2 percent and the small traders (not shown in chart) are Bullish with a score of 69.6 percent.
| Gold Futures Statistics | SPECULATORS | COMMERCIALS | SMALL TRADERS |
| – Percent of Open Interest Longs: | 58.7 | 21.0 | 10.9 |
| – Percent of Open Interest Shorts: | 16.1 | 70.8 | 3.7 |
| – Net Position: | 209,387 | -244,806 | 35,419 |
| – Gross Longs: | 288,781 | 103,496 | 53,829 |
| – Gross Shorts: | 79,394 | 348,302 | 18,410 |
| – Long to Short Ratio: | 3.6 to 1 | 0.3 to 1 | 2.9 to 1 |
| NET POSITION TREND: | |||
| – COT Index Score (3 Year Range Pct): | 63.2 | 34.2 | 69.6 |
| – COT Index Reading (3 Year Range): | Bullish | Bearish | Bullish |
| NET POSITION MOVEMENT INDEX: | |||
| – 6-Week Change in Strength Index: | 9.9 | -9.1 | -2.8 |
Free Reports:
 Get our Weekly Commitment of Traders Reports - See where the biggest traders (Hedge Funds and Commercial Hedgers) are positioned in the futures markets on a weekly basis.
 Sign Up for Our Stock Market Newsletter – Get updated on News, Charts & Rankings of Public Companies when you join our Stocks Newsletter
Silver Comex Futures Futures:
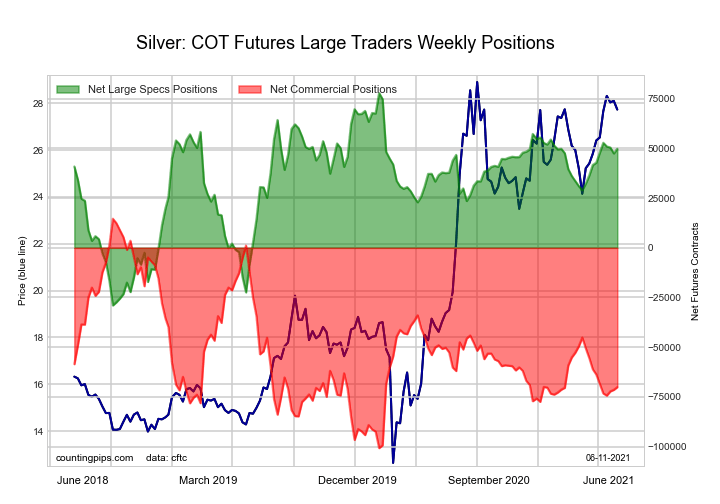
The Silver Comex Futures large speculator standing this week came in at a net position of 49,806 contracts in the data reported through Tuesday. This was a weekly boost of 2,289 contracts from the previous week which had a total of 47,517 net contracts.
This week’s current strength score (the trader positioning range over the past three years, measured from 0 to 100) shows the speculators are currently Bullish with a score of 73.7 percent. The commercials are Bearish with a score of 26.6 percent and the small traders (not shown in chart) are Bullish with a score of 59.7 percent.
| Silver Futures Statistics | SPECULATORS | COMMERCIALS | SMALL TRADERS |
| – Percent of Open Interest Longs: | 45.1 | 29.7 | 18.2 |
| – Percent of Open Interest Shorts: | 18.2 | 67.6 | 7.2 |
| – Net Position: | 49,806 | -70,113 | 20,307 |
| – Gross Longs: | 83,378 | 54,818 | 33,582 |
| – Gross Shorts: | 33,572 | 124,931 | 13,275 |
| – Long to Short Ratio: | 2.5 to 1 | 0.4 to 1 | 2.5 to 1 |
| NET POSITION TREND: | |||
| – COT Index Score (3 Year Range Pct): | 73.7 | 26.6 | 59.7 |
| – COT Index Reading (3 Year Range): | Bullish | Bearish | Bullish |
| NET POSITION MOVEMENT INDEX: | |||
| – 6-Week Change in Strength Index: | 6.5 | -5.5 | -3.6 |
Copper Grade #1 Futures Futures:

The Copper Grade #1 Futures large speculator standing this week came in at a net position of 14,635 contracts in the data reported through Tuesday. This was a weekly fall of -3,888 contracts from the previous week which had a total of 18,523 net contracts.
This week’s current strength score (the trader positioning range over the past three years, measured from 0 to 100) shows the speculators are currently Bullish with a score of 52.9 percent. The commercials are Bearish with a score of 41.5 percent and the small traders (not shown in chart) are Bullish-Extreme with a score of 91.6 percent.
| Copper Futures Statistics | SPECULATORS | COMMERCIALS | SMALL TRADERS |
| – Percent of Open Interest Longs: | 38.9 | 33.5 | 10.8 |
| – Percent of Open Interest Shorts: | 32.7 | 44.6 | 5.9 |
| – Net Position: | 14,635 | -26,103 | 11,468 |
| – Gross Longs: | 91,156 | 78,359 | 25,257 |
| – Gross Shorts: | 76,521 | 104,462 | 13,789 |
| – Long to Short Ratio: | 1.2 to 1 | 0.8 to 1 | 1.8 to 1 |
| NET POSITION TREND: | |||
| – COT Index Score (3 Year Range Pct): | 52.9 | 41.5 | 91.6 |
| – COT Index Reading (3 Year Range): | Bullish | Bearish | Bullish-Extreme |
| NET POSITION MOVEMENT INDEX: | |||
| – 6-Week Change in Strength Index: | -24.9 | 24.3 | -4.4 |
Platinum Futures Futures:
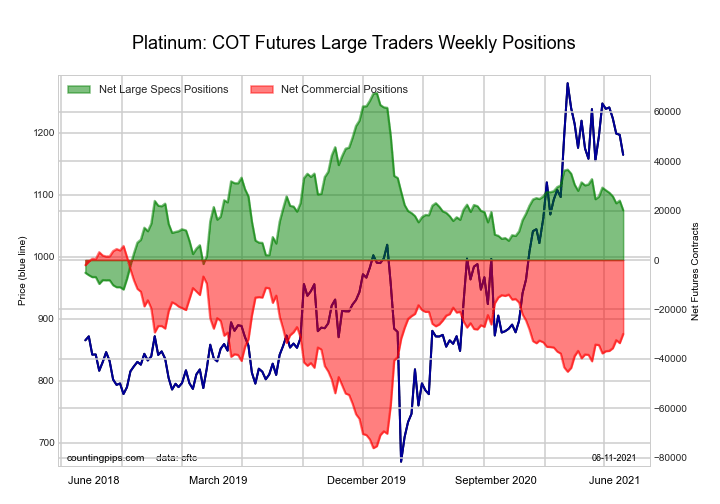
The Platinum Futures large speculator standing this week came in at a net position of 20,164 contracts in the data reported through Tuesday. This was a weekly fall of -3,881 contracts from the previous week which had a total of 24,045 net contracts.
This week’s current strength score (the trader positioning range over the past three years, measured from 0 to 100) shows the speculators are currently Bearish with a score of 40.3 percent. The commercials are Bullish with a score of 56.5 percent and the small traders (not shown in chart) are Bullish-Extreme with a score of 98.4 percent.
| Platinum Futures Statistics | SPECULATORS | COMMERCIALS | SMALL TRADERS |
| – Percent of Open Interest Longs: | 56.6 | 21.0 | 18.2 |
| – Percent of Open Interest Shorts: | 26.3 | 65.9 | 3.6 |
| – Net Position: | 20,164 | -29,929 | 9,765 |
| – Gross Longs: | 37,717 | 13,975 | 12,154 |
| – Gross Shorts: | 17,553 | 43,904 | 2,389 |
| – Long to Short Ratio: | 2.1 to 1 | 0.3 to 1 | 5.1 to 1 |
| NET POSITION TREND: | |||
| – COT Index Score (3 Year Range Pct): | 40.3 | 56.5 | 98.4 |
| – COT Index Reading (3 Year Range): | Bearish | Bullish | Bullish-Extreme |
| NET POSITION MOVEMENT INDEX: | |||
| – 6-Week Change in Strength Index: | -11.5 | 9.6 | 17.9 |
Palladium Futures Futures:
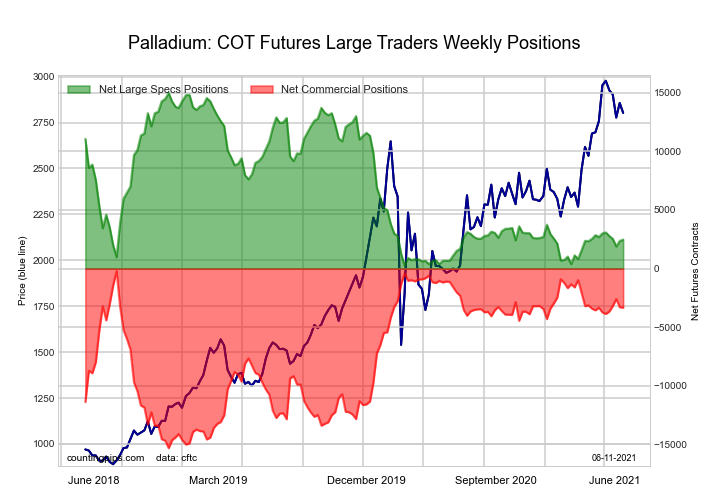
The Palladium Futures large speculator standing this week came in at a net position of 2,475 contracts in the data reported through Tuesday. This was a weekly rise of 113 contracts from the previous week which had a total of 2,362 net contracts.
This week’s current strength score (the trader positioning range over the past three years, measured from 0 to 100) shows the speculators are currently Bearish-Extreme with a score of 14.9 percent. The commercials are Bullish with a score of 79.3 percent and the small traders (not shown in chart) are Bullish-Extreme with a score of 95.0 percent.
| Palladium Futures Statistics | SPECULATORS | COMMERCIALS | SMALL TRADERS |
| – Percent of Open Interest Longs: | 56.9 | 25.6 | 14.8 |
| – Percent of Open Interest Shorts: | 33.9 | 56.6 | 6.9 |
| – Net Position: | 2,475 | -3,329 | 854 |
| – Gross Longs: | 6,127 | 2,760 | 1,595 |
| – Gross Shorts: | 3,652 | 6,089 | 741 |
| – Long to Short Ratio: | 1.7 to 1 | 0.5 to 1 | 2.2 to 1 |
| NET POSITION TREND: | |||
| – COT Index Score (3 Year Range Pct): | 14.9 | 79.3 | 95.0 |
| – COT Index Reading (3 Year Range): | Bearish-Extreme | Bullish | Bullish-Extreme |
| NET POSITION MOVEMENT INDEX: | |||
| – 6-Week Change in Strength Index: | -3.6 | 2.7 | 7.3 |
Article By CountingPips.com – Receive our weekly COT Reports by Email
*COT Report: The COT data, released weekly to the public each Friday, is updated through the most recent Tuesday (data is 3 days old) and shows a quick view of how large speculators or non-commercials (for-profit traders) were positioned in the futures markets.
The CFTC categorizes trader positions according to commercial hedgers (traders who use futures contracts for hedging as part of the business), non-commercials (large traders who speculate to realize trading profits) and nonreportable traders (usually small traders/speculators).
Find CFTC criteria here: (http://www.cftc.gov/MarketReports/CommitmentsofTraders/ExplanatoryNotes/index.htm).

- GBP/USD at Month’s Lows: The Outlook Remains Weak Jul 29, 2026
- Crude oil falls below $80 per barrel. Australia sees inflation slowdown Jul 29, 2026
- The US Tech sector hit by sell‑off. Oil prices decline on renewed negotiations Jul 28, 2026
- Gold Declines, Focus on Fed and Falling Oil Prices Jul 28, 2026
- This week will be one of the most crowded for central‑bank meetings Jul 27, 2026
- EUR/USD Ahead of a Key Week: Holding Near Lows Jul 27, 2026
- COT Metals Charts: Weekly Speculator Changes led by Copper Jul 26, 2026
- COT Bonds Charts: Speculator Bets led by SOFR 3-Months & 5-Year Bonds Jul 26, 2026
- COT Energy Charts: Weekly Speculator Bets led by WTI Crude & Natural Gas Jul 26, 2026
- COT Soft Commodities Charts: Weekly Speculator Bets led by Corn & Soybeans Jul 26, 2026