
The digital payment sector is on fire as investors look towards the future. One stock that has benefited from this interest is PayPal. Many investors are now looking towards the company to gain cryptocurrency exposure on the back of PayPal’s push into cryptocurrencies for online payments.
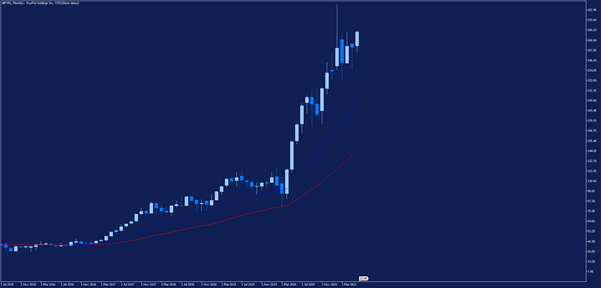 Source: Admirals MetaTrader 5, PYPL, Monthly – Data range: from Jul 1, 2015, to Jun 17, 2021, performed on Jun 17, 2021, at 8:30 pm GMT. Please note: Past performance is not a reliable indicator of future results.
Technically, the stock price looks very interesting. A bullish ascending triangle pattern has formed on the daily chart of the PayPal’s share price over the last few months, as shown below. Now, the stock is trying to break through technical horizontal resistance around $276.00.
Free Reports:
 Sign Up for Our Stock Market Newsletter – Get updated on News, Charts & Rankings of Public Companies when you join our Stocks Newsletter
 Get our Weekly Commitment of Traders Reports - See where the biggest traders (Hedge Funds and Commercial Hedgers) are positioned in the futures markets on a weekly basis.
If the price can break through the top of the ascending triangle resistance level and hold, traders may well be focused on the all-time high price of around $307.00, representing a more than 10% surge higher.
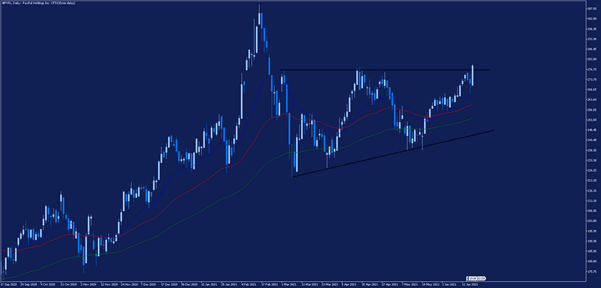 Source: Admirals MetaTrader 5, PYPL, Daily – Data range: from Sep 17, 2020, to Jun 17, 2021, performed on Jun 17, 2021, at 8:30 pm GMT. Please note: Past performance is not a reliable indicator of future results.
Of course, there is the potential for a false breakout to develop. However, sentiment remains bullish as the Nasdaq 100 stock market index continues in an uptrend lifting the broader technology sector.
Did you know that you can use the Trading Central Technical Ideas Lookup indicator to find actionable trading ideas on thousands of different markets?
Start your free download by clicking on the banner below:

INFORMATION ABOUT ANALYTICAL MATERIALS:
The given data provides additional information regarding all analysis, estimates, prognosis, forecasts, market reviews, weekly outlooks or other similar assessments or information (hereinafter “Analysis”) published on the websites of Admiral Markets investment firms operating under the Admiral Markets trademark (hereinafter “Admiral Markets”) Before making any investment decisions please pay close attention to the following:
- This is a marketing communication. The content is published for informative purposes only and is in no way to be construed as investment advice or recommendation. It has not been prepared in accordance with legal requirements designed to promote the independence of investment research, and that it is not subject to any prohibition on dealing ahead of the dissemination of investment research.
- Any investment decision is made by each client alone whereas Admiral Markets shall not be responsible for any loss or damage arising from any such decision, whether or not based on the content.
- With view to protecting the interests of our clients and the objectivity of the Analysis, Admiral Markets has established relevant internal procedures for prevention and management of conflicts of interest.
- The Analysis is prepared by an independent analyst, Jitan Solanki (analyst), (hereinafter “Author”) based on their personal estimations.
- Whilst every reasonable effort is taken to ensure that all sources of the content are reliable and that all information is presented, as much as possible, in an understandable, timely, precise and complete manner, Admiral Markets does not guarantee the accuracy or completeness of any information contained within the Analysis.
- Any kind of past or modeled performance of financial instruments indicated within the content should not be construed as an express or implied promise, guarantee or implication by Admiral Markets for any future performance. The value of the financial instrument may both increase and decrease and the preservation of the asset value is not guaranteed.
- Leveraged products (including contracts for difference) are speculative in nature and may result in losses or profit. Before you start trading, please ensure that you fully understand the risks involved.

- COT Metals Charts: Weekly Speculator Bets led by Copper & Steel Jul 18, 2026
- COT Bonds Charts: Weekly Speculator Bets led by 2-Year, SOFR 3M & 5-Year Bonds Jul 18, 2026
- COT Energy Charts: Weekly Speculator Bets led by Brent Oil & Heating Oil Jul 18, 2026
- COT Soft Commodities Charts: Weekly Speculator Bets led by Wheat, Corn & Soybean Meal Jul 18, 2026
- The Bank of Canada kept its interest rate unchanged. Platinum prices reached a three‑week high Jul 16, 2026
- Stock indices rose after the release of US inflation data. China’s GDP slowed sharply Jul 15, 2026
- GBP/USD Awaits Political News: What Will Happen Next Jul 15, 2026
- USD/JPY Holds at Highs: Pressure Lingers on Yen Jul 14, 2026
- Oil prices jumped 4% amid a new wave of escalation between the US and Iran Jul 13, 2026
- EUR/USD: US Inflation Will Determine Everything Jul 13, 2026