
Article By RoboForex.com
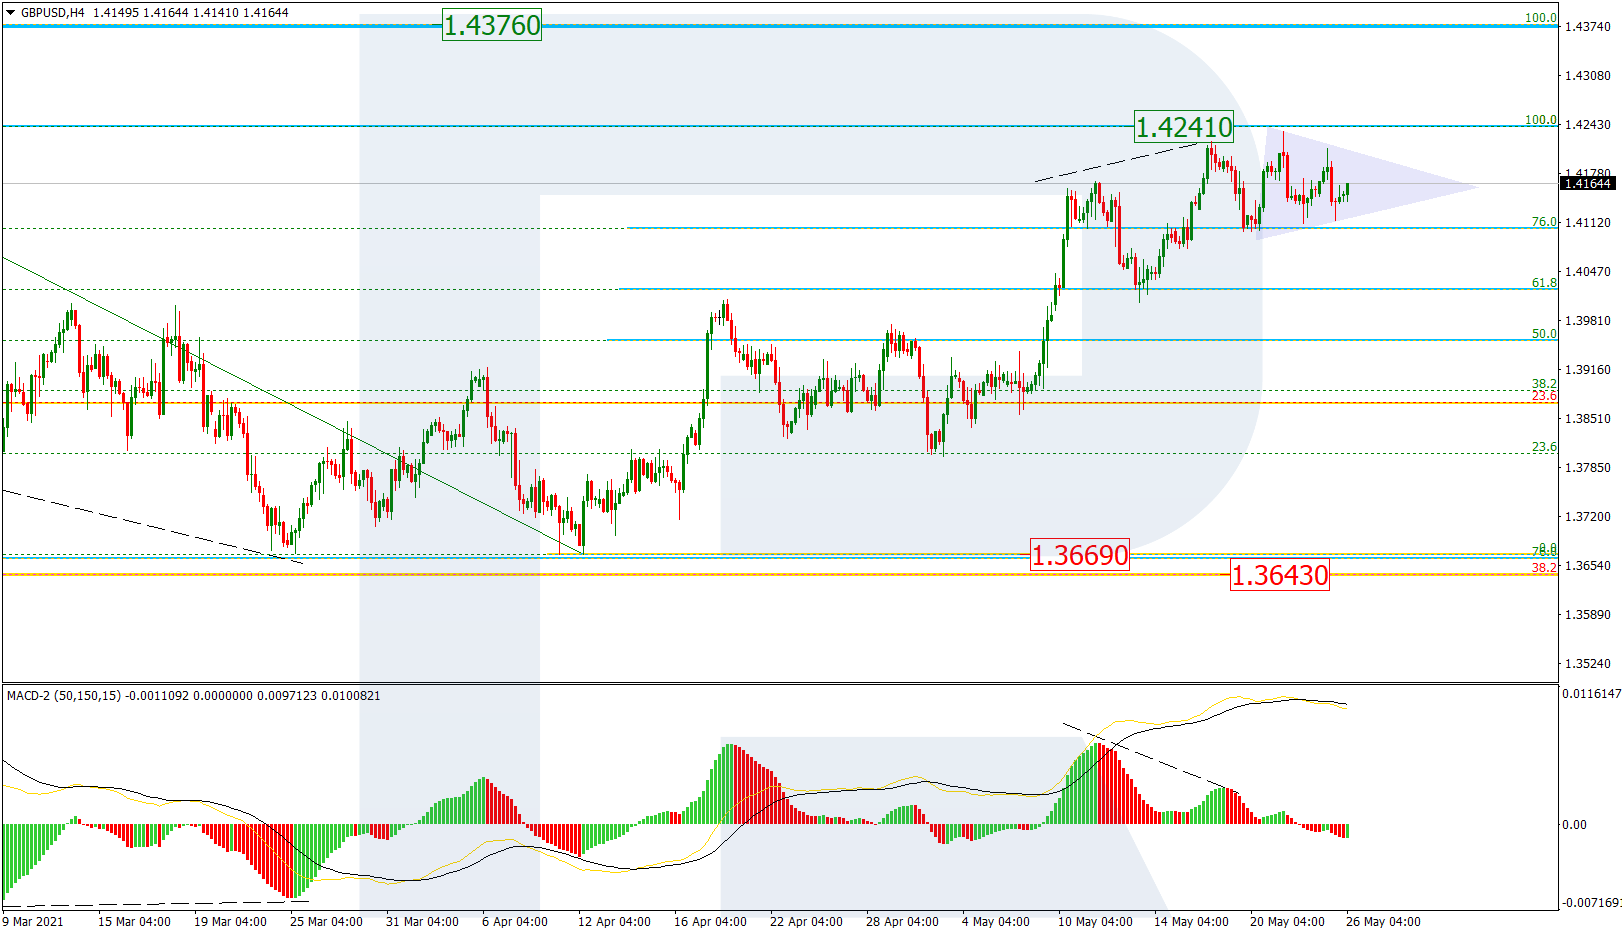
GBPUSD, “Great Britain Pound vs US Dollar”
As we can see in the H4 chart, the pair is consolidating between the high (1.4241) and 76.0% fibo after a divergence on MACD. In this case, GBPUSD is expected to break the high and continue growing towards the long-term high at 1.4376. An alternative scenario implies that the price may rebound from the high and extend the correction to 61.8% fibo, which may act as the local support here.

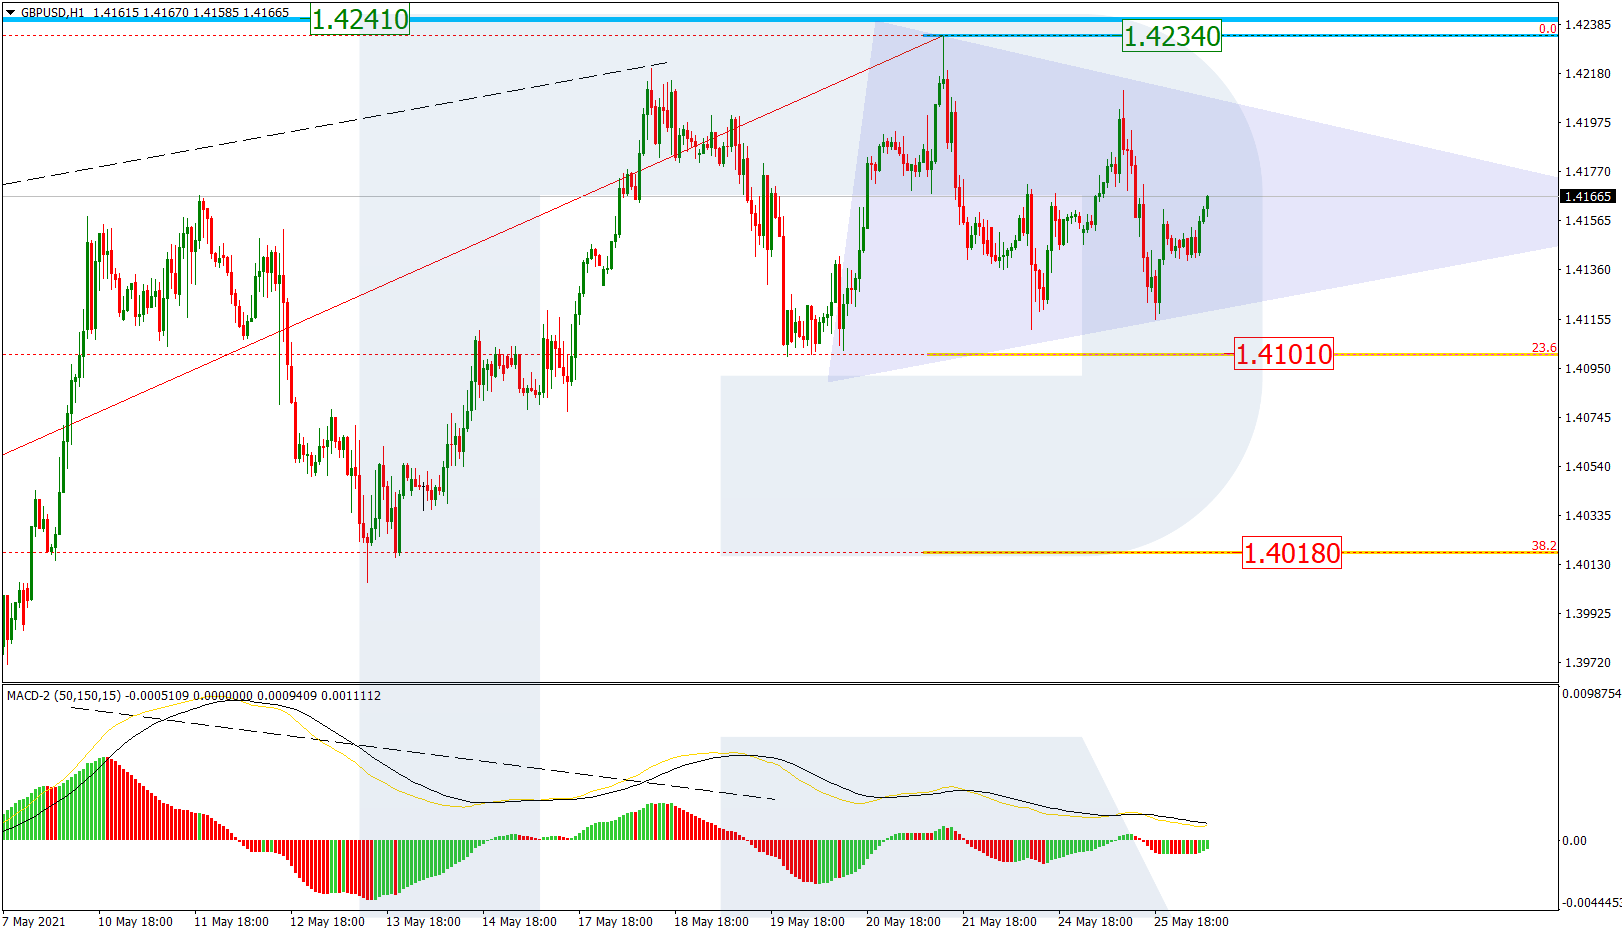
The H1 chart shows a more detailed structure of the current consolidation range after a divergence on MACD. The chart also shows correctional targets, which may be reached after the price breaks the downside border of the above-mentioned range – 23.6% and 38.2% fibo at 1.4101 and 1.4018 respectively. the local resistance is the high at 1.4234.
Free Reports:
 Sign Up for Our Stock Market Newsletter – Get updated on News, Charts & Rankings of Public Companies when you join our Stocks Newsletter
 Get our Weekly Commitment of Traders Reports - See where the biggest traders (Hedge Funds and Commercial Hedgers) are positioned in the futures markets on a weekly basis.
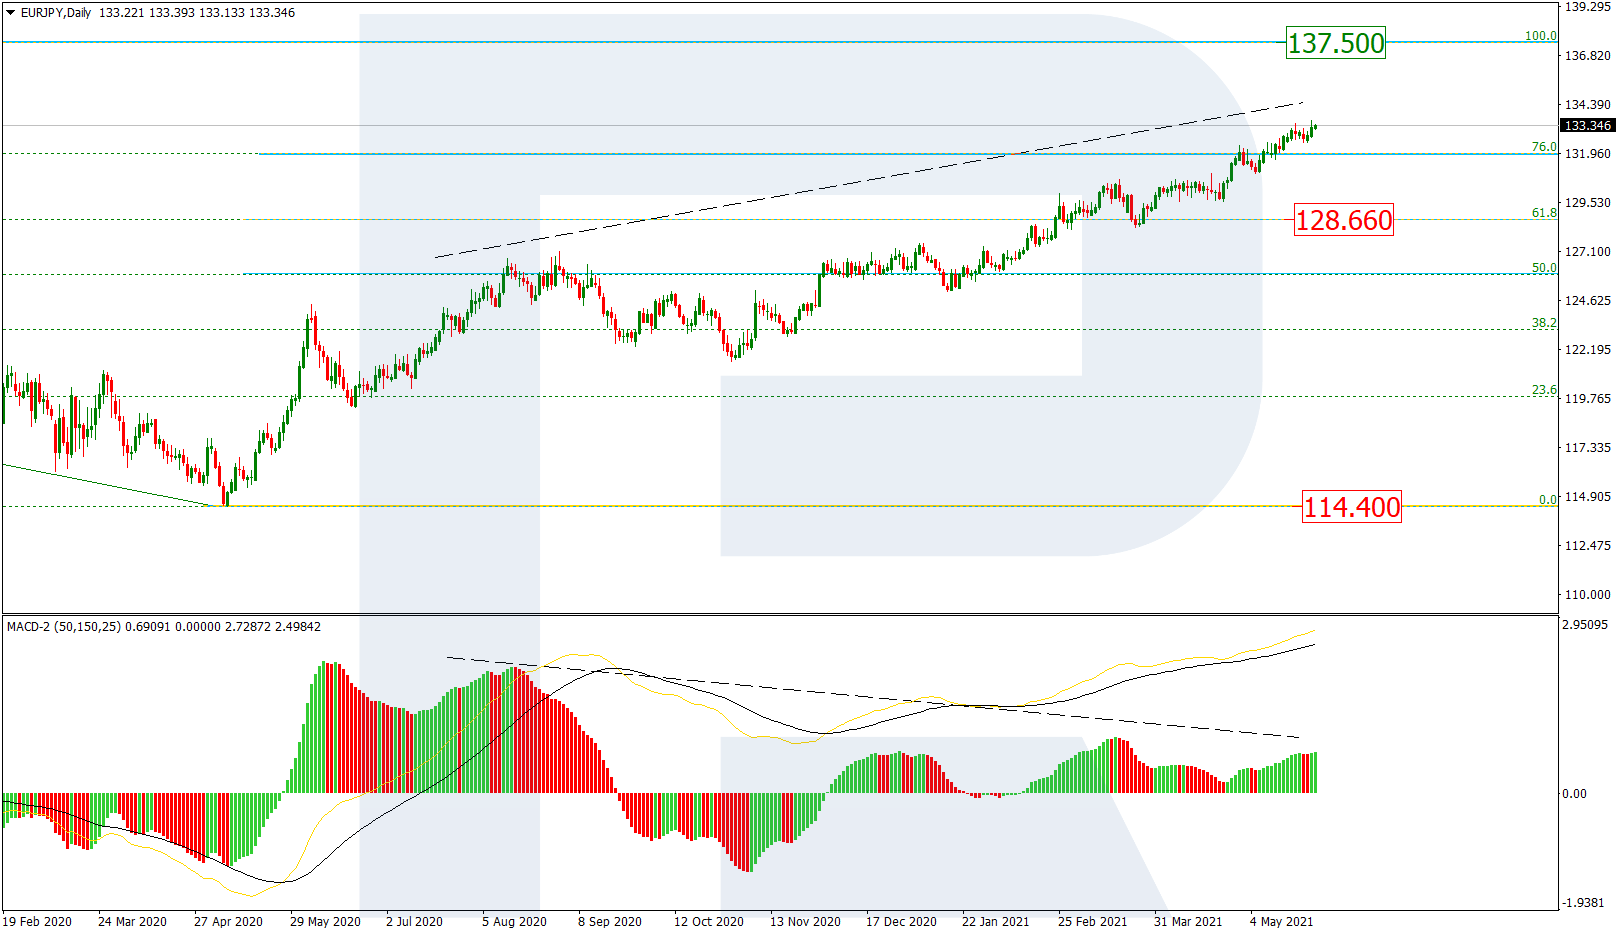
EURJPY, “Euro vs. Japanese Yen”
In the daily chart, after breaking 76.0% fibo, EURJPY is still trading upwards to reach its key high at 137.50. At the same time, a divergence on MACD may hint at a possible descending correction after the price reaches its target. The short-term target of this correction may be the support at 61.8% fibo (128.66). If the instrument breaks this level, is may form a new descending impulse towards the low at 114.40.
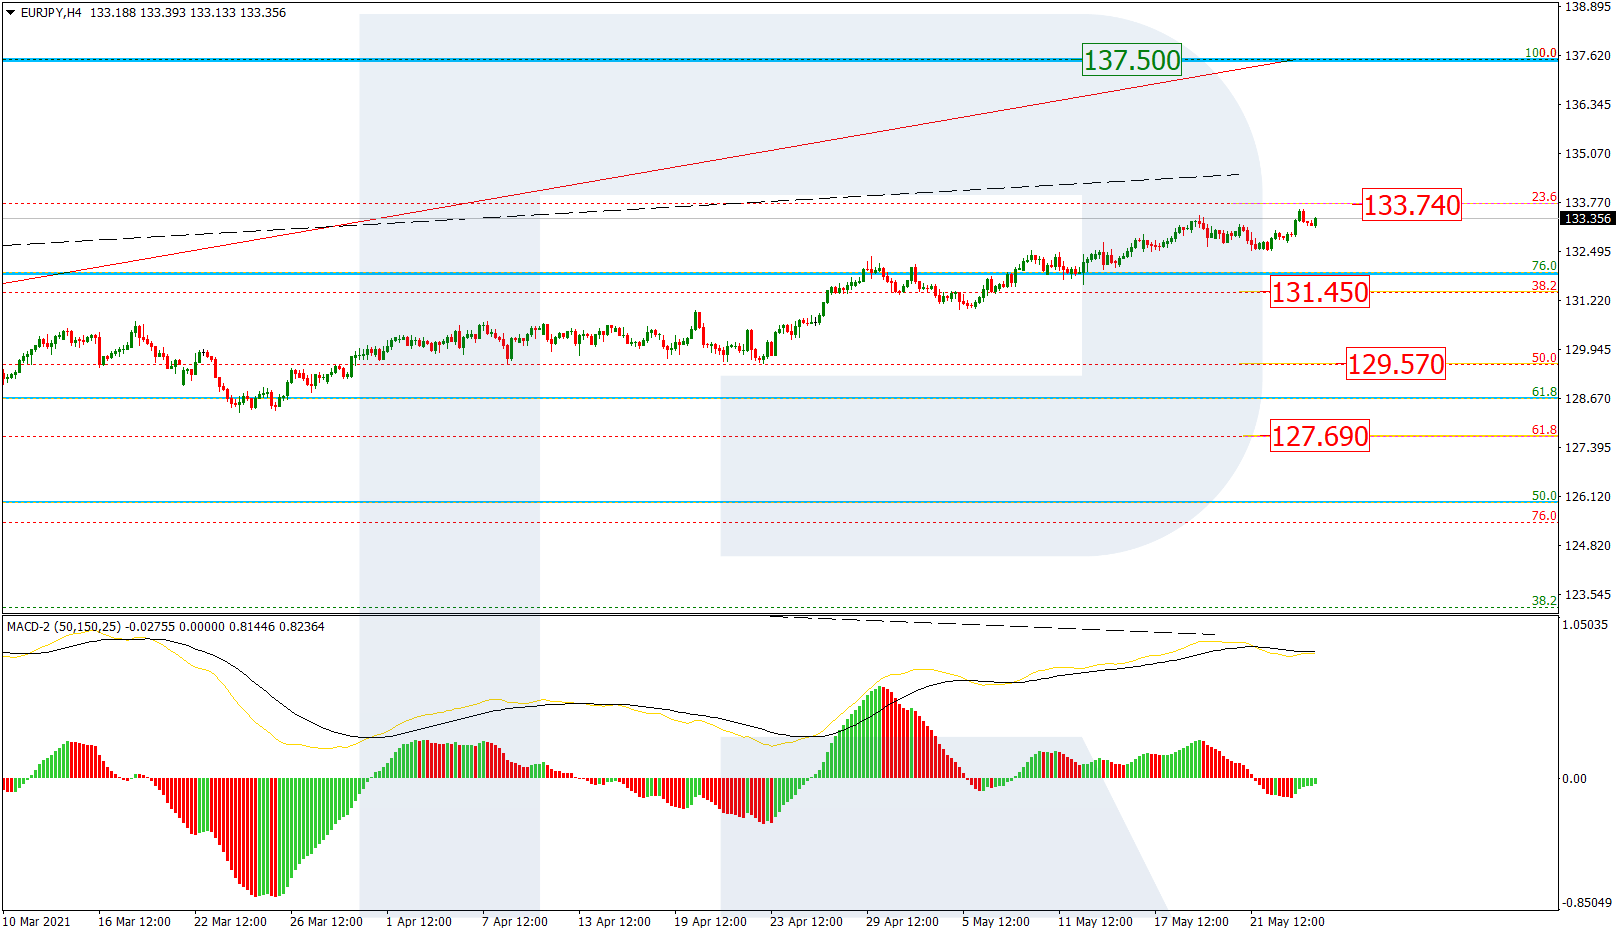
The H4 chart shows possible correctional targets after a divergence on MACD – 23.6%, 38.2%, 50.0%, and 61.8% fibo at 133.74, 131.45, 129.57, and 127.69 respectively.
Article By RoboForex.com
Attention!
Forecasts presented in this section only reflect the author’s private opinion and should not be considered as guidance for trading. RoboForex LP bears no responsibility for trading results based on trading recommendations described in these analytical reviews.

- COT Metals Charts: Speculator Bets led by Silver, Gold & Platinum Mar 7, 2026
- COT Bonds Charts: Speculator Bets led by 10-Year Bonds & Fed Funds Mar 7, 2026
- COT Energy Charts: Speculator Bets led by Brent Oil & Heating Oil Mar 7, 2026
- COT Soft Commodities Charts: Speculator Bets led by Corn & Soybean Meal Mar 7, 2026
- Investors run to safe-haven assets amid Middle East escalation Mar 6, 2026
- EUR/USD Under Pressure: Middle East Risks Outweigh All Else Mar 6, 2026
- Bitcoin shows resilience to Middle East events. Oil market stabilizes Mar 5, 2026
- GBP/USD: Market Not Expecting BoE Rate Cut in March Mar 5, 2026
- Brent headed for $100? Mar 4, 2026
- Global stock indices continue sell-off due to Middle East conflict Mar 4, 2026