
Chart Analysis
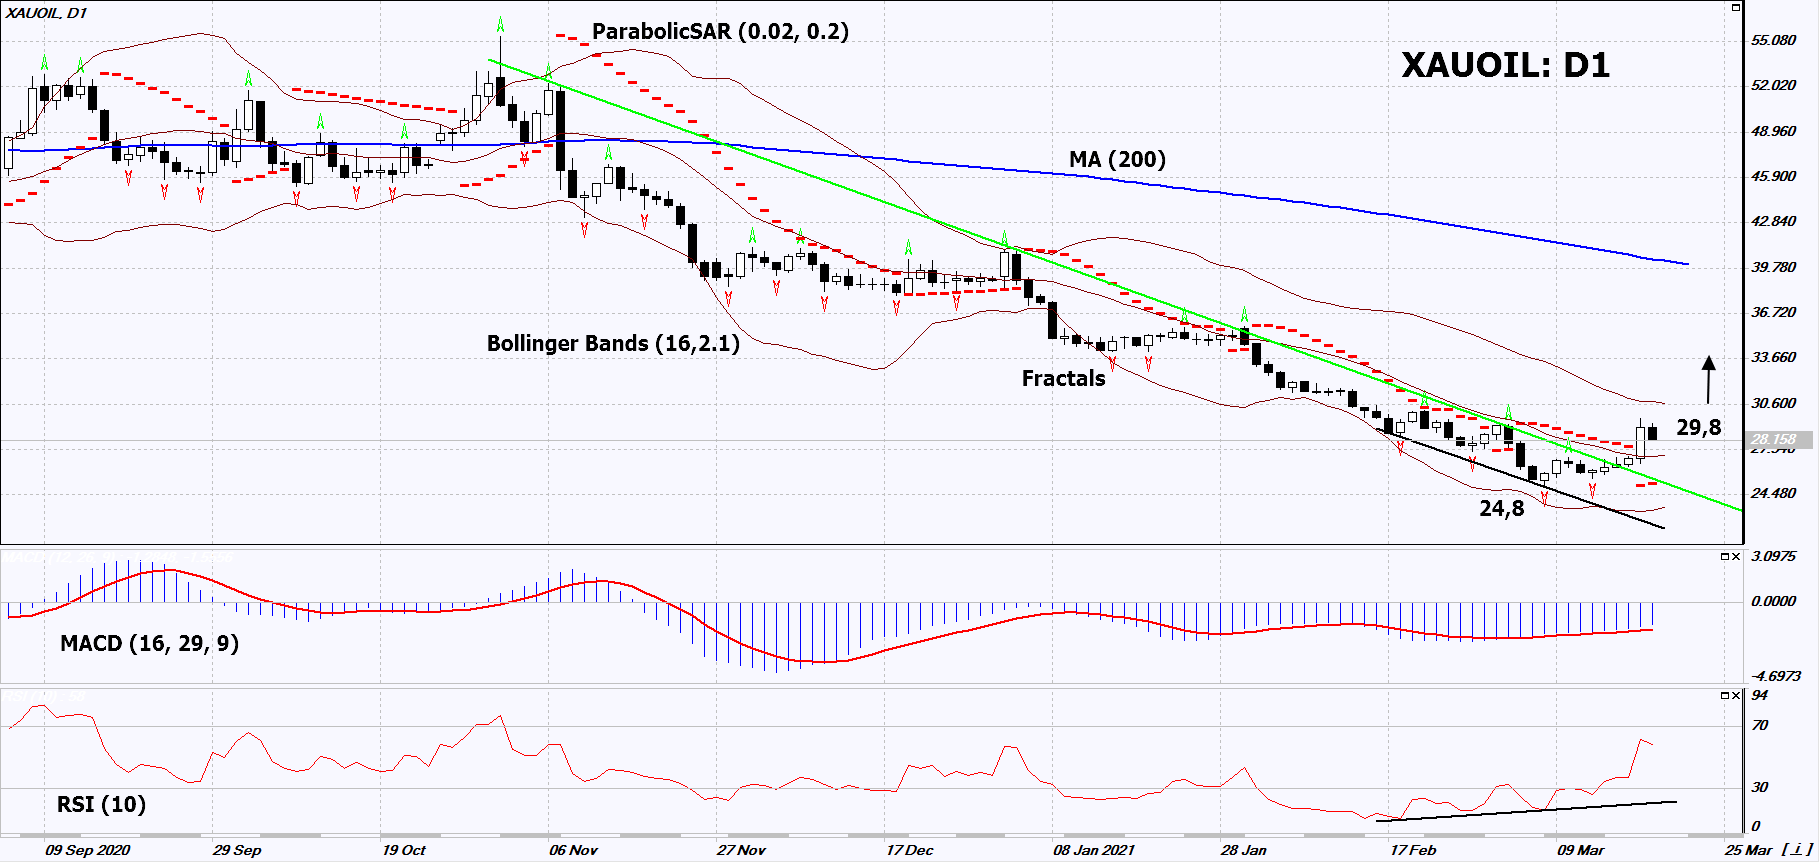
On the daily timeframe, XAUOIL: D1 came out of a long-term downtrend. A number of technical analysis indicators formed signals for further growth. We do not rule out a bullish move if XAUOIL rises above the last high: 29.8. This level can be used as an entry point. We can place a stop loss below the Parabolic signal, 2 last lower fractals and the low since January 2020: 24.8. After opening a pending order, we can move the stop loss to the next fractal low following the Bollinger and Parabolic signals. Thus, we change the potential profit/loss ratio in our favor. After the transaction, the most risk-averse traders can switch to the four-hour chart and set a stop loss, moving it in the direction of the bias. If the price meets the stop loss (24.8) without activating the order (29.8), it is recommended to delete the order: the market sustains internal changes that have not been taken into account.
Fundamental Analysis
In this review, we will take a look at the “Gold vs Oil” instrument. Will the XAUOIL quotes rise?
The upward movement means that currently, gold is in higher demand compared to oil. This gold instrument is referred to as “Gold vs Light Sweet Oil (WTI)”. Currently, the main factor in the XAUOIL movement may be the suspension of the use of western coronavirus vaccines in a number of countries. Last week, their number exceeded 20 countries, including almost all European countries, as well as Indonesia, Thailand, Congo, South Africa. Side effects were the reason for the suspension of vaccination. Gold rises in price amid increased risks of a new wave of the Covid-19 global pandemic. For the same reason, oil quotes fell. Investors fear the resumed pandemic could lead to tougher lockdowns. This, in turn, may contribute to the reduction of world oil demand. The announcement by the U.S. Energy Information Administration that American oil reserves had increased by 2.4 million the previous week, was another negative factor. The International Energy Agency predicts a recovery in global oil demand above the pre-pandemic levels only by 2026.
Market Analysis provided by IFCMarkets.com

- COT Metals Charts: Weekly Speculator Changes led by Copper Jul 26, 2026
- COT Bonds Charts: Speculator Bets led by SOFR 3-Months & 5-Year Bonds Jul 26, 2026
- COT Energy Charts: Weekly Speculator Bets led by WTI Crude & Natural Gas Jul 26, 2026
- COT Soft Commodities Charts: Weekly Speculator Bets led by Corn & Soybeans Jul 26, 2026
- The US introduces new import tariffs for 60 countries. Brent crude surpasses $100 per barrel Jul 24, 2026
- USD/JPY Breaks Records: Nothing Slows the Yen’s Decline Jul 24, 2026
- Oil prices reached a 6‑week high. The AUD strengthened on the back of a strong labor‑market report Jul 23, 2026
- EUR/USD Recovers as Dollar Weakens Jul 23, 2026
- Bitcoin rose to $66,000. The New Zealand dollar continues to strengthen Jul 22, 2026
- Inflationary pressure is easing in Canada. In New Zealand, on the contrary, inflation is rising Jul 21, 2026
Free Reports:
 Download Our Metatrader 4 Indicators – Put Our Free MetaTrader 4 Custom Indicators on your charts when you join our Weekly Newsletter
 Get our Weekly Commitment of Traders Reports - See where the biggest traders (Hedge Funds and Commercial Hedgers) are positioned in the futures markets on a weekly basis.