
Author: Dmitriy Gurkovskiy, Chief Analyst at RoboForex
On February 26th, the Gold price reached $1714.90, the lowest level since June 16th, 2020. The key reason why the precious metal plummeted was the strengthening of the American currency, which skyrocketed due to a rally in the US bond yield.
Physical demand for Gold remains rather limited due to a drop in personal income all over the world because of the COVID-19 pandemic. Need for Gold as a “safe haven” asset is also pretty low: investors’ attitude towards risks is quite good, and the farther the better.
In this light, prospects of the precious metal are quite unimpressive – market players are really very confident that the pandemic will be over soon and that inflation will boost and the US Federal Reserve might get rid of its stimulus programs much earlier than it was thought before. As a result, there are not many options for Gold to rise.
As we can see in the H4 chart, XAU/USD continues forming the fifth descending wave with the target at 1700.00. After reaching this level, the asset is expected to consolidate there. If later the price breaks the range to the upside, the market may start a new rising wave with the first target at 1900.00. From the technical point of view, this scenario is confirmed by MACD Oscillator: its signal line is falling below 0, thus implying a further descending movement on the price chart.

Free Reports:
 Download Our Metatrader 4 Indicators – Put Our Free MetaTrader 4 Custom Indicators on your charts when you join our Weekly Newsletter
 Get our Weekly Commitment of Traders Reports - See where the biggest traders (Hedge Funds and Commercial Hedgers) are positioned in the futures markets on a weekly basis.
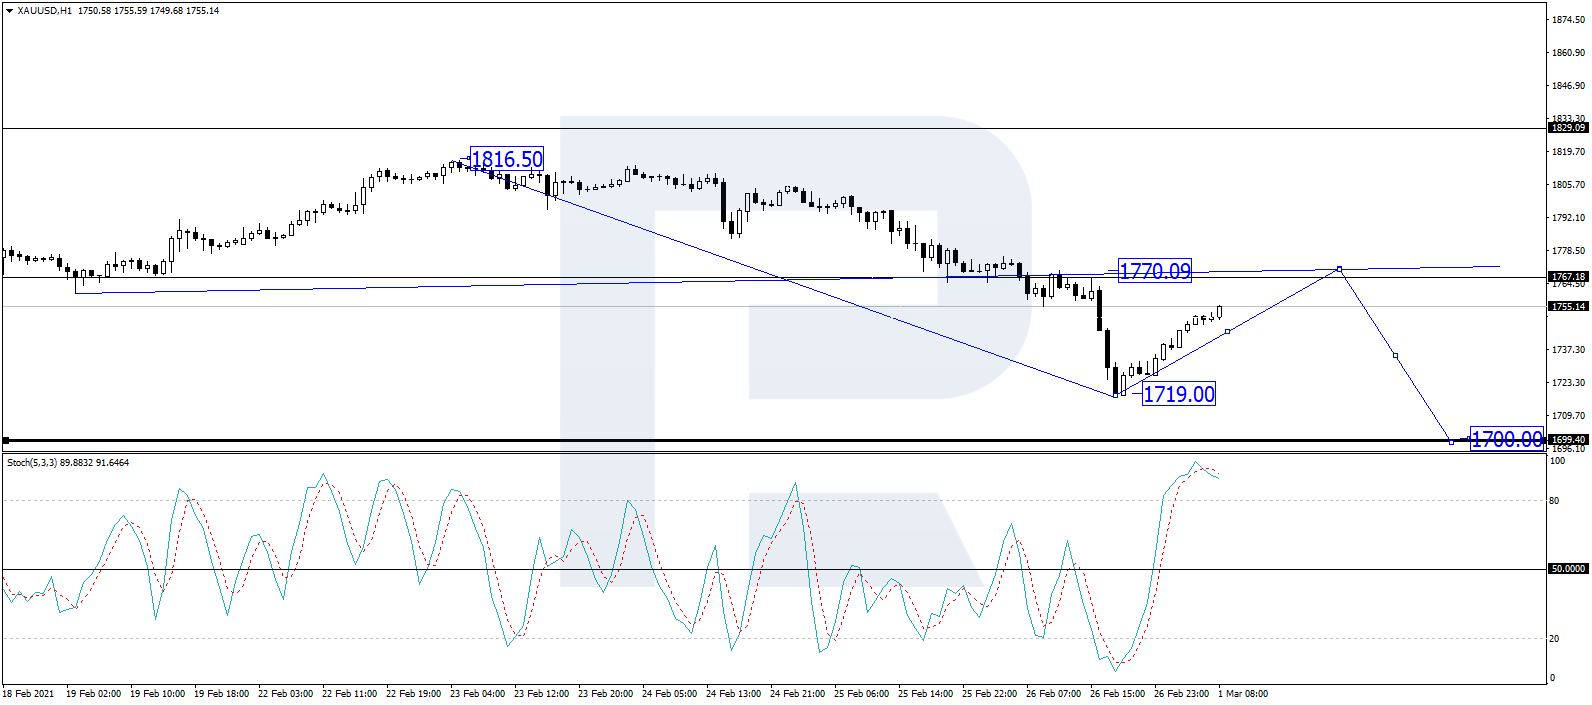
In the H1 chart, XAU/USD is growing towards 1770.00. Possibly, the pair may rebound from this level to the downside and then resume trading within the downtrend with the target at 1700.00. From the technical point of view, this scenario is confirmed by the Stochastic Oscillator: its signal is moving above 80, thus implying that the market is trading within the “overbought area”. The line is expected to move downwards and break 50.
Disclaimer
Any forecasts contained herein are based on the author’s particular opinion. This analysis may not be treated as trading advice. RoboForex bears no responsibility for trading results based on trading recommendations and reviews contained herein.

- This week will be one of the most crowded for central‑bank meetings Jul 27, 2026
- EUR/USD Ahead of a Key Week: Holding Near Lows Jul 27, 2026
- COT Metals Charts: Weekly Speculator Changes led by Copper Jul 26, 2026
- COT Bonds Charts: Speculator Bets led by SOFR 3-Months & 5-Year Bonds Jul 26, 2026
- COT Energy Charts: Weekly Speculator Bets led by WTI Crude & Natural Gas Jul 26, 2026
- COT Soft Commodities Charts: Weekly Speculator Bets led by Corn & Soybeans Jul 26, 2026
- The US introduces new import tariffs for 60 countries. Brent crude surpasses $100 per barrel Jul 24, 2026
- USD/JPY Breaks Records: Nothing Slows the Yen’s Decline Jul 24, 2026
- Oil prices reached a 6‑week high. The AUD strengthened on the back of a strong labor‑market report Jul 23, 2026
- EUR/USD Recovers as Dollar Weakens Jul 23, 2026
