
Article By RoboForex.com
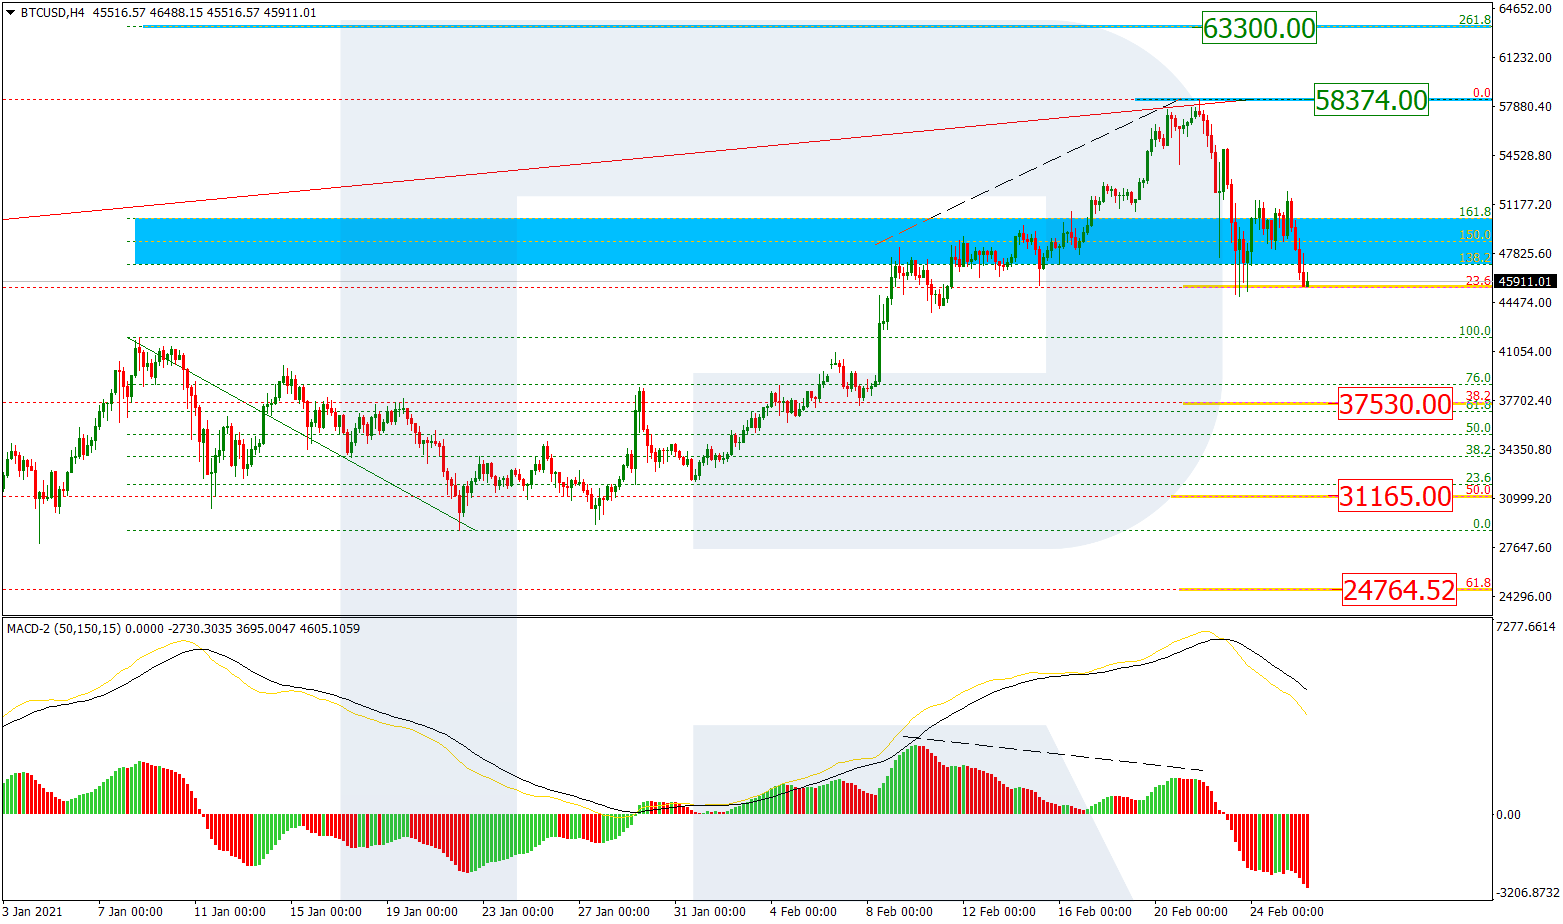
BTCUSD, “Bitcoin vs US Dollar”
As we can see in the H4 chart, after failing to reach 261.8% fibo at 63300.00, BTCUSD started plummeting due to divergence on MACD. The situation may indicate the start of a new mid-term or even long-term correction. The first descending impulse has already reached 23.6% fibo, while the next ones may continue towards 38.2%, 50.0%, and 61.8% fibo at 37530.00, 31165.00, and 24764.52 respectively. The resistance is the high at 58374.00.

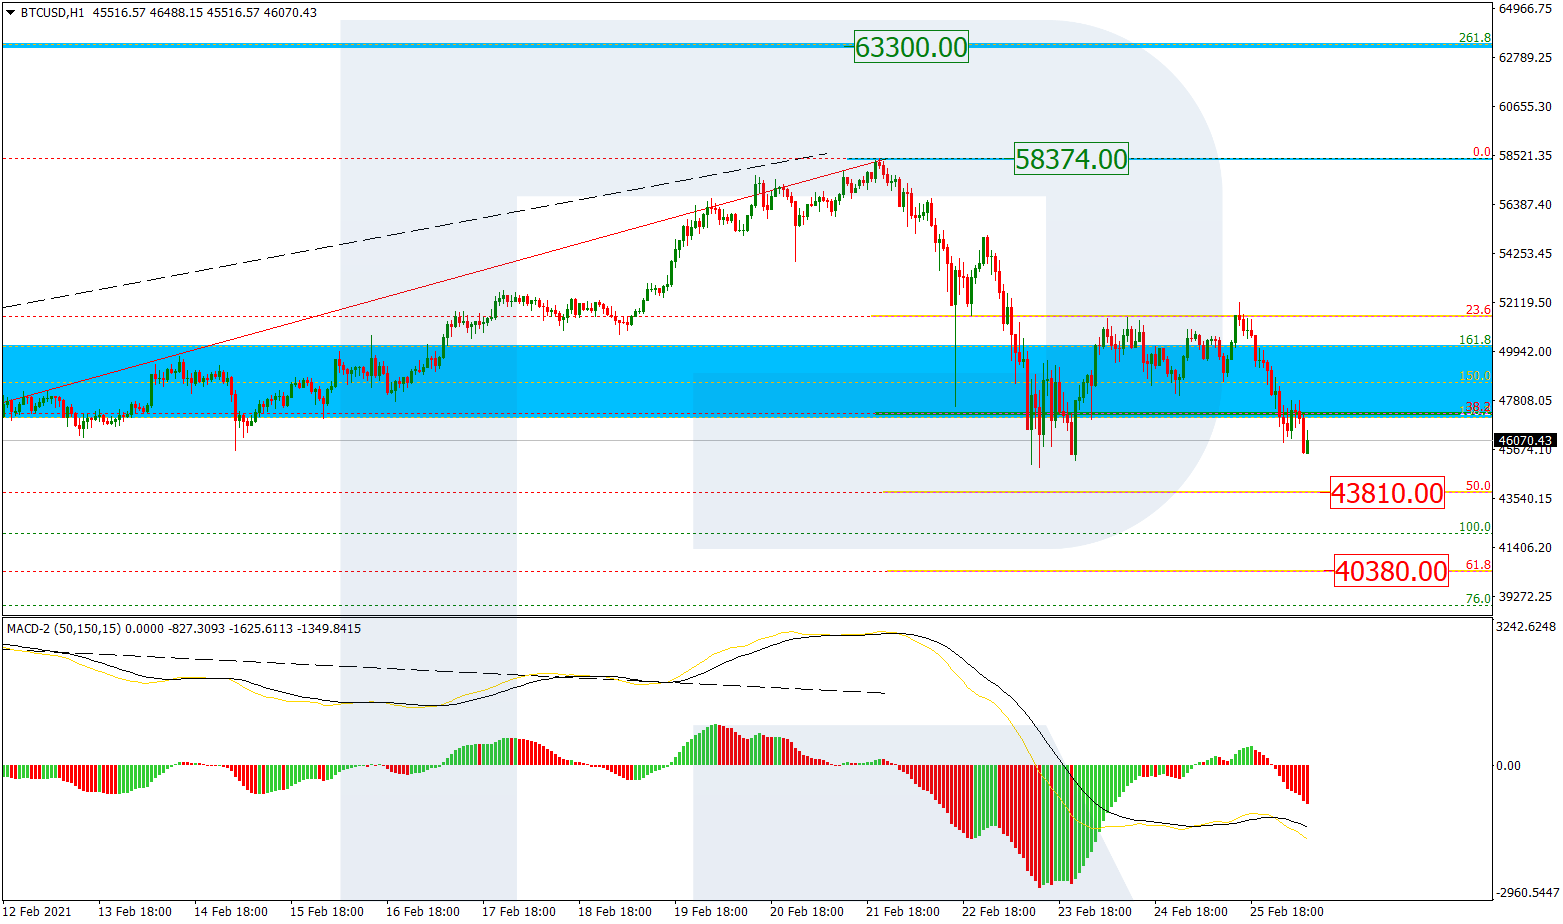
The H1 chart shows a descending correction, which has already broken 38.2% and is currently heading towards 50.0% and 61.8% fibo at 43810.00 and 40380.00 respectively.
Free Reports:
 Download Our Metatrader 4 Indicators – Put Our Free MetaTrader 4 Custom Indicators on your charts when you join our Weekly Newsletter
 Get our Weekly Commitment of Traders Reports - See where the biggest traders (Hedge Funds and Commercial Hedgers) are positioned in the futures markets on a weekly basis.
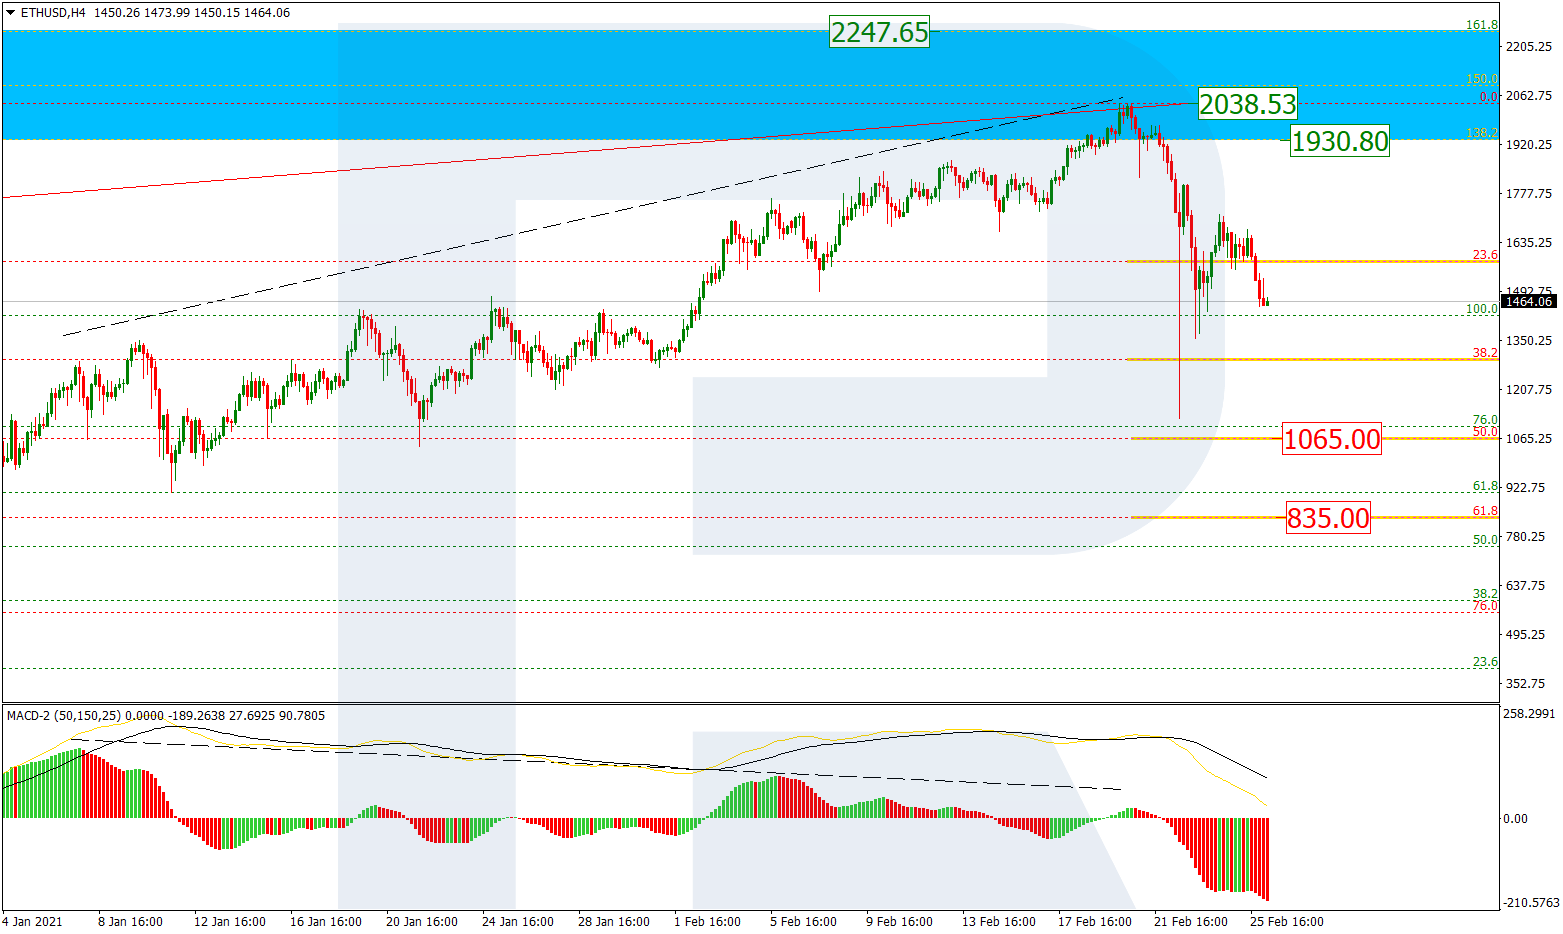
ETHUSD, “Ethereum vs. US Dollar”
In the H4 chart, after testing the post-correctional extension area between 138.2% and 161.8% fibo at 1930.80 and 2247.65 respectively, ETHUSD started plunging due to divergence on MACD. The first descending impulse broke 38.2% fibo but failed to reach 50.0% fibo at 1065.00. the current situation may be described as a correction within a correction. Possibly, the pair may complete the internal correction and resume falling to reach 61.8% fibo at 835.00. The key resistance is the high at 2038.53.
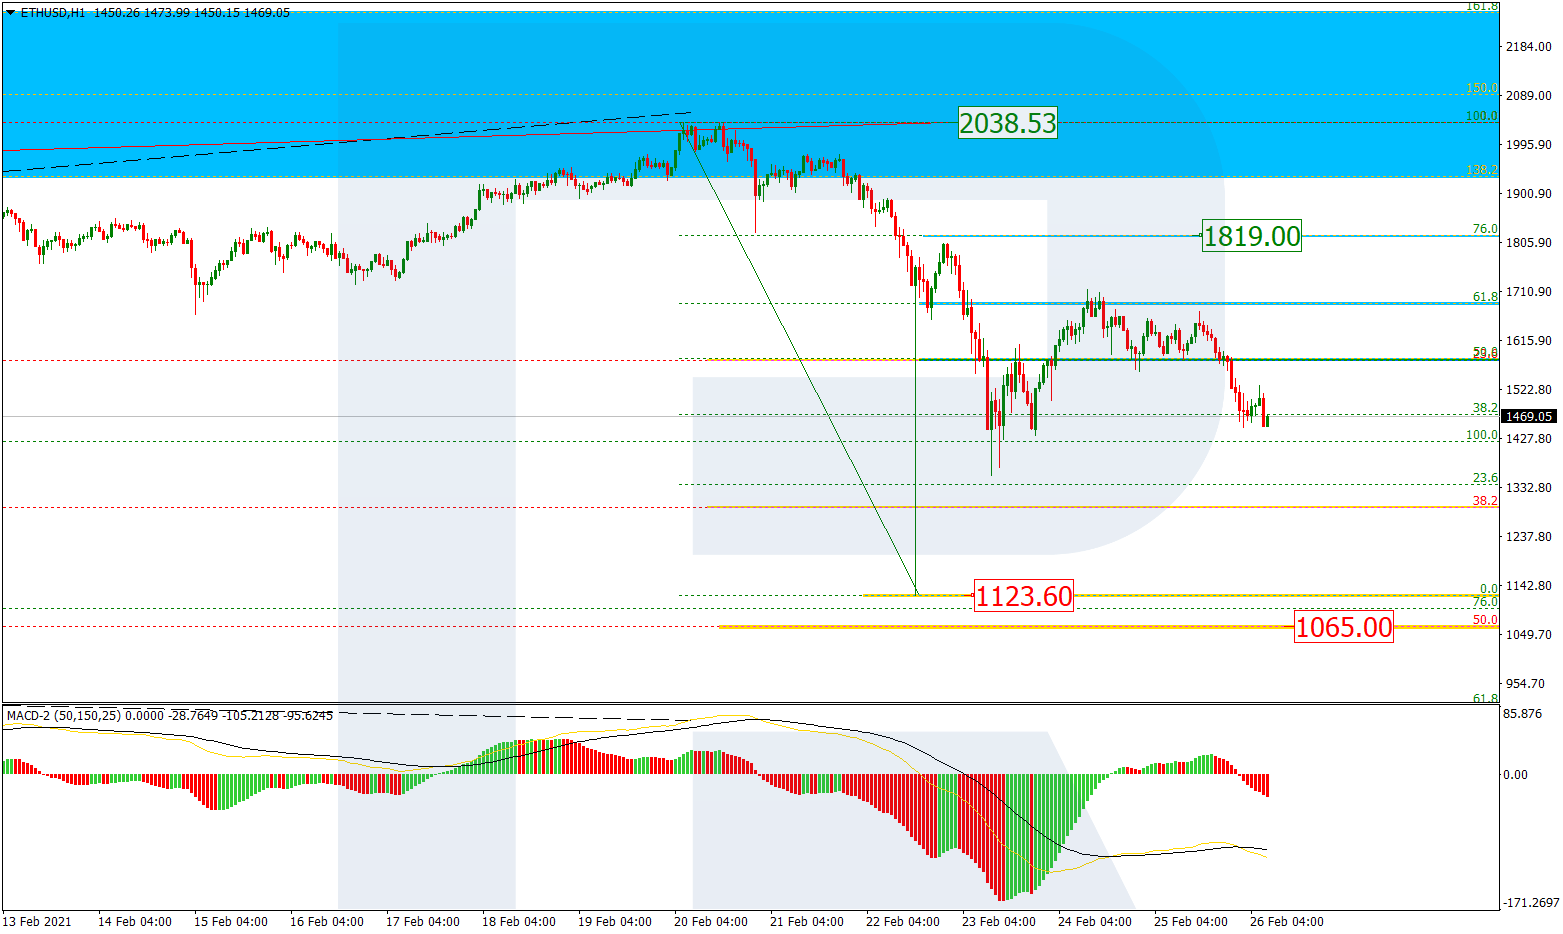
The H1 chart shows a more detailed structure of the current pullback after the descending impulse, which managed to reach 61.8% fibo but failed to get to 76.0% fibo at 1819.00. The next descending impulse may fall to break the low at 1123.60 and then reach 50.0% fibo at 1065.00.
Article By RoboForex.com
Attention!
Forecasts presented in this section only reflect the author’s private opinion and should not be considered as guidance for trading. RoboForex LP bears no responsibility for trading results based on trading recommendations described in these analytical reviews.

- Geopolitical and macroeconomic conditions continue to pressure market sentiment Jul 20, 2026
- USD/JPY Poised to Continue Gains as Expensive Oil and Lack of Support Weigh on Yen Jul 20, 2026
- COT Metals Charts: Weekly Speculator Bets led by Copper & Steel Jul 18, 2026
- COT Bonds Charts: Weekly Speculator Bets led by 2-Year, SOFR 3M & 5-Year Bonds Jul 18, 2026
- COT Energy Charts: Weekly Speculator Bets led by Brent Oil & Heating Oil Jul 18, 2026
- COT Soft Commodities Charts: Weekly Speculator Bets led by Wheat, Corn & Soybean Meal Jul 18, 2026
- The Bank of Canada kept its interest rate unchanged. Platinum prices reached a three‑week high Jul 16, 2026
- Stock indices rose after the release of US inflation data. China’s GDP slowed sharply Jul 15, 2026
- GBP/USD Awaits Political News: What Will Happen Next Jul 15, 2026
- USD/JPY Holds at Highs: Pressure Lingers on Yen Jul 14, 2026