
By CountingPips.com – Receive our weekly COT Reports by Email
Here are the latest charts and statistics for the Commitment of Traders (COT) data published by the Commodities Futures Trading Commission (CFTC).
The latest COT data is updated through Tuesday February 16 2021 and shows a quick view of how large traders (for-profit speculators and commercial entities) were positioned in the futures markets.
30-Day Federal Funds:
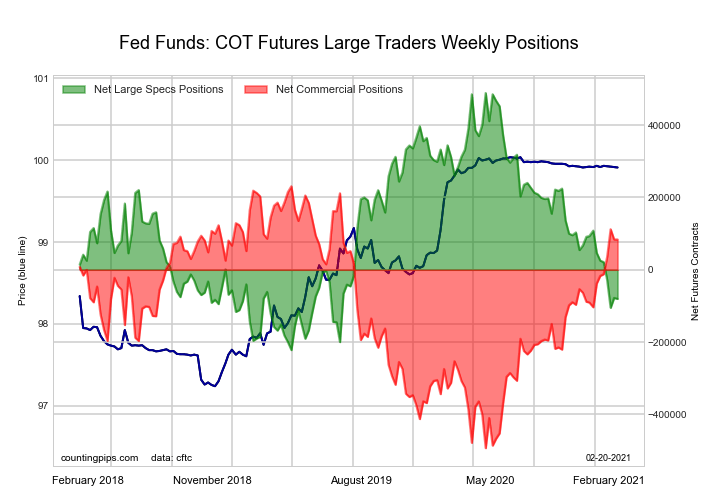
| 30-Day Federal Funds Statistics | SPECULATORS | COMMERCIALS | SMALL TRADERS |
| – Percent of Open Interest Longs: | 11.8 | 69.6 | 1.6 |
| – Percent of Open Interest Shorts: | 18.8 | 62.3 | 1.9 |
| – Net Position: | -80,391 | 83,820 | -3,429 |
| – Gross Longs: | 136,008 | 799,270 | 18,550 |
| – Gross Shorts: | 216,399 | 715,450 | 21,979 |
| – Long to Short Ratio: | 0.6 to 1 | 1.1 to 1 | 0.8 to 1 |
| NET POSITION TREND: | |||
| – COT Index Score (3 Year Range Pct): | 19.9 | 79.7 | 64.9 |
| – COT Index Reading (3 Year Range): | Bearish-Extreme | Bullish | Bullish |
| NET POSITION MOVEMENT INDEX: | |||
| – 6-Week Change in Strength Index: | -17.9 | 16.8 | 9.8 |
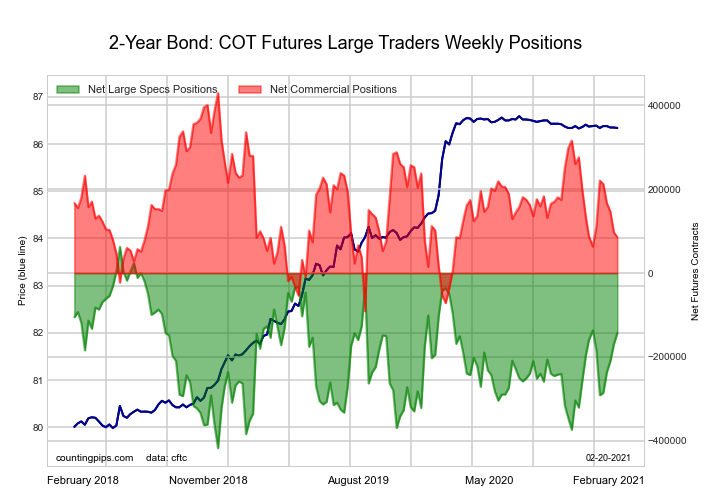
2-Year Treasury Note:
Free Reports:
 Get our Weekly Commitment of Traders Reports - See where the biggest traders (Hedge Funds and Commercial Hedgers) are positioned in the futures markets on a weekly basis.
 Sign Up for Our Stock Market Newsletter – Get updated on News, Charts & Rankings of Public Companies when you join our Stocks Newsletter
| 2-Year Treasury Note Statistics | SPECULATORS | COMMERCIALS | SMALL TRADERS |
| – Percent of Open Interest Longs: | 22.1 | 67.6 | 7.1 |
| – Percent of Open Interest Shorts: | 28.2 | 64.0 | 4.6 |
| – Net Position: | -142,489 | 85,740 | 56,749 |
| – Gross Longs: | 518,150 | 1,584,929 | 165,585 |
| – Gross Shorts: | 660,639 | 1,499,189 | 108,836 |
| – Long to Short Ratio: | 0.8 to 1 | 1.1 to 1 | 1.5 to 1 |
| NET POSITION TREND: | |||
| – COT Index Score (3 Year Range Pct): | 57.2 | 33.9 | 64.8 |
| – COT Index Reading (3 Year Range): | Bullish | Bearish | Bullish |
| NET POSITION MOVEMENT INDEX: | |||
| – 6-Week Change in Strength Index: | 8.6 | -4.8 | -8.7 |
5-Year Treasury Note:
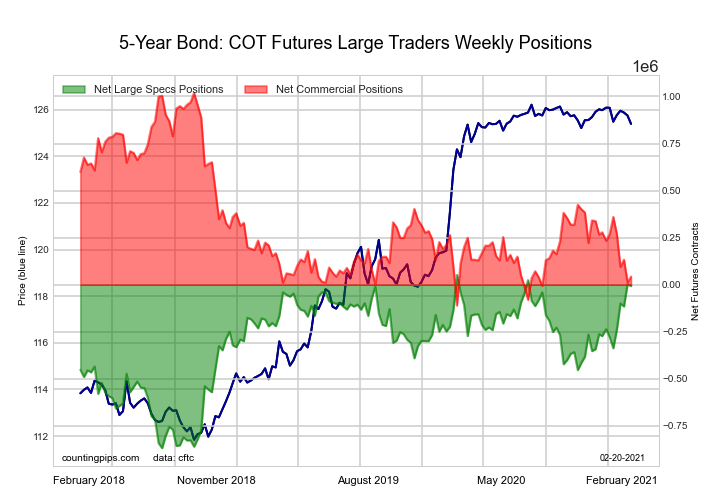
| 5-Year Treasury Note Statistics | SPECULATORS | COMMERCIALS | SMALL TRADERS |
| – Percent of Open Interest Longs: | 22.5 | 66.6 | 8.3 |
| – Percent of Open Interest Shorts: | 22.7 | 65.4 | 9.4 |
| – Net Position: | -6,152 | 43,260 | -37,108 |
| – Gross Longs: | 793,241 | 2,345,137 | 292,707 |
| – Gross Shorts: | 799,393 | 2,301,877 | 329,815 |
| – Long to Short Ratio: | 1.0 to 1 | 1.0 to 1 | 0.9 to 1 |
| NET POSITION TREND: | |||
| – COT Index Score (3 Year Range Pct): | 93.7 | 13.6 | 60.2 |
| – COT Index Reading (3 Year Range): | Bullish-Extreme | Bearish-Extreme | Bullish |
| NET POSITION MOVEMENT INDEX: | |||
| – 6-Week Change in Strength Index: | 29.8 | -20.1 | -17.3 |
10-Year Treasury Note:
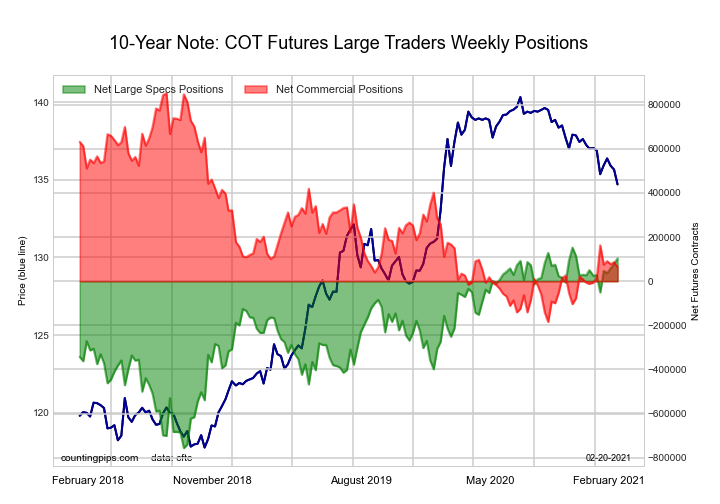
| 10-Year Treasury Note Statistics | SPECULATORS | COMMERCIALS | SMALL TRADERS |
| – Percent of Open Interest Longs: | 17.9 | 69.3 | 9.5 |
| – Percent of Open Interest Shorts: | 15.0 | 67.5 | 14.2 |
| – Net Position: | 103,413 | 64,055 | -167,468 |
| – Gross Longs: | 645,250 | 2,498,104 | 343,023 |
| – Gross Shorts: | 541,837 | 2,434,049 | 510,491 |
| – Long to Short Ratio: | 1.2 to 1 | 1.0 to 1 | 0.7 to 1 |
| NET POSITION TREND: | |||
| – COT Index Score (3 Year Range Pct): | 94.6 | 23.9 | 31.9 |
| – COT Index Reading (3 Year Range): | Bullish-Extreme | Bearish | Bearish |
| NET POSITION MOVEMENT INDEX: | |||
| – 6-Week Change in Strength Index: | 8.3 | 4.8 | -32.9 |
Ultra 10-Year Notes:
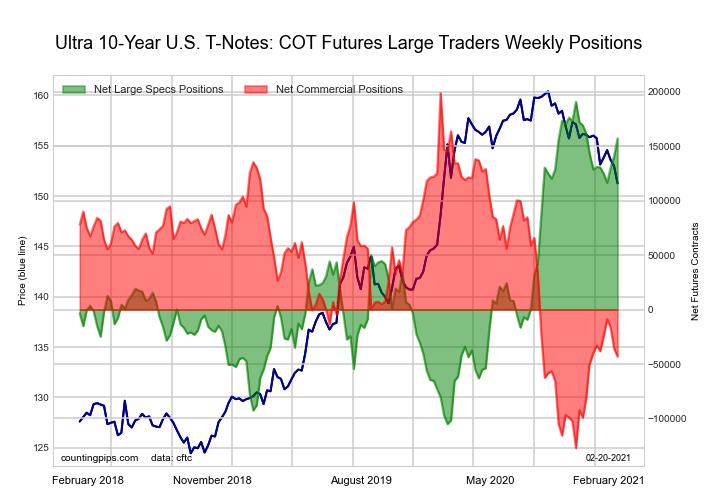
| Ultra 10-Year Notes Statistics | SPECULATORS | COMMERCIALS | SMALL TRADERS |
| – Percent of Open Interest Longs: | 19.1 | 69.5 | 9.0 |
| – Percent of Open Interest Shorts: | 6.6 | 72.9 | 18.1 |
| – Net Position: | 157,117 | -43,013 | -114,104 |
| – Gross Longs: | 239,996 | 872,832 | 113,410 |
| – Gross Shorts: | 82,879 | 915,845 | 227,514 |
| – Long to Short Ratio: | 2.9 to 1 | 1.0 to 1 | 0.5 to 1 |
| NET POSITION TREND: | |||
| – COT Index Score (3 Year Range Pct): | 88.7 | 25.8 | 4.6 |
| – COT Index Reading (3 Year Range): | Bullish-Extreme | Bearish | Bearish-Extreme |
| NET POSITION MOVEMENT INDEX: | |||
| – 6-Week Change in Strength Index: | 8.8 | -3.1 | -17.3 |
US Treasury Bonds:
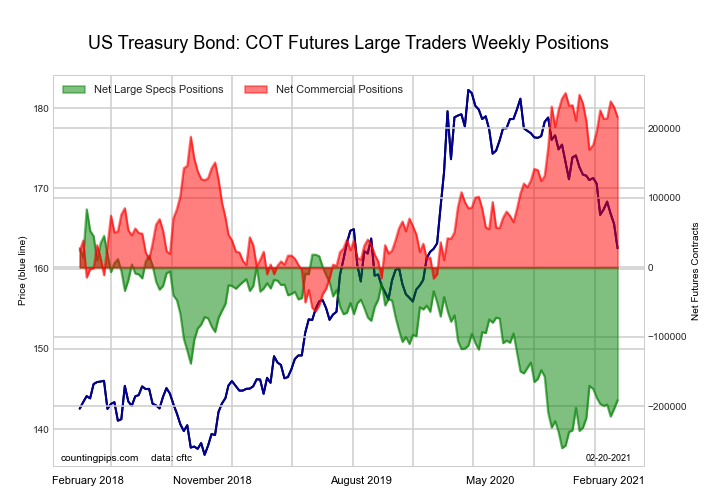
| US Treasury Bonds Statistics | SPECULATORS | COMMERCIALS | SMALL TRADERS |
| – Percent of Open Interest Longs: | 8.4 | 75.9 | 12.7 |
| – Percent of Open Interest Shorts: | 24.2 | 58.0 | 14.8 |
| – Net Position: | -191,002 | 215,916 | -24,914 |
| – Gross Longs: | 101,705 | 916,697 | 153,685 |
| – Gross Shorts: | 292,707 | 700,781 | 178,599 |
| – Long to Short Ratio: | 0.3 to 1 | 1.3 to 1 | 0.9 to 1 |
| NET POSITION TREND: | |||
| – COT Index Score (3 Year Range Pct): | 20.1 | 88.9 | 35.2 |
| – COT Index Reading (3 Year Range): | Bearish | Bullish-Extreme | Bearish |
| NET POSITION MOVEMENT INDEX: | |||
| – 6-Week Change in Strength Index: | -1.0 | 6.4 | -12.8 |
Ultra US Treasury Bonds:

| Ultra US Treasury Bonds Statistics | SPECULATORS | COMMERCIALS | SMALL TRADERS |
| – Percent of Open Interest Longs: | 8.1 | 77.7 | 12.9 |
| – Percent of Open Interest Shorts: | 28.5 | 56.7 | 13.6 |
| – Net Position: | -229,297 | 237,111 | -7,814 |
| – Gross Longs: | 91,785 | 875,369 | 144,842 |
| – Gross Shorts: | 321,082 | 638,258 | 152,656 |
| – Long to Short Ratio: | 0.3 to 1 | 1.4 to 1 | 0.9 to 1 |
| NET POSITION TREND: | |||
| – COT Index Score (3 Year Range Pct): | 73.3 | 44.0 | 6.5 |
| – COT Index Reading (3 Year Range): | Bullish | Bearish | Bearish-Extreme |
| NET POSITION MOVEMENT INDEX: | |||
| – 6-Week Change in Strength Index: | 1.6 | -4.9 | 6.5 |
3-Month Eurodollars:
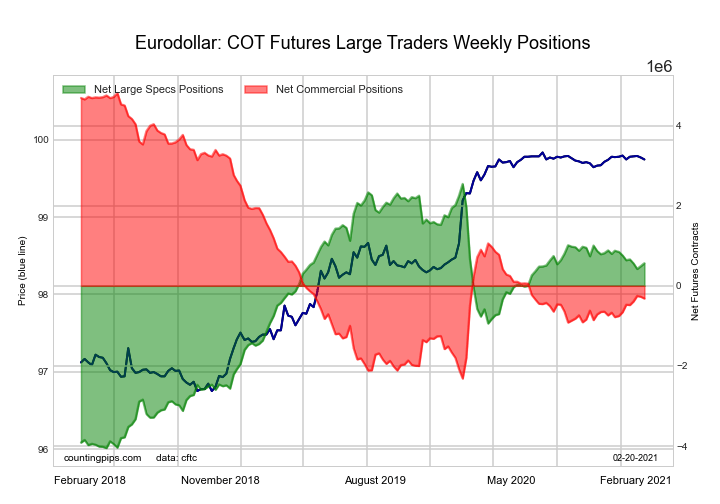
| 3-Month Eurodollars Statistics | SPECULATORS | COMMERCIALS | SMALL TRADERS |
| – Percent of Open Interest Longs: | 18.3 | 48.9 | 5.2 |
| – Percent of Open Interest Shorts: | 13.4 | 51.7 | 7.3 |
| – Net Position: | 563,386 | -317,754 | -245,632 |
| – Gross Longs: | 2,087,589 | 5,566,009 | 586,384 |
| – Gross Shorts: | 1,524,203 | 5,883,763 | 832,016 |
| – Long to Short Ratio: | 1.4 to 1 | 0.9 to 1 | 0.7 to 1 |
| NET POSITION TREND: | |||
| – COT Index Score (3 Year Range Pct): | 70.0 | 28.0 | 71.3 |
| – COT Index Reading (3 Year Range): | Bullish | Bearish | Bullish |
| NET POSITION MOVEMENT INDEX: | |||
| – 6-Week Change in Strength Index: | -2.9 | 4.8 | -18.7 |
Article By CountingPips.com – Receive our weekly COT Reports by Email
*COT Report: The COT data, released weekly to the public each Friday, is updated through the most recent Tuesday (data is 3 days old) and shows a quick view of how large speculators or non-commercials (for-profit traders) were positioned in the futures markets.
The CFTC categorizes trader positions according to commercial hedgers (traders who use futures contracts for hedging as part of the business), non-commercials (large traders who speculate to realize trading profits) and nonreportable traders (usually small traders/speculators).
Find CFTC criteria here: (http://www.cftc.gov/MarketReports/CommitmentsofTraders/ExplanatoryNotes/index.htm).

- The Bank of Canada kept its interest rate unchanged. Platinum prices reached a three‑week high Jul 16, 2026
- Stock indices rose after the release of US inflation data. China’s GDP slowed sharply Jul 15, 2026
- GBP/USD Awaits Political News: What Will Happen Next Jul 15, 2026
- USD/JPY Holds at Highs: Pressure Lingers on Yen Jul 14, 2026
- Oil prices jumped 4% amid a new wave of escalation between the US and Iran Jul 13, 2026
- EUR/USD: US Inflation Will Determine Everything Jul 13, 2026
- COT Metals Charts: Weekly Speculator Bets see small gains for Silver & Gold Jul 12, 2026
- COT Bonds Charts: Speculator Bets led by SOFR 3-Months & 2-Year Bonds Jul 12, 2026
- COT Energy Charts: Weekly Speculator Changes led by Brent Oil Jul 12, 2026
- COT Soft Commodities Charts: Weekly Speculator Changes led by Sugar, Corn & Soybeans Jul 12, 2026