
Article By RoboForex.com
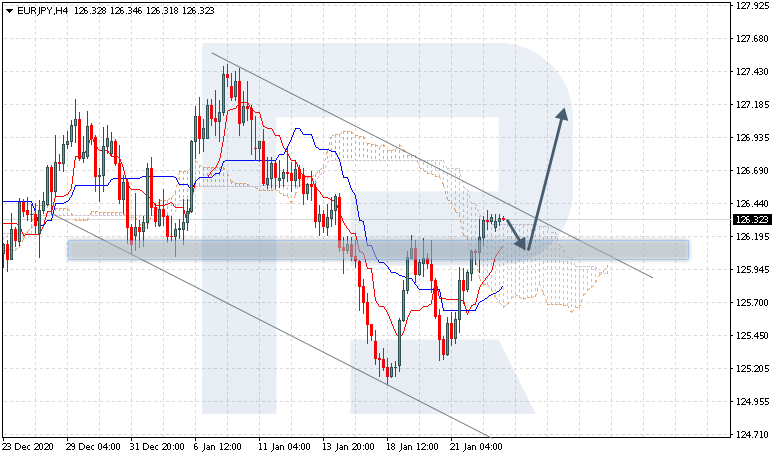
EURJPY, “Euro vs Japanese Yen”
EURJPY is trading at 126.32; the instrument is moving above Ichimoku Cloud, thus indicating an ascending tendency. The markets could indicate that the price may test Tenkan-Sen and Kijun-Sen at 126.05 and then resume moving upwards to reach 127.20. Another signal in favor of a further uptrend will be a rebound from the support level. However, the bullish scenario may no longer be valid if the price breaks the cloud’s downside border and fixes below 125.45. In this case, the pair may continue falling towards 124.55. To confirm further growth, the asset must break the descending channel’s upside border and fix above 126.55.

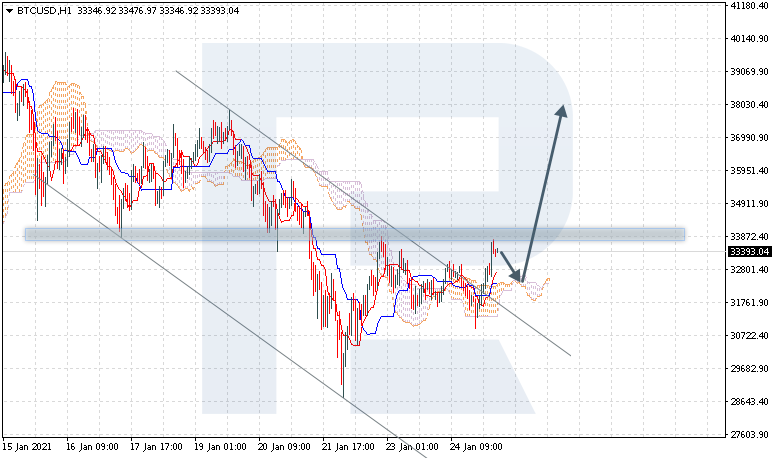
BTCUSD, “Bitcoin vs US Dollar”
BTCUSD is trading at 33393.00; the instrument is moving above Ichimoku Cloud, thus indicating an ascending tendency. The markets could indicate that the price may test the cloud’s upside border at 32625.00 and then resume moving upwards to reach 38030.00. Another signal in favor of a further uptrend will be a rebound from the descending channel’s upside border. However, the bullish scenario may no longer be valid if the price breaks the cloud’s downside border and fixes below 30705.00. In this case, the pair may continue falling towards 28645.00. To confirm further growth, the asset must break the resistance area and fix above 34005.00.
Free Reports:
 Download Our Metatrader 4 Indicators – Put Our Free MetaTrader 4 Custom Indicators on your charts when you join our Weekly Newsletter
 Get our Weekly Commitment of Traders Reports - See where the biggest traders (Hedge Funds and Commercial Hedgers) are positioned in the futures markets on a weekly basis.
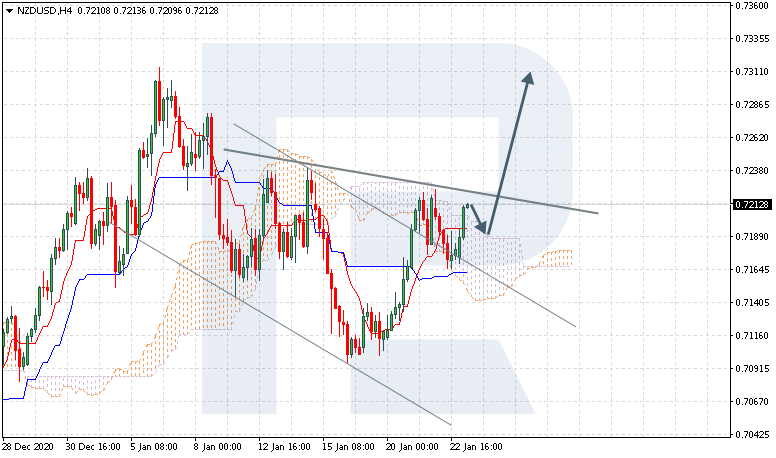
NZDUSD, “New Zealand Dollar vs US Dollar”
NZDUSD is trading at 0.7212; the instrument is moving above Ichimoku Cloud, thus indicating an ascending tendency. The markets could indicate that the price may test the cloud’s upside border at 0.7195 and then resume moving upwards to reach 0.7315. Another signal in favor of a further uptrend will be a rebound from the descending channel’s upside border. However, the bullish scenario may be canceled if the price breaks the cloud’s downside border and fixes below 0.7125. In this case, the pair may continue falling towards 0.7035. To confirm further growth, the asset must break the resistance area and fix above 0.7245, thus indicating the completion of an Upside-Down Head & Shoulders reversal pattern.
Article By RoboForex.com
Attention!
Forecasts presented in this section only reflect the author’s private opinion and should not be considered as guidance for trading. RoboForex LP bears no responsibility for trading results based on trading recommendations described in these analytical reviews.

- Iran wants to maintain the blockade of the Strait of Hormuz until the United States closes all its bases in the Middle East Mar 13, 2026
- USD/JPY at Highest Since July 2024: Market Awaits BoJ Intervention Mar 13, 2026
- Oil continues to rise despite record strategic reserve releases by the IEA Mar 12, 2026
- Gold Moderately Lower as Market Pressures Intensify Mar 12, 2026
- IEA deploys strategic reserves to halt soaring oil prices Mar 11, 2026
- GBP/USD Managed to Rise, but Pressure Factors Remain in Place Mar 11, 2026
- Trump signals de-escalation in the Middle East; China’s trade surplus hits a new record Mar 10, 2026
- EUR/USD in Turbulence: Market Questions When Conflict Over Iran Will End Mar 10, 2026
- Prices push oil above $100 per barrel Mar 9, 2026
- COT Metals Charts: Speculator Bets led by Silver, Gold & Platinum Mar 7, 2026