
Article By RoboForex.com
XAUUSD, “Gold vs US Dollar”
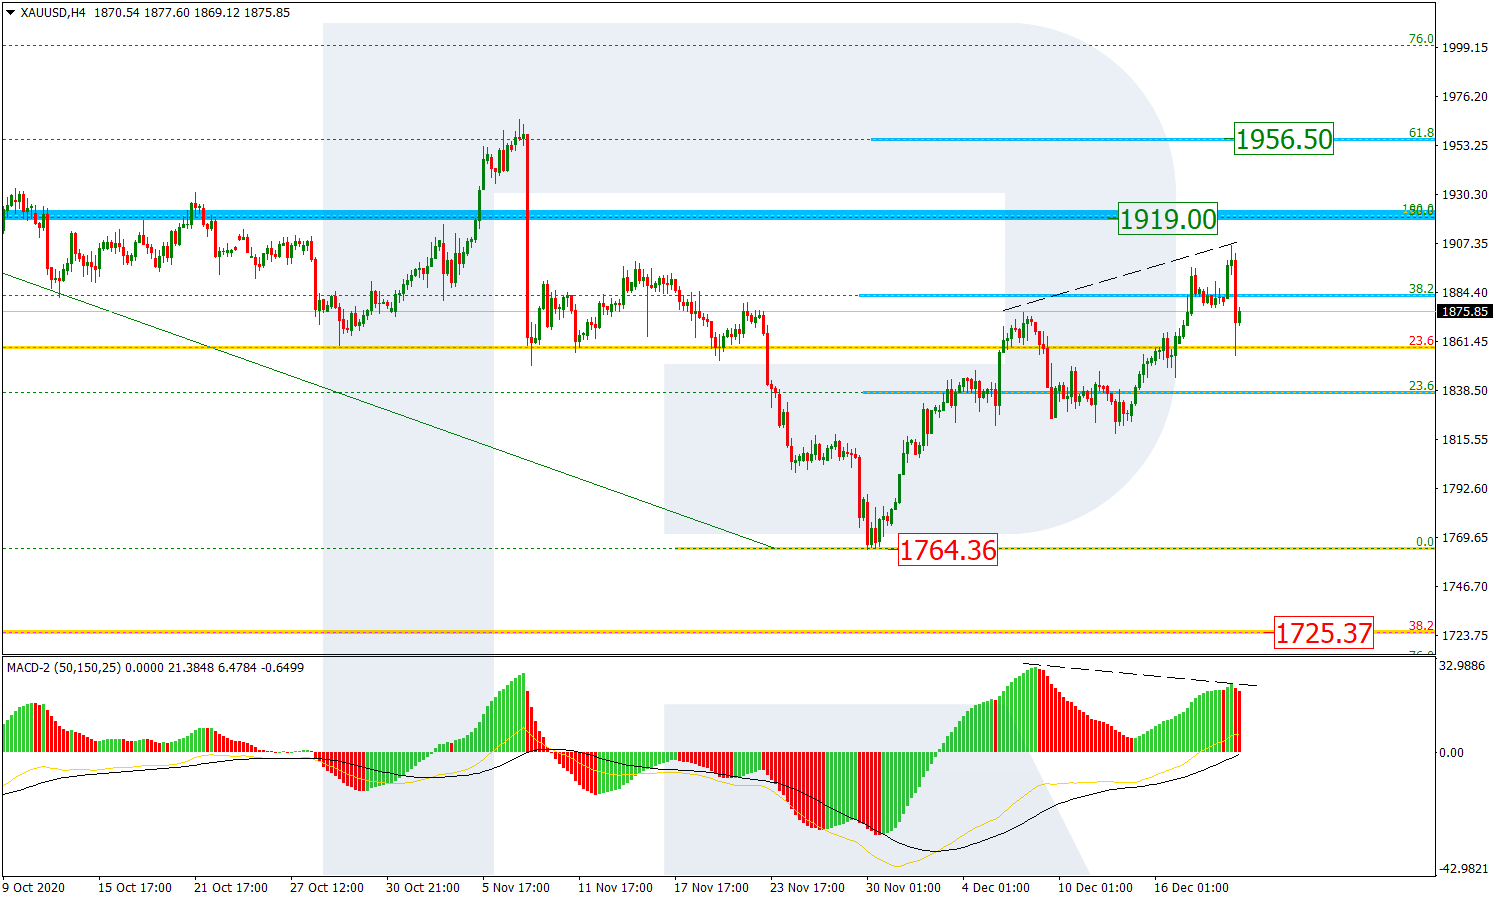
As we can see in the H4 chart, after updating the previous local high and breaking 38.2% fibo, XAUUSD couldn’t reach 50.0% fibo at 1919.00. At the same time, there was a divergence on MACD, which made the pair plunge. However, the asset may yet start a new rising impulse to reach a more significant target, 61.8% fibo at 1956.50. On the other hand, if the instrument continues falling and breaks the low at 1764.36, it will continue falling to reach its mid-term target at 38.2% fibo at 1725.37.

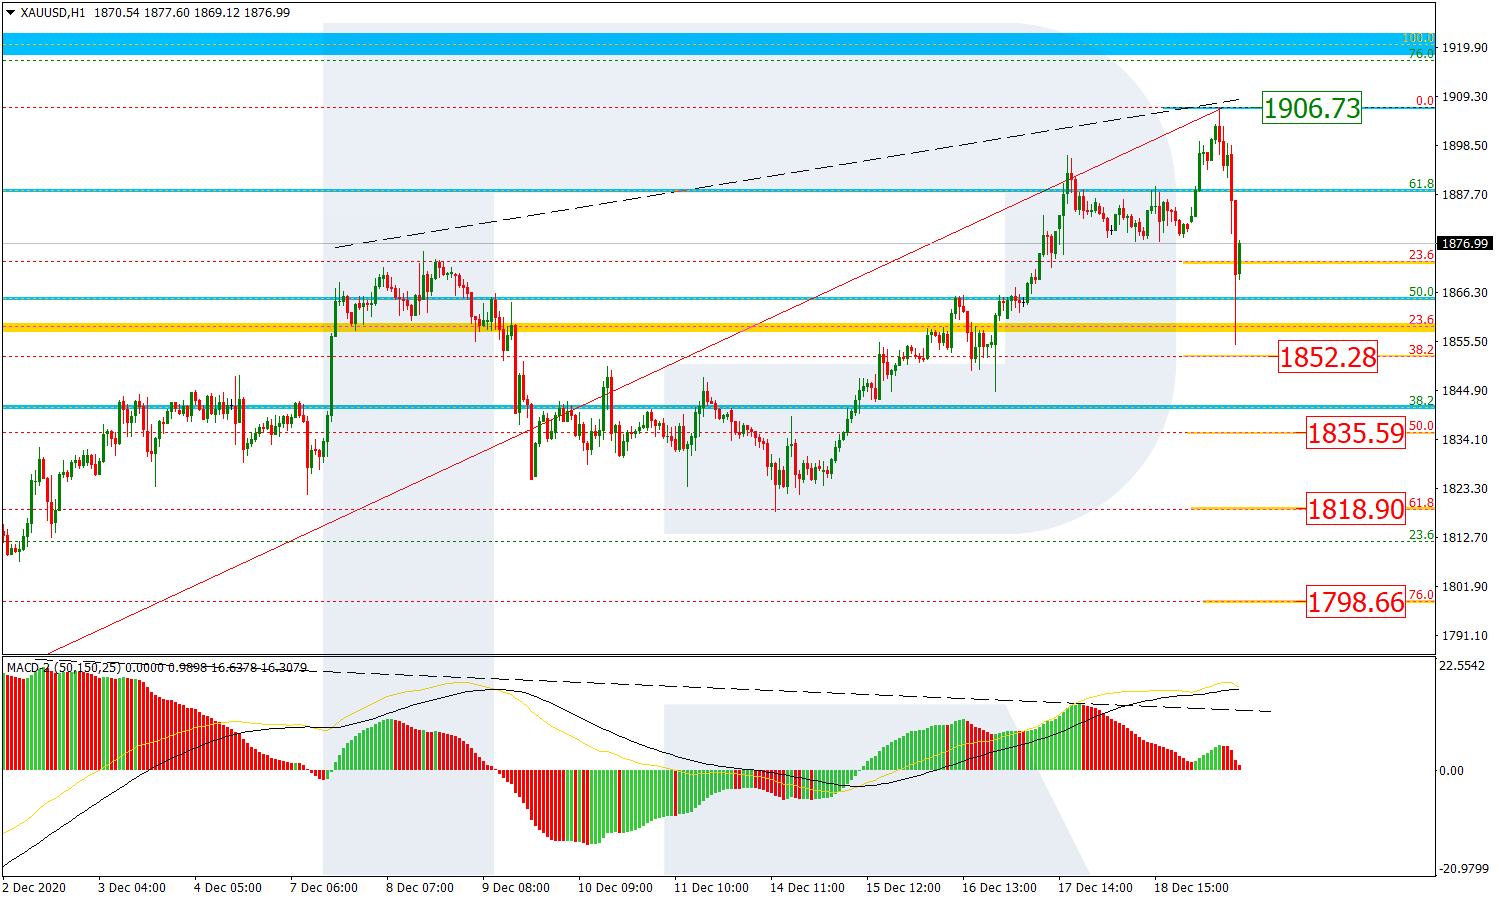
The H1 chart shows a more detailed structure of the current descending tendency after a divergence on MACD. By now, it has already broken 23.6% fibo and may later continue towards 38.2%, 50.0%, 61.8%, and 76.0% fibo at 1852.28, 1835.59, 1818.90, and 1798.66 respectively. However, a breakout of the local high at 1906.73 will result in further trend to the upside.
Free Reports:
 Get our Weekly Commitment of Traders Reports - See where the biggest traders (Hedge Funds and Commercial Hedgers) are positioned in the futures markets on a weekly basis.
 Download Our Metatrader 4 Indicators – Put Our Free MetaTrader 4 Custom Indicators on your charts when you join our Weekly Newsletter
USDCHF, “US Dollar vs Swiss Franc”
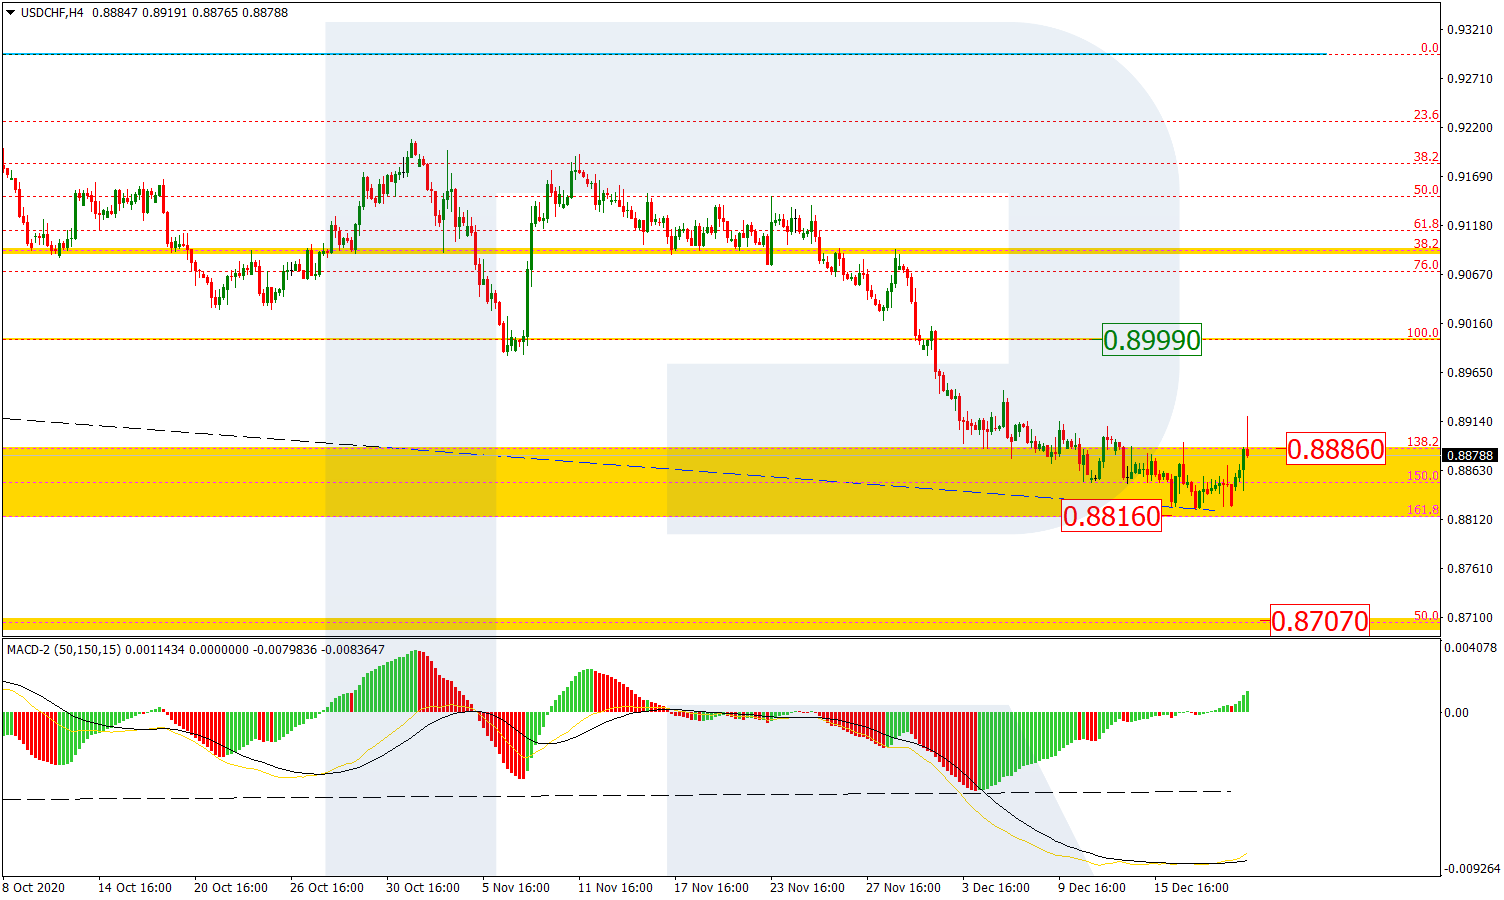
As we can see in the H4 chart, after testing the post-correctional extension area between 138.2% and 161.8% fibo at 0.8886 and 0.8816 respectively, USDCHF has started a new correction towards the resistance area at 0.8999 because of the long-term convergence on MACD. After completing the correction, the asset may start another descending wave; the downside target is the long-term 50.0% fibo at 0.8707.
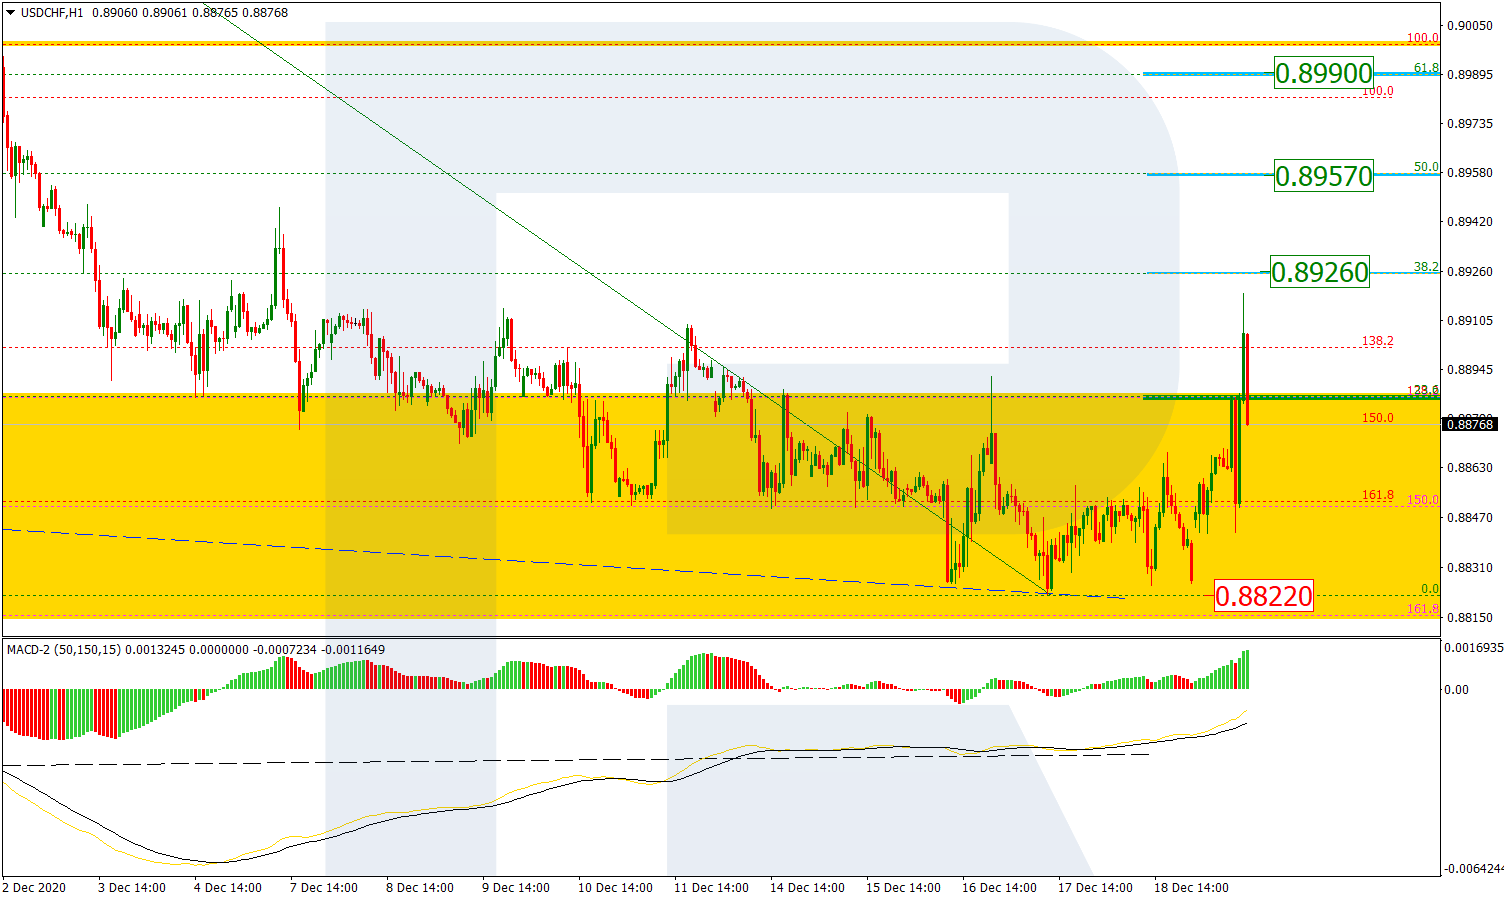
In the H1 chart, after breaking 236% fibo, the pair is still moving upwards to reach 38.2% fibo at 0.8926. Later, the market may continue growing towards 50.0% and 61.8% fibo at 0.8957 and 0.8990 respectively. A breakout of the support at 0.8822 will complete this local correction and result in further mid-term downtrend.
Article By RoboForex.com
Attention!
Forecasts presented in this section only reflect the author’s private opinion and should not be considered as guidance for trading. RoboForex LP bears no responsibility for trading results based on trading recommendations described in these analytical reviews.

- The US and European stock indices are rising again amid renewed investor interest in the AI industry. Jul 10, 2026
- USD/JPY Falls as Yen Recovers Weekly Losses Jul 10, 2026
- Crude oil prices surged sharply by 7% in reaction to the rapid escalation of the conflict in the Middle East Jul 9, 2026
- Middle East Tensions Weigh on Gold Jul 9, 2026
- Pound Awaits Tighter Policy from Bank of England Jul 8, 2026
- The United States carried out airstrikes on Iran after Iran’s attacked tankers in the Strait of Hormuz. The RBNZ raised the interest rate to 2.5% Jul 8, 2026
- RoboForex Brings Full-Scale Trading to Telegram Jul 7, 2026
- Your Bourse Integrates TradingView Charts and Trading Platform Library with Trade Server Jul 7, 2026
- Yen Still Under Pressure: Markets Await Action from Authorities Jul 7, 2026
- Germany’s DAX Index has updated its all‑time high. OPEC+ countries have agreed to increase production Jul 7, 2026