
Article By RoboForex.com
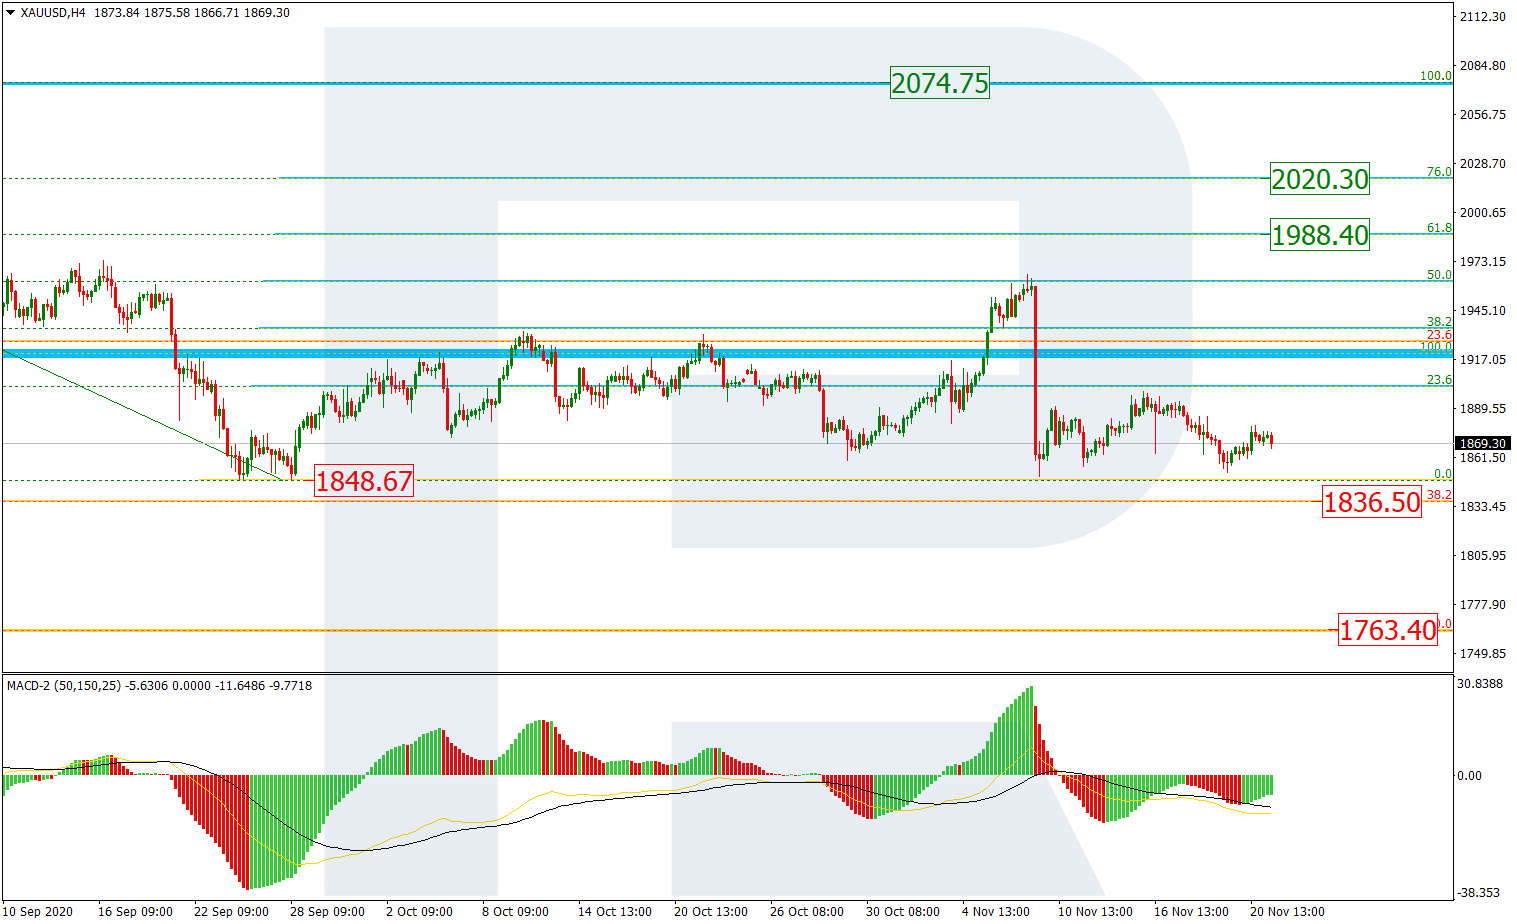
XAUUSD, “Gold vs US Dollar”
As we can see in the H4 chart, after finishing the correctional uptrend at 50.0% fibo, XAUUSD has formed the descending impulse to test the low at 1848.67. One should also note that after completing the descending impulse, the price is correcting within the sideways channel, thus implying further decline after a breakout of the low. The next downside targets may be 38.2% and 50.0% fibo at 1836.50 and 1736.40 respectively.

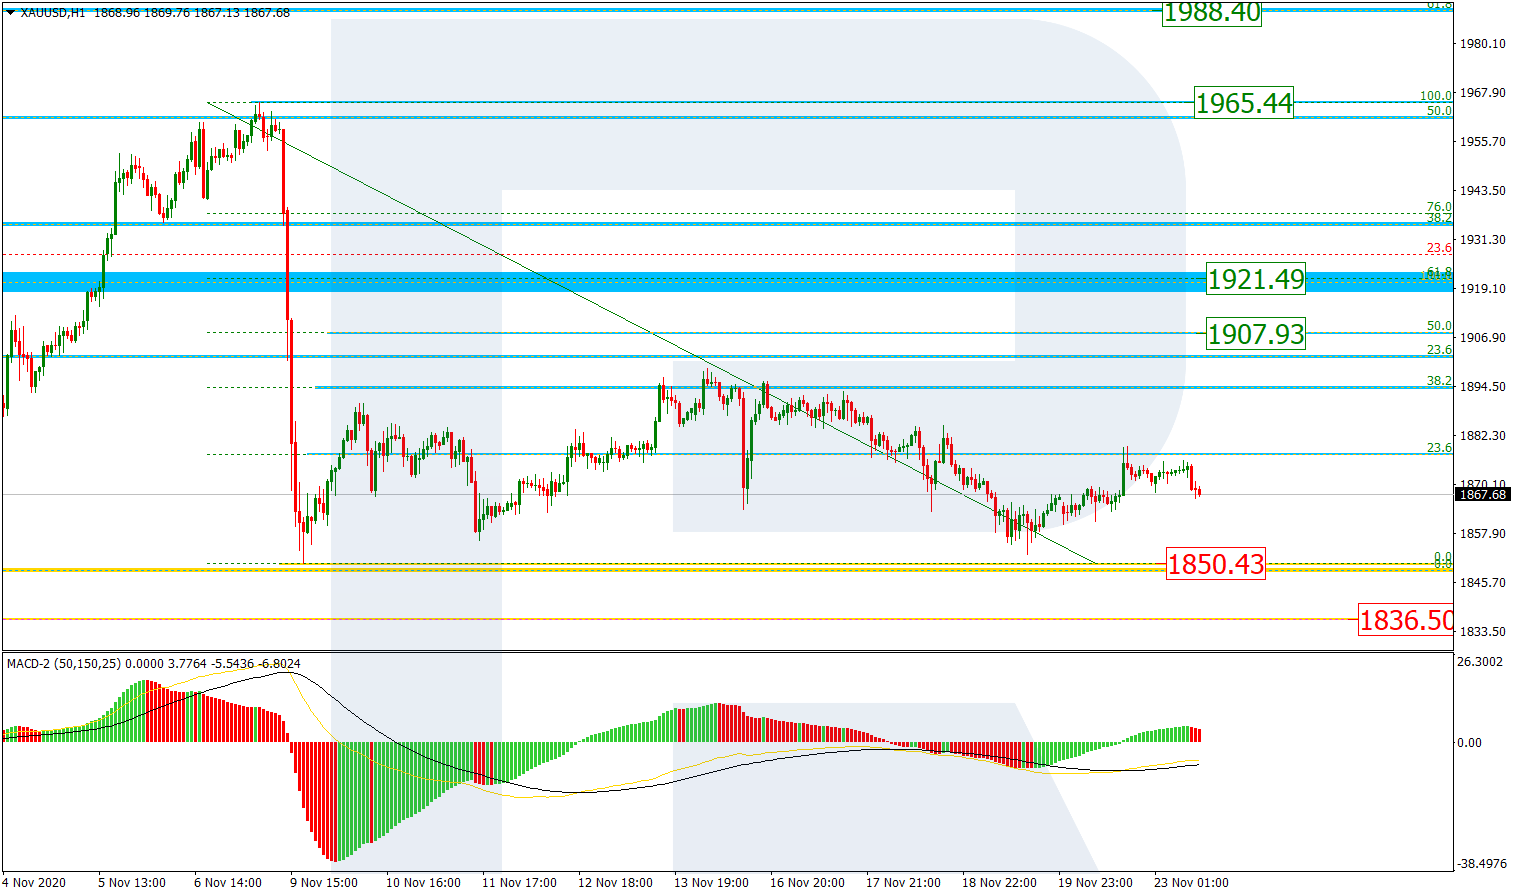
The H1 chart shows a more detailed structure of the current correction after the descending impulse, which has reached 38.2% fibo. However, the current descending wave is trying to re-test the local low at 1850.43. Possibly, the asset may yet from another rising wave towards 50.0% and 61.8% fibo at 1907.93 and 1921.49 respectively but a breakout of the low remains a more probable scenario.
Free Reports:
 Download Our Metatrader 4 Indicators – Put Our Free MetaTrader 4 Custom Indicators on your charts when you join our Weekly Newsletter
 Get our Weekly Commitment of Traders Reports - See where the biggest traders (Hedge Funds and Commercial Hedgers) are positioned in the futures markets on a weekly basis.
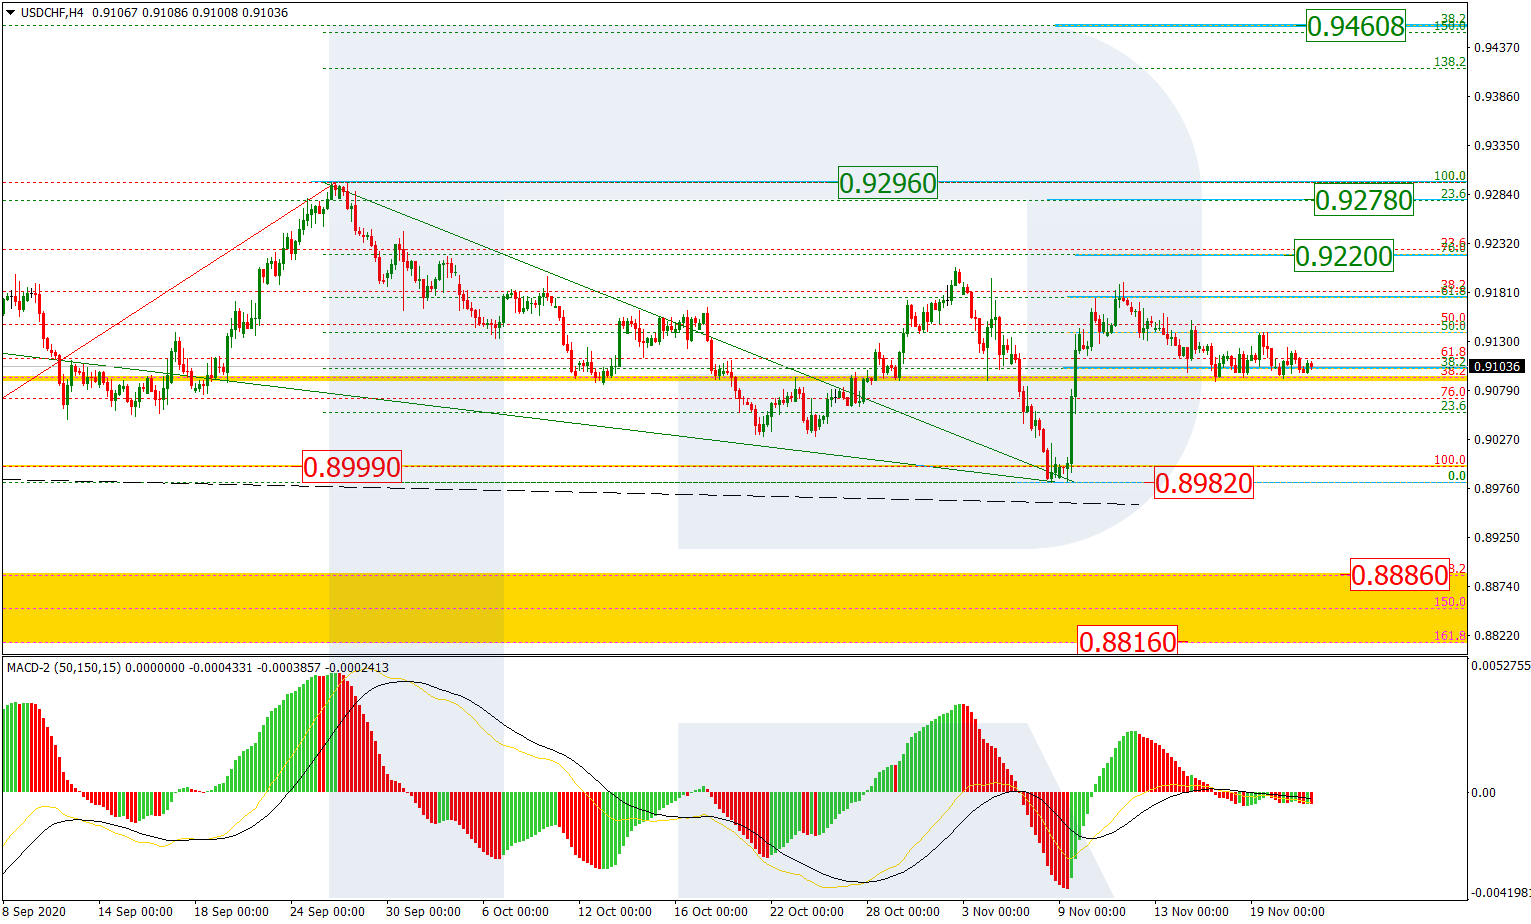
USDCHF, “US Dollar vs Swiss Franc”
As we can see in the H4 chart, USDCHF is starting a new mid-term growth after updating the low and a convergence on MACD. The closest upside targets may be 23.6% and 38.2% fibo at 0.9278 and 0.9460 respectively. However, to continue the uptrend the pair must break the local fractal high at 0.9296. On the other hand, if the asset breaks the low at 0.8982, it may enter the post-correctional extension area between 138.2% and 161.8% fibo at 0.8886 and 0.8816 respectively.
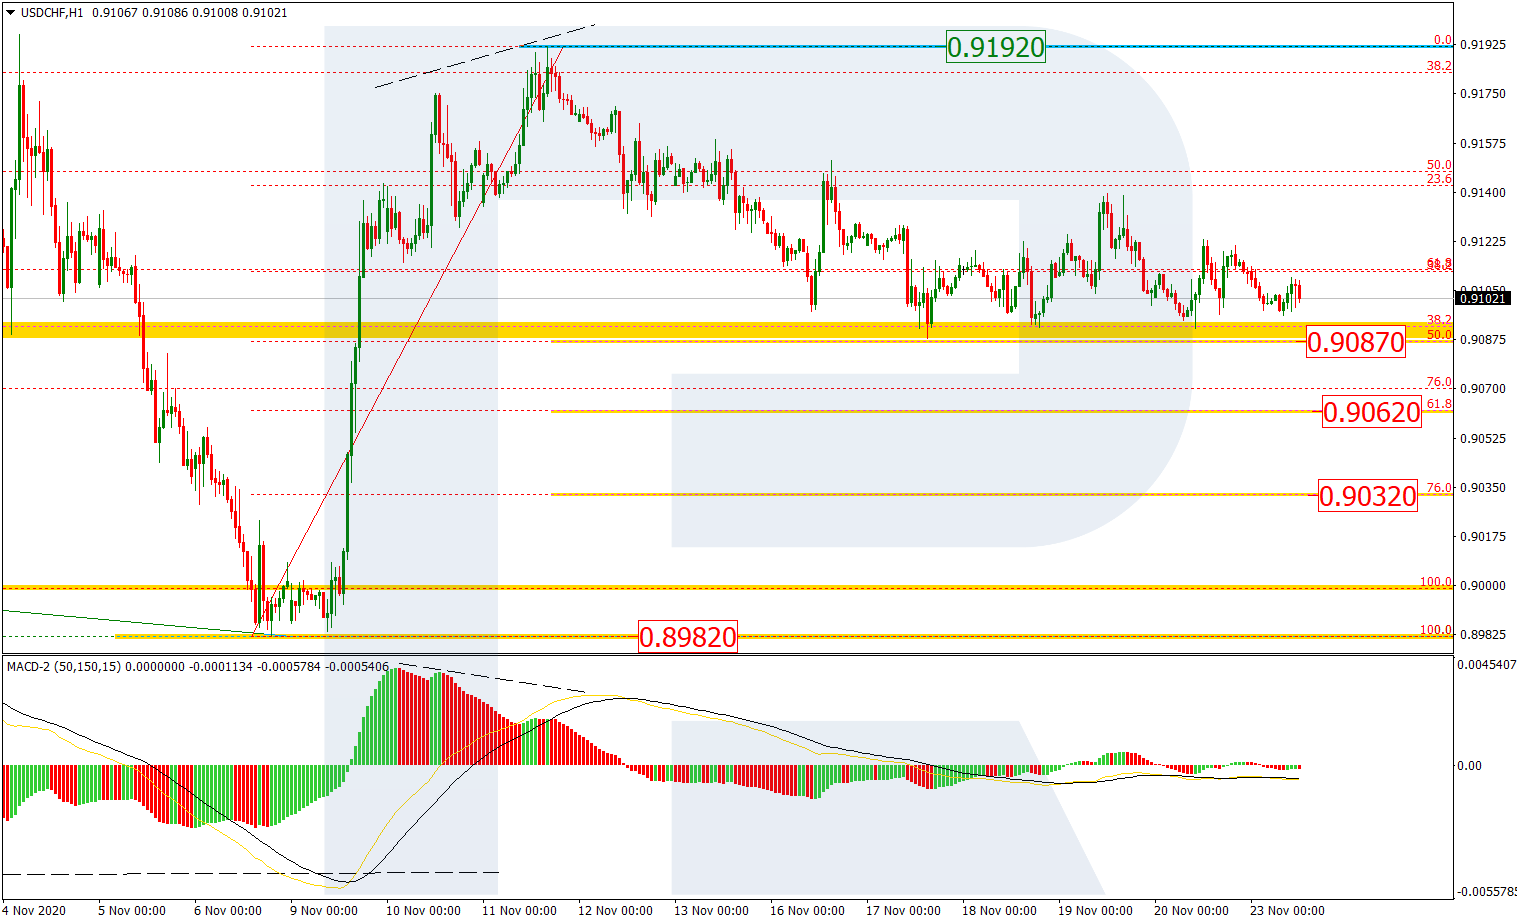
In the H1 chart, the pair is correcting downwards after a divergence on MACD, and has already reached 50.0% fibo at 0.9087 to test it. Later, the market may continue falling towards 61.8% and 76.0% fibo at 0.9062 and 0.9032 respectively. A breakout of the local high at 0.9192 will be signal the completion of this correction.
Article By RoboForex.com
Attention!
Forecasts presented in this section only reflect the author’s private opinion and should not be considered as guidance for trading. RoboForex LP bears no responsibility for trading results based on trading recommendations described in these analytical reviews.

- The US and European stock indices are rising again amid renewed investor interest in the AI industry. Jul 10, 2026
- USD/JPY Falls as Yen Recovers Weekly Losses Jul 10, 2026
- Crude oil prices surged sharply by 7% in reaction to the rapid escalation of the conflict in the Middle East Jul 9, 2026
- Middle East Tensions Weigh on Gold Jul 9, 2026
- Pound Awaits Tighter Policy from Bank of England Jul 8, 2026
- The United States carried out airstrikes on Iran after Iran’s attacked tankers in the Strait of Hormuz. The RBNZ raised the interest rate to 2.5% Jul 8, 2026
- RoboForex Brings Full-Scale Trading to Telegram Jul 7, 2026
- Your Bourse Integrates TradingView Charts and Trading Platform Library with Trade Server Jul 7, 2026
- Yen Still Under Pressure: Markets Await Action from Authorities Jul 7, 2026
- Germany’s DAX Index has updated its all‑time high. OPEC+ countries have agreed to increase production Jul 7, 2026