
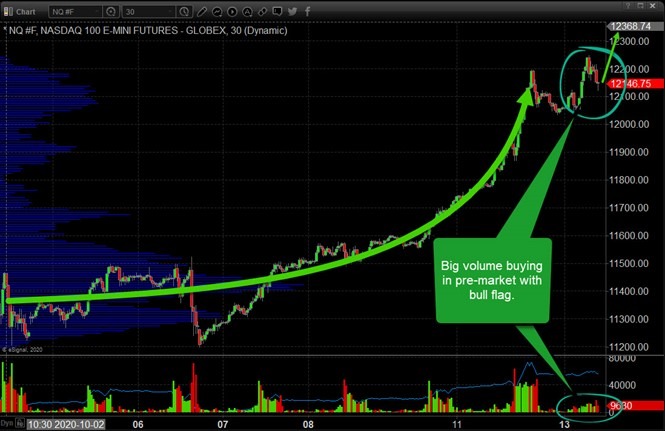
– Rather quickly in trading late Sunday night, the NQ (NASDAQ E-Mini Futures) began to move higher quite consistently. By the time the markets opened in London on Monday, the rally was ON. We believe this is related to two underlying factors:
A. Short positions were getting squeezed after the end of week rally in the markets last week. The upside price pressure early in trading on Sunday/Monday likely forced many of these shorts out of the market – creating a Short Squeeze.
B. Global traders may be interpreting a biased election victory by Donald Trump based on news events or other information. This close to an election and with pending Q3 earnings just days away, a melt-up rally like this is fairly uncommon – unless you take into consideration that global investors may be pre positioning for an expected outcome.
30 Minute Chart of Nasdaq Showing This Weeks Rally & Squeeze
Still, one can’t discount the upside move in the NQ today, as seen on this 30 minute chart (below). The rally started off moderately strong, then London opened Monday. After London opened, the momentum grew and price began to rally even higher. We believe this rally phase will abate after the momentum phase has pushed prices high enough to prompt some concerns. You can’t fight the squeeze when it happens, but you can’t chase it very long either.
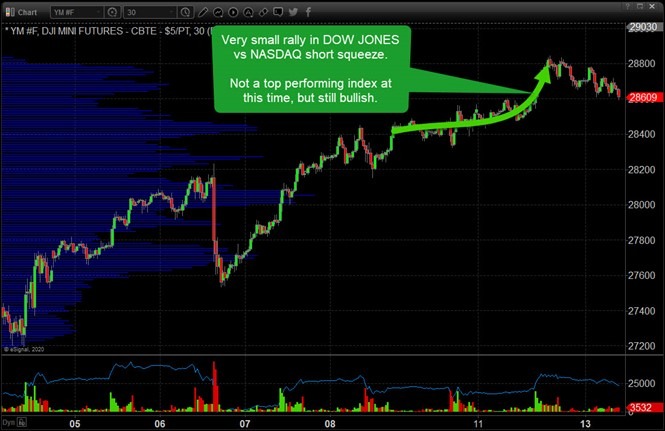
Dow Jones 30 Minute Rally, or Lack of Rally from Underperforming Sectors
The following YM (Dow Jones E-Mini Futures) chart, on the other hand, represented a very small rally phase compared to the NASDAQ. This suggests more interest was centered in the Technology and Healthcare sectors recently as traders attempted to scoop up Call Options ahead of earnings. The Dow Jones and the S&P 500 were still higher today, but these two major indexes were not included in the dynamic Short Squeeze like the NASDAQ was today.
Free Reports:
 Sign Up for Our Stock Market Newsletter – Get updated on News, Charts & Rankings of Public Companies when you join our Stocks Newsletter
 Get our Weekly Commitment of Traders Reports - See where the biggest traders (Hedge Funds and Commercial Hedgers) are positioned in the futures markets on a weekly basis.
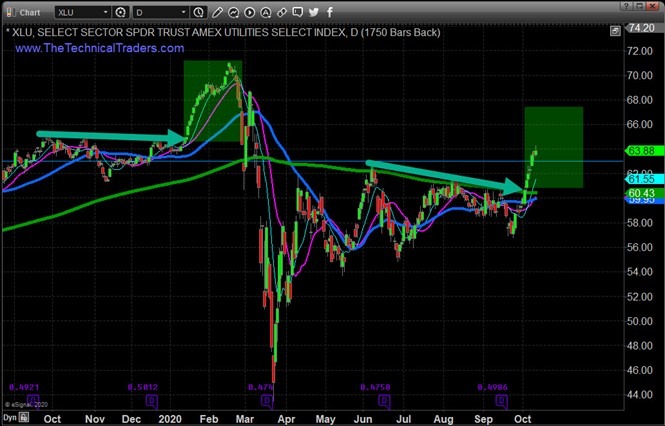
Daily Chart of Utility Sector Shows Signs of Leadership
If you take a look at the following Utilities Sector ETF (XLU) it is clear that in the past few weeks they are outperforming almost all other sectors. New multi-month highs, strong momentum, and this is what happens when investors start to become nervous. They buy defensive companies that will always be needed during a recession.
Take a look at what utilities did in Jan/Feb when investors started to get nervous about the economy/COVID. I look at utilities as one of the last moves before a market correction.
Our research continues to suggest we are still in a Bullish price trend. Our Super Cycles research and other predictive modeling system suggest volatility and risk factors are still very elevated. In other words, we believe the US market trends are biased to the upside right now and may break higher after the elections. We are also very cautious of election volatility and unknown factors such as earnings and other issues.
As of today, Tuesday, the NASDAQ is continuing higher as positive earnings start to hit the wires. Learn how our predictive modeling and other advanced trading technology can assist you in finding the best trades.
As a technical analyst and trader since 1997, I have been through a few bull/bear market cycles in stocks and commodities. I believe I have a good pulse on the market and timing key turning points for investing and short-term swing traders. Don’t miss all the incredible trends and trade setups.
If you want to learn how to become a better trader and investor, visit TheTechnicalTraders.com to learn how we can help you make money with our swing and investing signals.
Chris Vermeulen
Chief Market Strategies
Founder of Technical Traders Ltd.
NOTICE AND DISCLAIMER: Our free research does not constitute a trade recommendation or solicitation for our readers to take any action regarding this research. It is provided for educational purposes only to our subscribers and not intended to be acted upon. Read our FULL DISCLAIMER here.

- The Tech‑heavy NASDAQ Index jumped by more than 3.3%. The offshore yuan is trading at its highest level since 2023 Jul 31, 2026
- USD/JPY After Volatility: Multiple Events in One Day Jul 31, 2026
- The US indices sell off amid renewed US-Iran clashes. Oil jumps by 7% Jul 30, 2026
- USD/JPY Temporary in Equilibrium: Multiple Factors in Focus Jul 30, 2026
- GBP/USD at Month’s Lows: The Outlook Remains Weak Jul 29, 2026
- Crude oil falls below $80 per barrel. Australia sees inflation slowdown Jul 29, 2026
- The US Tech sector hit by sell‑off. Oil prices decline on renewed negotiations Jul 28, 2026
- Gold Declines, Focus on Fed and Falling Oil Prices Jul 28, 2026
- This week will be one of the most crowded for central‑bank meetings Jul 27, 2026
- EUR/USD Ahead of a Key Week: Holding Near Lows Jul 27, 2026