
– RESEARCH HIGHLIGHTS:
- The SPY has been trading below its previous peak resistance level from March for more than two weeks and has begun to retest this level.
- If the SPY can clear this level on moderately strong volume, we believe the US stock market may enter another “melt-up” phase.
- If not, then we may see more of a sideways/melt-down phase headed into the US Presidential Elections.
The SPY, SPDR S&P 500 ETF, has been trading below the $339.50, previous peak resistance level, for more than two weeks recently and has begun to retest this level. I believe these levels are critical in determining the future trending capacity of the SPY and the US stock market. If the SPY can clear this level on moderately strong volume, we believe the US stock market may enter another “melt-up” phase. If not, then we may see more of a sideways/melt-down phase headed into the US Presidential Elections.
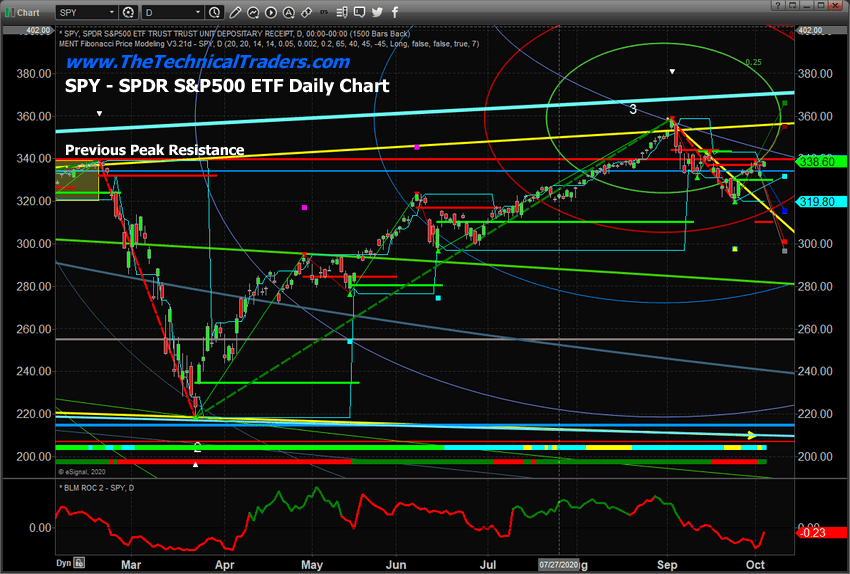
SPY PRICE RESISTANCE AT $339.50
This Daily SPY chart below highlights our Adaptive Fibonacci Price Modeling system and shows the Previous Peak Resistance level as a SOLID RED LINE. We believe the current setup suggests this resistance level may act as a solid ceiling in price over the next few weeks. If price can break through this resistance level for a few trading sessions then we will likely see it continue marching up (until the next news bomb hits).
Below, we look at the Weekly SPY chart to see the bigger picture with a longer-term chart. We can easily spot the resistance near the $339.50 previous peak level and how the current price is retesting this critical price level. We believe the markets are simply waffling sideways before the US Presidential elections.
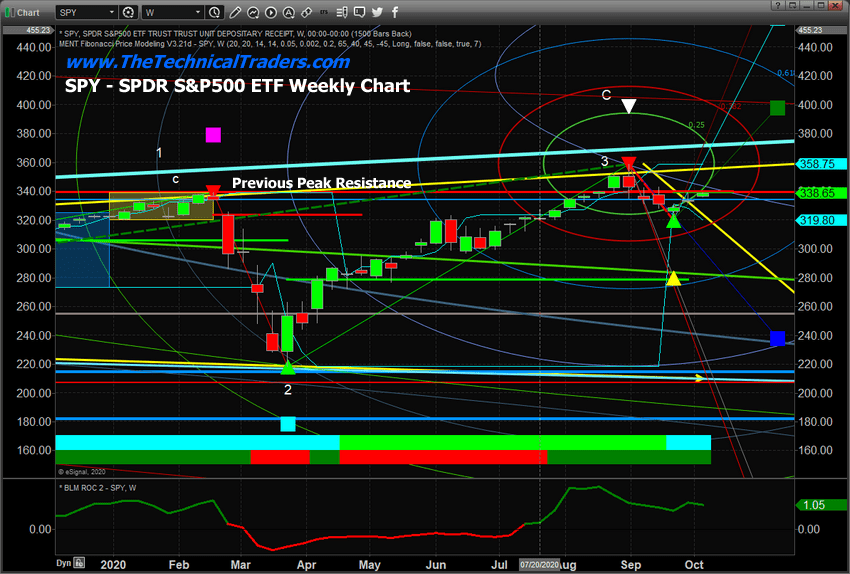
Watch for the $339.50 level to be accepted or rejected. Traders should stay very cautious and look for sectors that present greater opportunities and defined trends. The major indexes are going to continue to trade in a sideways pattern as Washington DC and the Senate are stuck in paralysis before the elections. There are still opportunities to profit from some of these moves, just be cautious of the volatility at play in the markets.
Free Reports:
 Get our Weekly Commitment of Traders Reports - See where the biggest traders (Hedge Funds and Commercial Hedgers) are positioned in the futures markets on a weekly basis.
 Download Our Metatrader 4 Indicators – Put Our Free MetaTrader 4 Custom Indicators on your charts when you join our Weekly Newsletter
As a technical analyst and trader since 1997, I have been through a few bull/bear market cycles in stocks and commodities. I believe I have a good pulse on the market and timing key turning points for investing and short-term swing traders. Subscribers of my Active ETF Swing Trading Newsletter can ride my coattails as I navigate these financial markets and build wealth. My research and trading team are here to help you find better trades and navigate these incredibly crazy market trends.
While most of us have active trading accounts, our long-term investment and retirement accounts are equally at risk. We can also help you preserve and even grow your long term capital when things get ugly (likely now) with our Passive Long-Term ETF Investing Signals. Don’t wait until it is too late – subscribe today!
Have a great week!
Chris Vermeulen
Chief Market Strategies
Founder of Technical Traders Ltd.
NOTICE AND DISCLAIMER: Our free research does not constitute a trade recommendation or solicitation for our readers to take any action regarding this research. It is provided for educational purposes only – read our FULL DISCLAIMER here. Visit TheTechnicalTraders.com to learn how to take advantage of our members-only research and trading signals.

- The Tech‑heavy NASDAQ Index jumped by more than 3.3%. The offshore yuan is trading at its highest level since 2023 Jul 31, 2026
- USD/JPY After Volatility: Multiple Events in One Day Jul 31, 2026
- The US indices sell off amid renewed US-Iran clashes. Oil jumps by 7% Jul 30, 2026
- USD/JPY Temporary in Equilibrium: Multiple Factors in Focus Jul 30, 2026
- GBP/USD at Month’s Lows: The Outlook Remains Weak Jul 29, 2026
- Crude oil falls below $80 per barrel. Australia sees inflation slowdown Jul 29, 2026
- The US Tech sector hit by sell‑off. Oil prices decline on renewed negotiations Jul 28, 2026
- Gold Declines, Focus on Fed and Falling Oil Prices Jul 28, 2026
- This week will be one of the most crowded for central‑bank meetings Jul 27, 2026
- EUR/USD Ahead of a Key Week: Holding Near Lows Jul 27, 2026