
| Indicator | Value | Signal |
| RSI | Neutral | |
| MACD | Buy | |
| MA(200) | Neutral | |
| Fractals | Buy | |
| Parabolic SAR | Buy | |
| Bollinger Bands | Buy |
Chart Analysis
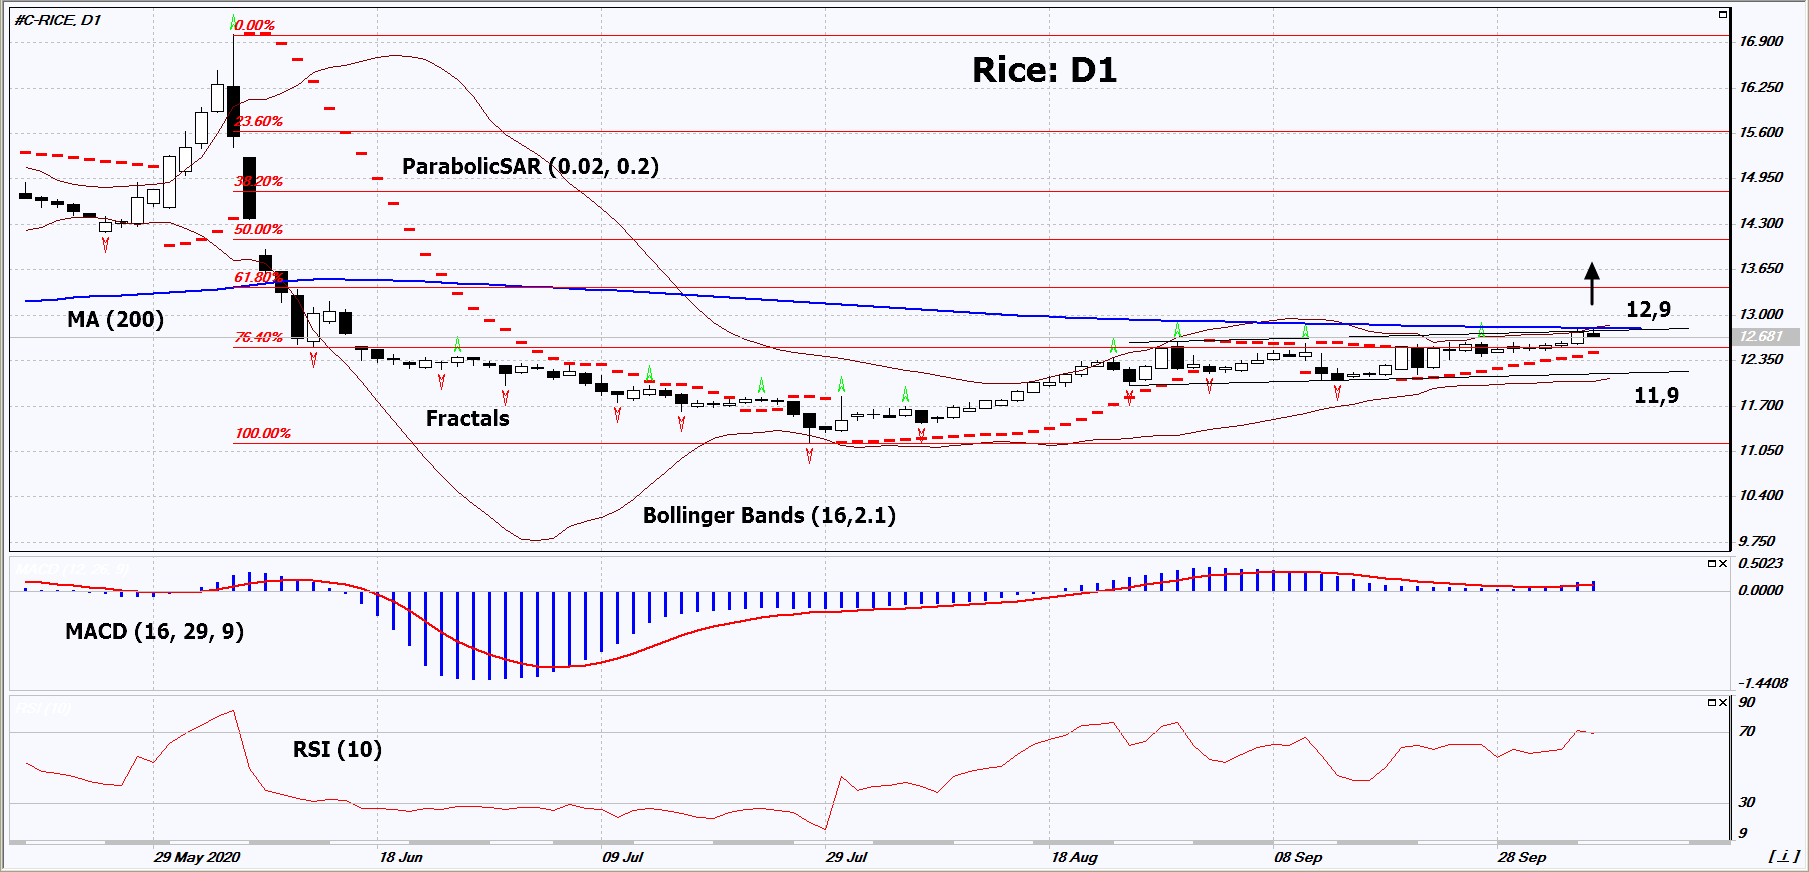
On the daily timeframe, Rice: D1 exceeded the last 3 upper fractals and approached the upper border of the ascending channel. It must be broken upward before opening a position. A number of technical analysis indicators formed signals for further growth. We do not rule out a bullish move if Rice rises above the 200-day moving average line and the upper Bollinger band: 12.9. This level can be used as an entry point. We can set a stop loss below the Parabolic signal, the lower Bollinger band and the last 3 lower fractals: 11.9. After opening a pending order, we move the stop loss to the next fractal low following the Bollinger and Parabolic signals. Thus, we change the potential profit/loss ratio in our favor. After the transaction, the most risk-averse traders can switch to the four-hour chart and set a stop loss, moving it in the direction of the bias. If the price meets the stop loss (11.9) without activating the order (12.9), it is recommended to delete the order: the market sustains internal changes that have not been taken into account.
Fundamental Analysis
Rainy weather in India can damage crops. Will Rice quotes grow ?
Market Analysis provided by IFCMarkets.com

- The Tech‑heavy NASDAQ Index jumped by more than 3.3%. The offshore yuan is trading at its highest level since 2023 Jul 31, 2026
- USD/JPY After Volatility: Multiple Events in One Day Jul 31, 2026
- The US indices sell off amid renewed US-Iran clashes. Oil jumps by 7% Jul 30, 2026
- USD/JPY Temporary in Equilibrium: Multiple Factors in Focus Jul 30, 2026
- GBP/USD at Month’s Lows: The Outlook Remains Weak Jul 29, 2026
- Crude oil falls below $80 per barrel. Australia sees inflation slowdown Jul 29, 2026
- The US Tech sector hit by sell‑off. Oil prices decline on renewed negotiations Jul 28, 2026
- Gold Declines, Focus on Fed and Falling Oil Prices Jul 28, 2026
- This week will be one of the most crowded for central‑bank meetings Jul 27, 2026
- EUR/USD Ahead of a Key Week: Holding Near Lows Jul 27, 2026