
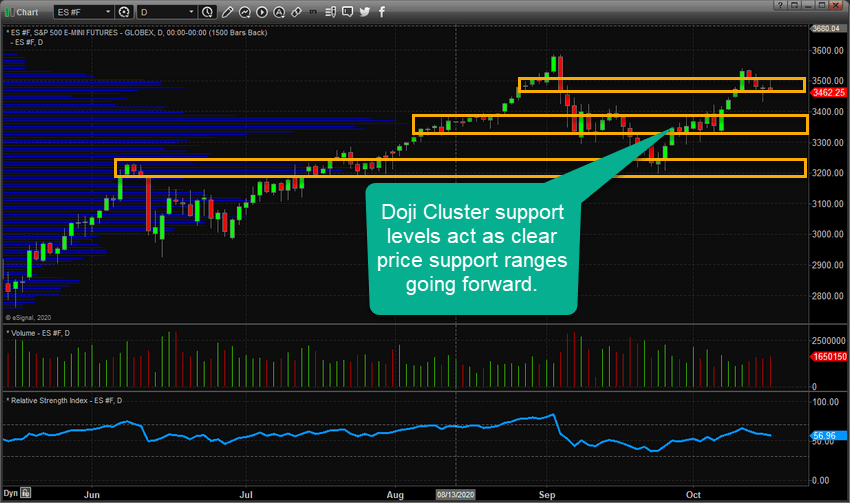
– Clusters of Doji shaped candles have, for centuries, illustrated very clear levels of support/resistance in price action. Whenever multiple Doji candles appear in a cluster-like formation, traders should pay attention to these levels as future support/resistance ranges for price action. In the case of the S&P500 E-Mini Futures Daily Chart, we can clearly see three separate support zones – the highest one being right where price closed on Friday (near 3475).
As the US elections near, we do expect increased volatility to become a factor in the US markets. Currently, our predictive modeling systems are suggesting a Bullish trend bias is in place in the markets. Therefore, we expect the bias of the trend to continue to push higher. Yet, these Doji Cluster support levels become very clear downside targets if increased volatility prompts any broad market rotation over the next few days/weeks. These three levels are :
- 3445~3495
- 3330~3390
- 3185~3225
We are suggesting that IF any deeper market rotation takes place, support near these Doji Cluster levels would likely act as a major price floor – prompting some price support and a potential for a quick upside price reversal near these levels. If the lowest level, near 3200, is breached by deeper price rotation, then a new price correction phase may setup.
Traders should use these levels to prepare for the expected volatility spike as we near the US elections. We believe price will become more volatile as traders/investors attempt to reposition assets away from risk before the elections. We are particularly concerned of a breakdown in the Technology sector related to recent threats to increase liability related to a special clause (230) that protects companies like Facebook and Twitter from the same Publisher Liability as major newspapers.
Free Reports:
 Download Our Metatrader 4 Indicators – Put Our Free MetaTrader 4 Custom Indicators on your charts when you join our Weekly Newsletter
 Get our Weekly Commitment of Traders Reports - See where the biggest traders (Hedge Funds and Commercial Hedgers) are positioned in the futures markets on a weekly basis.
Given the renewed focus on these social media sites and the content posted/restricted on these sites, it appears they have become the target of investigations and the US Congress. This could lead to some very big volatility spikes in the NASDAQ and the Technology sector over the next few weeks and months. This could result in some very good trade setups as price levels may rotate wildly because of the elections and the pending decisions related to these social media firms.
Want to learn how we help traders stay ahead of these bigger trends and setups? Visit TheTechnicalTraders.com to learn more about my swing trade alert and passive long-term signals services. Stay ahead of the market and protect your wealth by signing up today!
Chris Vermeulen
Chief Market Strategist
www.TheTechnicalTraders.com
NOTICE AND DISCLAIMER: Our free research does not constitute a trade recommendation or solicitation for our readers to take any action regarding this research. It is provided for educational purposes only – read our FULL DISCLAIMER here.

- The Tech‑heavy NASDAQ Index jumped by more than 3.3%. The offshore yuan is trading at its highest level since 2023 Jul 31, 2026
- USD/JPY After Volatility: Multiple Events in One Day Jul 31, 2026
- The US indices sell off amid renewed US-Iran clashes. Oil jumps by 7% Jul 30, 2026
- USD/JPY Temporary in Equilibrium: Multiple Factors in Focus Jul 30, 2026
- GBP/USD at Month’s Lows: The Outlook Remains Weak Jul 29, 2026
- Crude oil falls below $80 per barrel. Australia sees inflation slowdown Jul 29, 2026
- The US Tech sector hit by sell‑off. Oil prices decline on renewed negotiations Jul 28, 2026
- Gold Declines, Focus on Fed and Falling Oil Prices Jul 28, 2026
- This week will be one of the most crowded for central‑bank meetings Jul 27, 2026
- EUR/USD Ahead of a Key Week: Holding Near Lows Jul 27, 2026