
Article By RoboForex.com
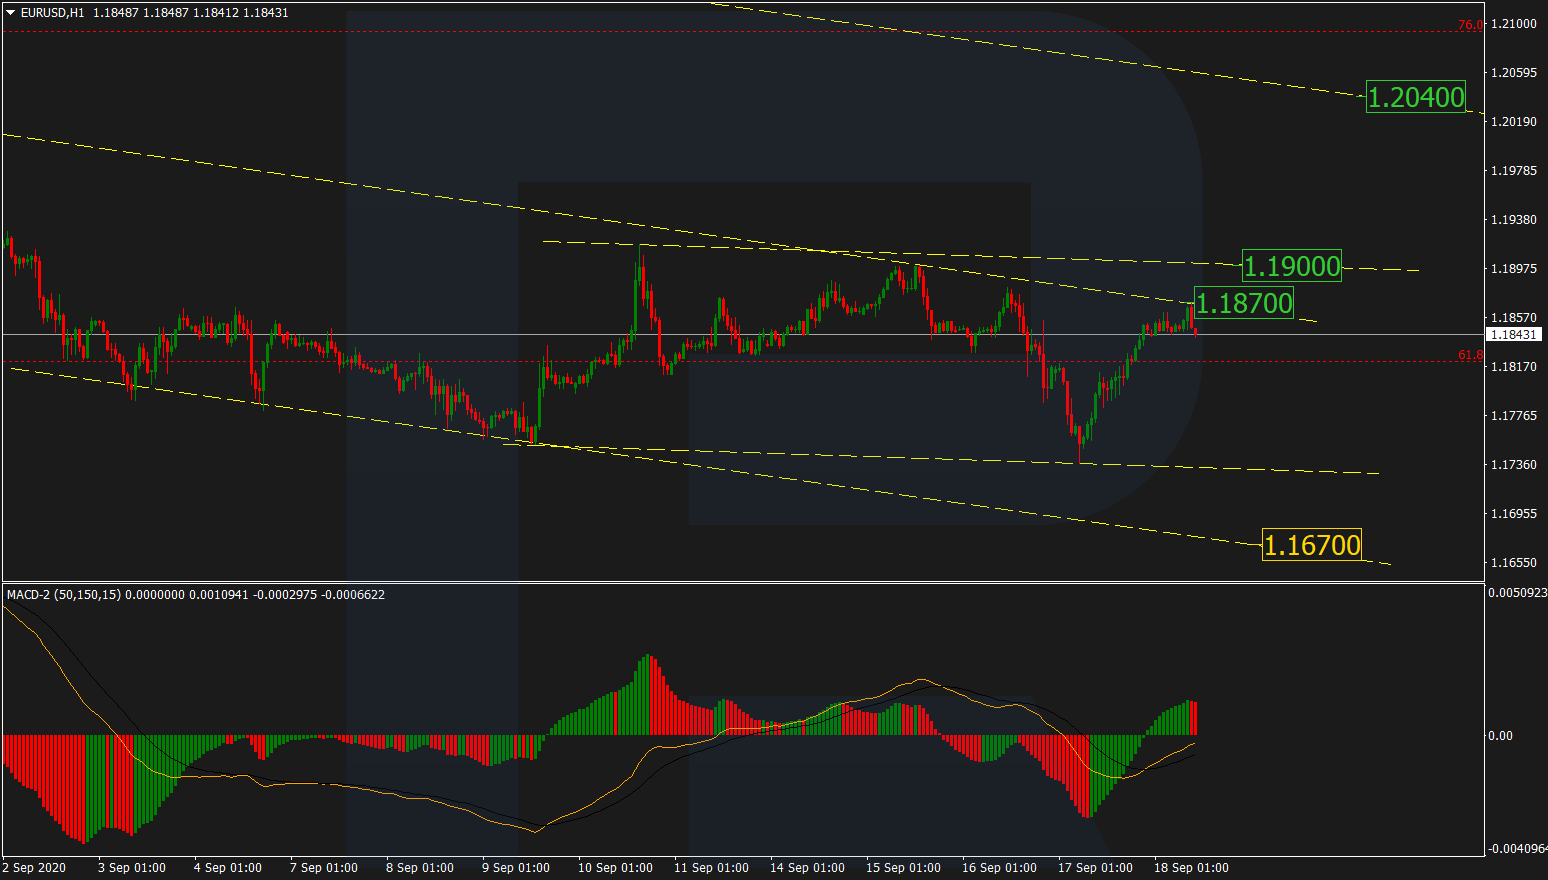
EURUSD, “Euro vs US Dollar”
After updating its previous low and testing the long-term support level, EURUSD has formed the ascending structure towards the mid-term resistance line at 1.1879. If the price breaks this level, the market may grow to reach the next resistance lien at 1.1900 or even break it. After that, the instrument may continue trading upwards to update the high and reach 1.2040. However, another scenario implies that the asset may rebound from the mid-term resistance line and form a new descending structure with the target at 1.1670.

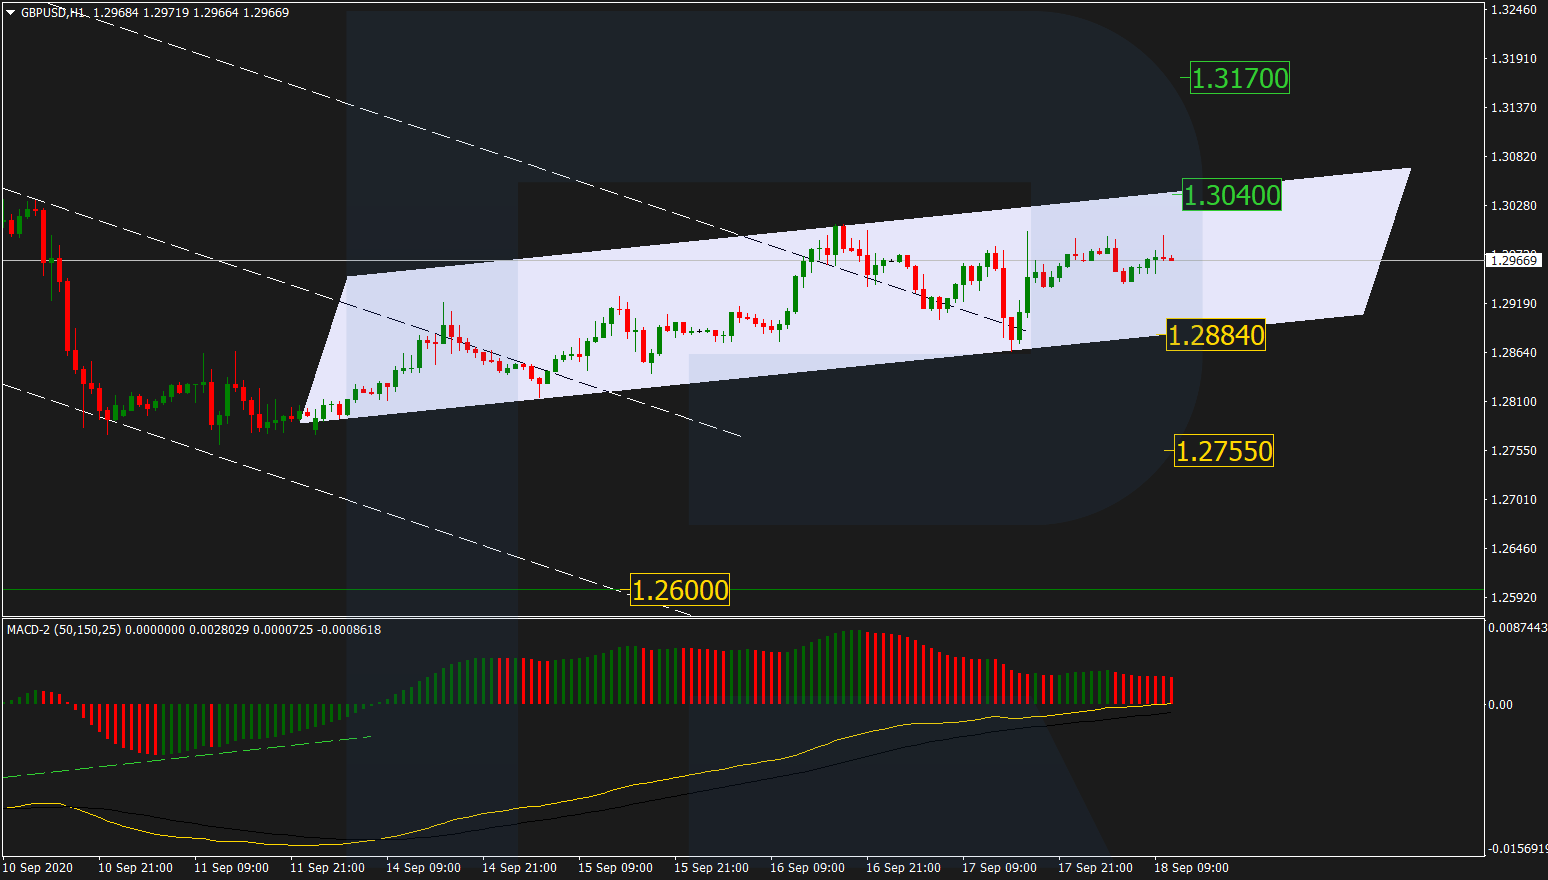
GBPUSD, “Great Britain Pound vs US Dollar”
GBPUSD is still correcting to the upside; it has failed to break the support line of the local ascending channel and may rebound from it to reach the resistance line at 1.3040. Later, the market may break this level and continue growing towards 1.3170. However, if the price breaks the support area at 1.2884, the asset may start a new decline to reach the low at 1.2755.
Free Reports:
 Sign Up for Our Stock Market Newsletter – Get updated on News, Charts & Rankings of Public Companies when you join our Stocks Newsletter
 Get our Weekly Commitment of Traders Reports - See where the biggest traders (Hedge Funds and Commercial Hedgers) are positioned in the futures markets on a weekly basis.
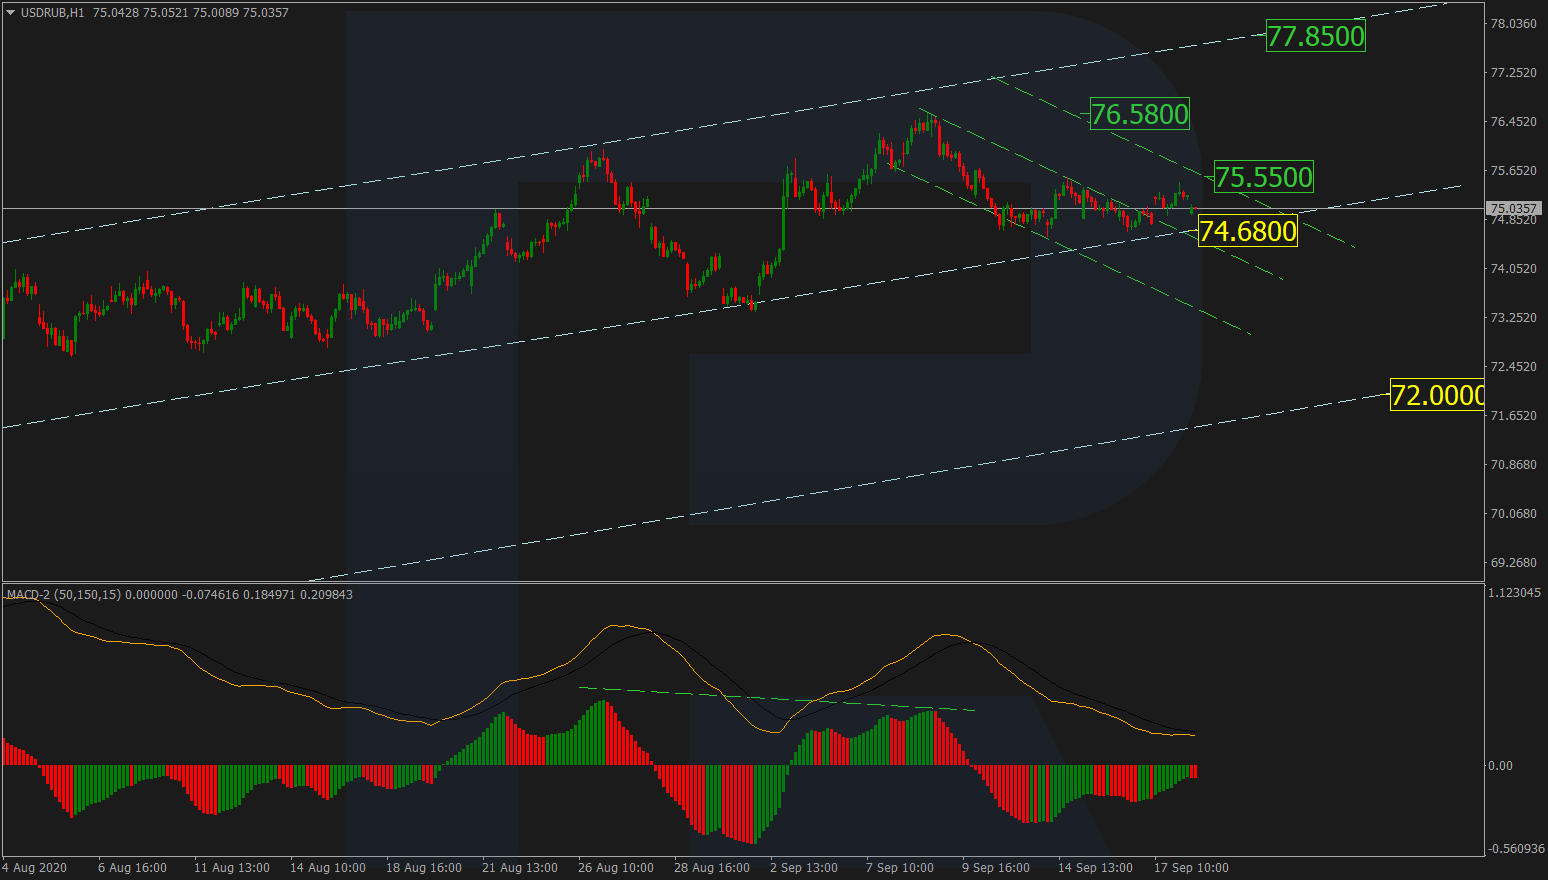
USDRUB, “US Dollar vs Russian Ruble”
USDRUB has failed to test the support line of the key ascending channel. The current dynamics hint at a possible extension of the range and then a new ascending wave. If the price breaks the local resistance line at 75.55, the market may continue the ascending tendency with the target at 76.58 or even 77.85. At the same time, one should pay attention to the MACD lines, which are directed to the downside, thus indicating a possible descending impulse after the instrument breaks the support area at 74.68. In this case, the downside target will be at 72.00.
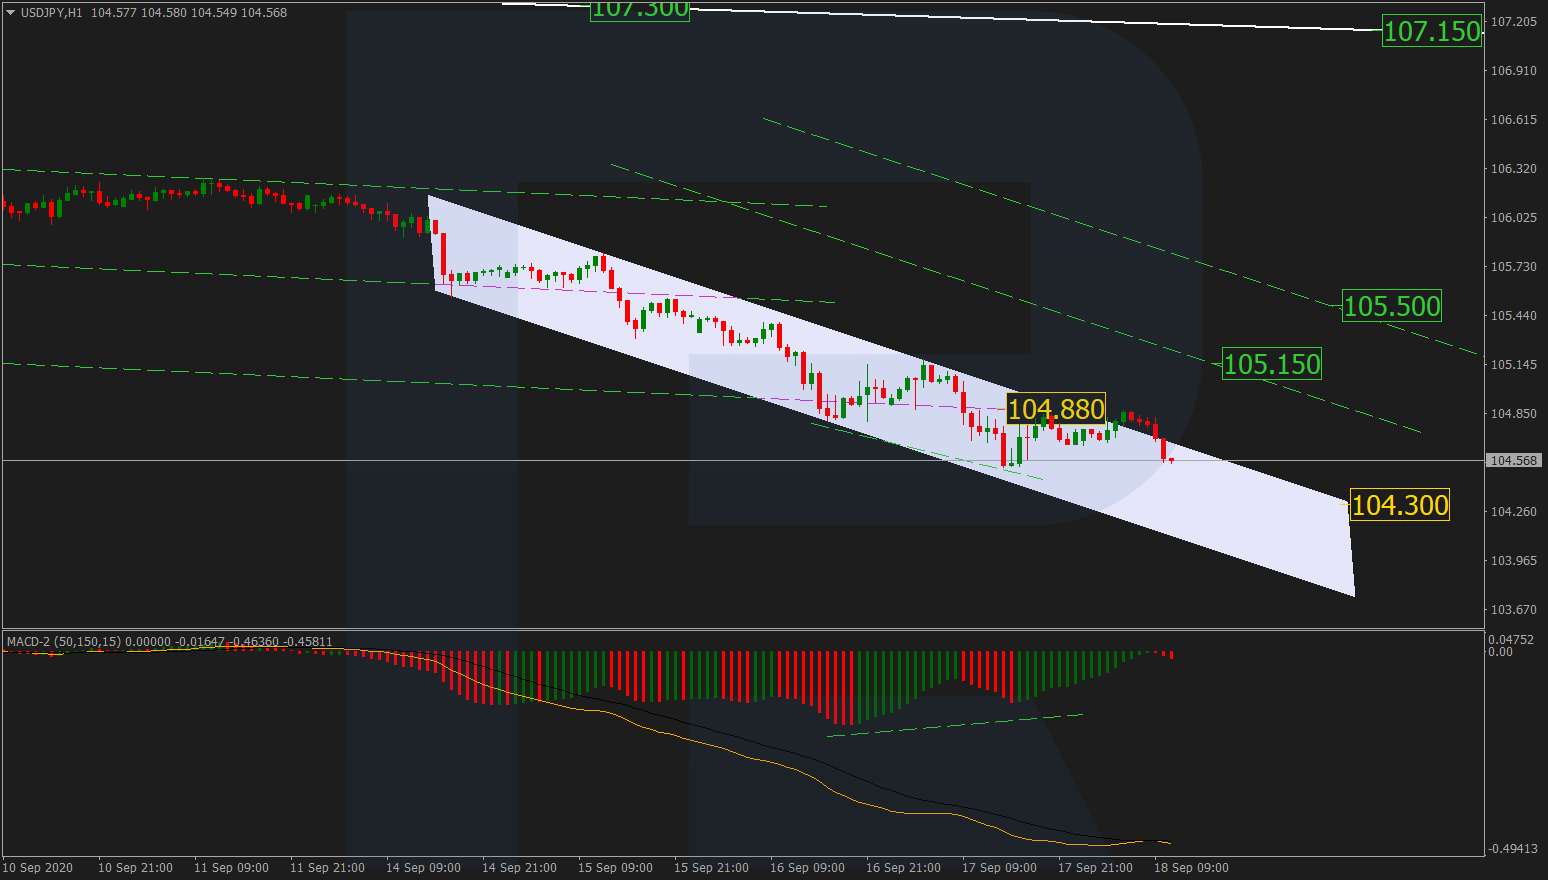
USDJPY, “US Dollar vs Japanese Yen”
After testing and rebounding from 104.88, USDJPY is still trading downwards and trying to test the upside border of the current channel. If the price breaks it, the market may expand the correctional range and reach 105.15 and 105.50. This scenario is confirmed by the MACD indicator, which is forming a convergence. The resistance line is at 105.50. However, the instrument may test the resistance line and rebound from it. After that, the asset may continue trading downwards with the target at 104.30.
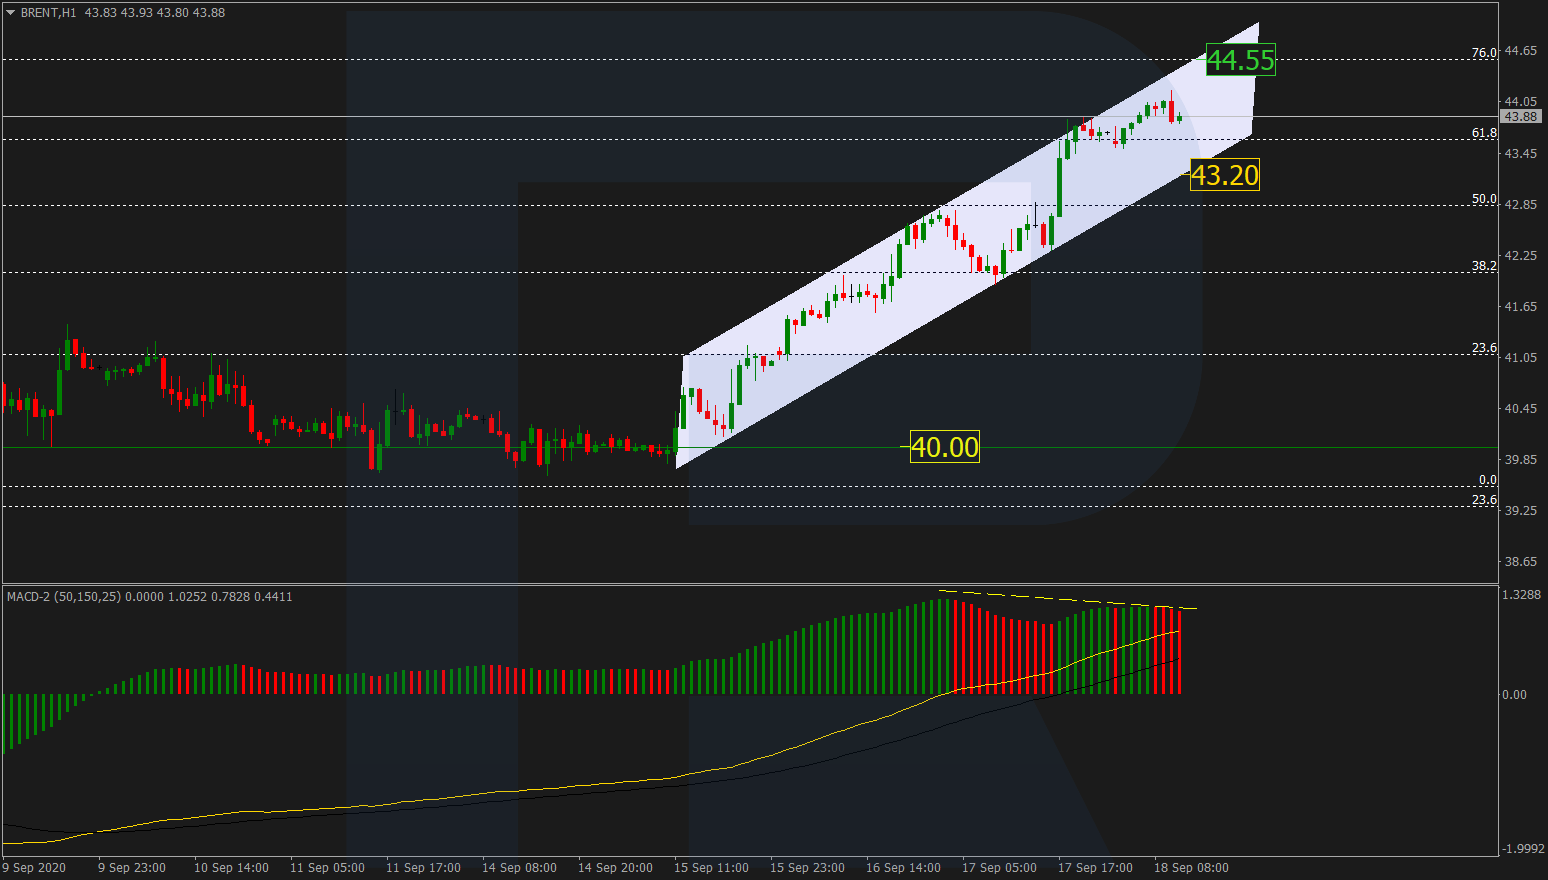
BRENT
After rebounding from 50.0% fibo at 42.75 and then returning to 38.2% fibo at 42.00, Brent once again reached the former level, broke it, and continued growing towards 61.8% fibo. The next upside target is 76.0% fibo at 44.55. Such dynamics may hint at further growth towards the high to update it. At the same time, the MACD indicator is forming a divergence, which may hint at a possible pullback. The closest correctional target may be the local support area at 43.20.
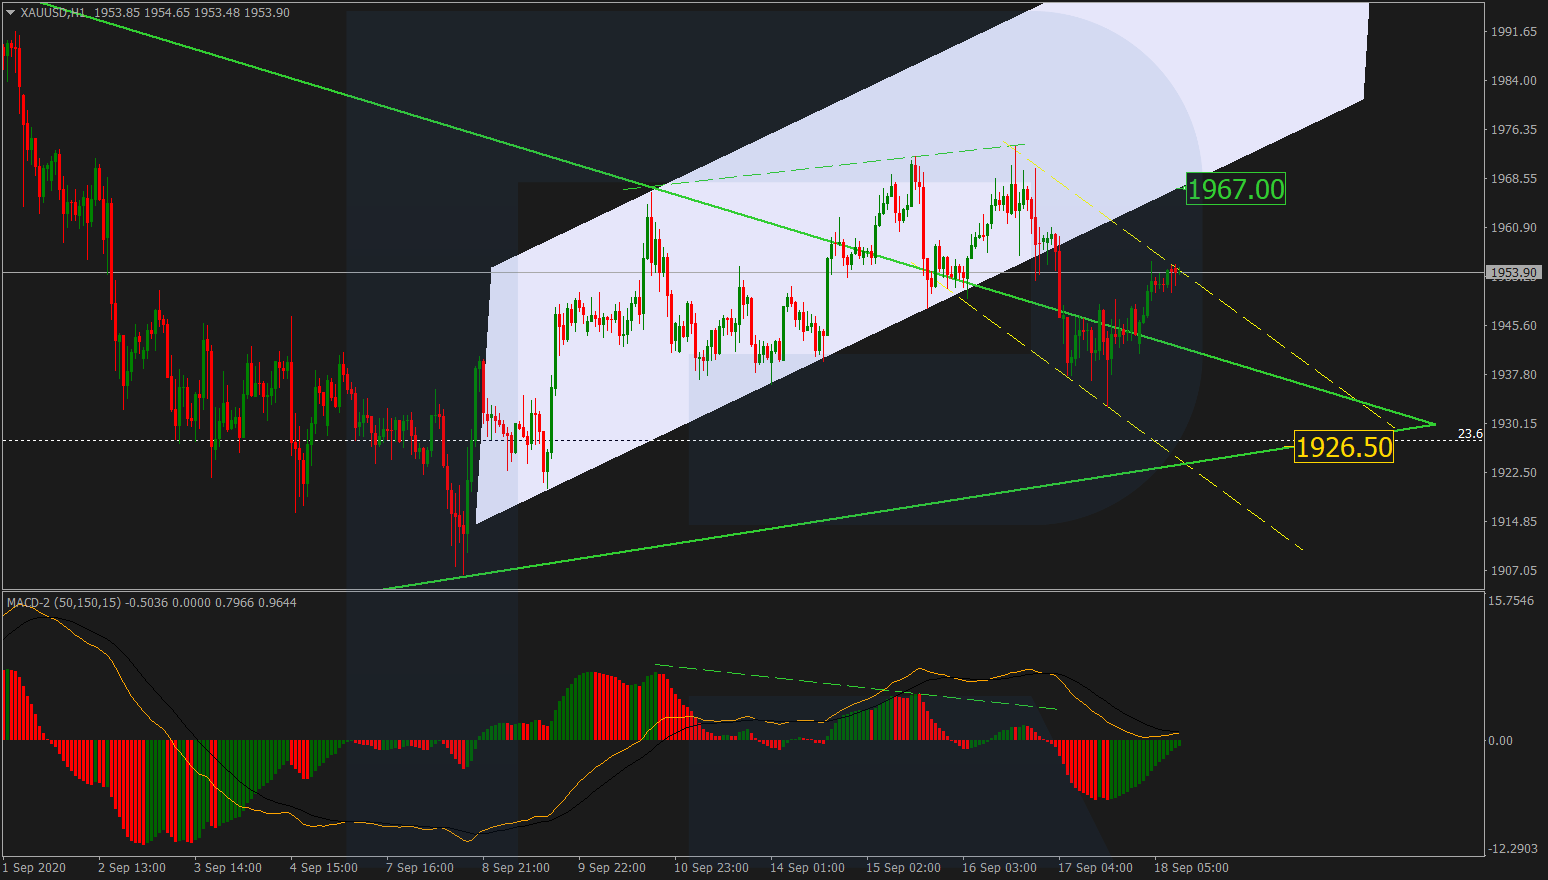
XAUUSD, “Gold vs US Dollar”
After changing the short-term tendency and getting back inside a Triangle pattern, Gold is correcting and forming a new descending channel. If the price rebounds from the resistance line, the market may start a new wave to the downside to reach 1926.00. This scenario is confirmed by the MACD lines, which are directed downwards.
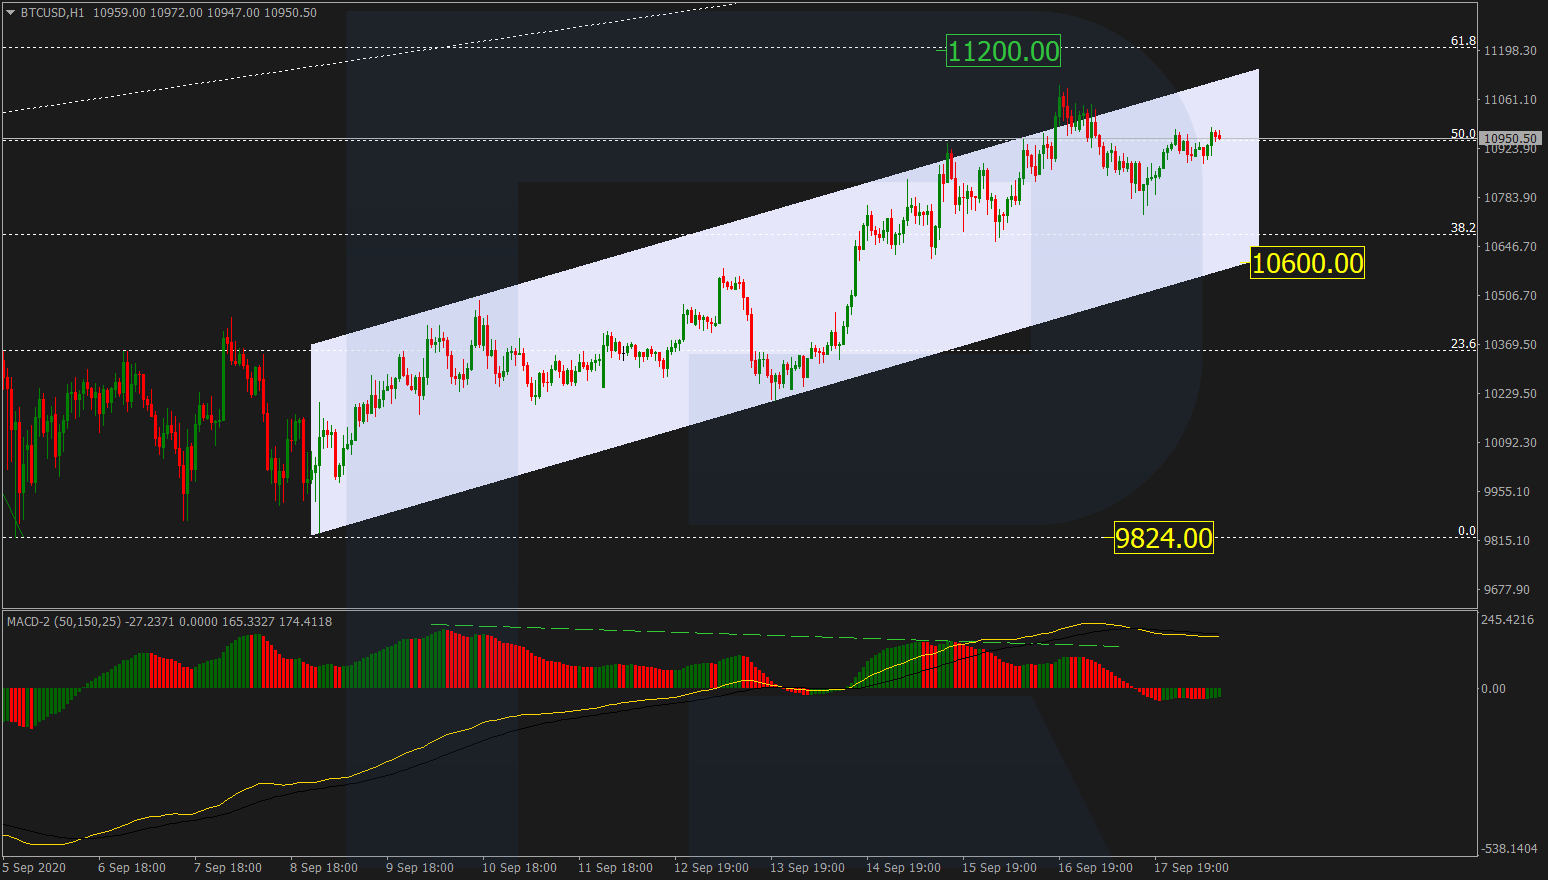
BTCUSD, “Bitcoin vs US Dollar”
BTCUSD is still growing and trying to reach 61.8% fibo at 11200.00. Taking into account a stable ascending tendency, the MACD lines are directed downwards after the divergence, which may hint at a new decline to break the support area at 10600.00 and then continue falling with the target at the low at 9824.00.
S&P 500
After finishing the pullback 38.2% fibo and then forming a new descending wave, the S&P 500 index has failed to reach the low at 3310.6; right now, the asset is forming a correction to the upside, which may later transform into a proper ascending wave but only after a breakout of the resistance line at 3386.4. The target of this wave will be 50.0% fibo at 3451.0. However, if the price breaks the local support line, the descending tendency will continue. This scenario is confirmed by the MACD lines, which are directed downwards.

Article By RoboForex.com
Attention!
Forecasts presented in this section only reflect the author’s private opinion and should not be considered as guidance for trading. RoboForex LP bears no responsibility for trading results based on trading recommendations described in these analytical reviews.

- The Tech‑heavy NASDAQ Index jumped by more than 3.3%. The offshore yuan is trading at its highest level since 2023 Jul 31, 2026
- USD/JPY After Volatility: Multiple Events in One Day Jul 31, 2026
- The US indices sell off amid renewed US-Iran clashes. Oil jumps by 7% Jul 30, 2026
- USD/JPY Temporary in Equilibrium: Multiple Factors in Focus Jul 30, 2026
- GBP/USD at Month’s Lows: The Outlook Remains Weak Jul 29, 2026
- Crude oil falls below $80 per barrel. Australia sees inflation slowdown Jul 29, 2026
- The US Tech sector hit by sell‑off. Oil prices decline on renewed negotiations Jul 28, 2026
- Gold Declines, Focus on Fed and Falling Oil Prices Jul 28, 2026
- This week will be one of the most crowded for central‑bank meetings Jul 27, 2026
- EUR/USD Ahead of a Key Week: Holding Near Lows Jul 27, 2026