
Article By RoboForex.com
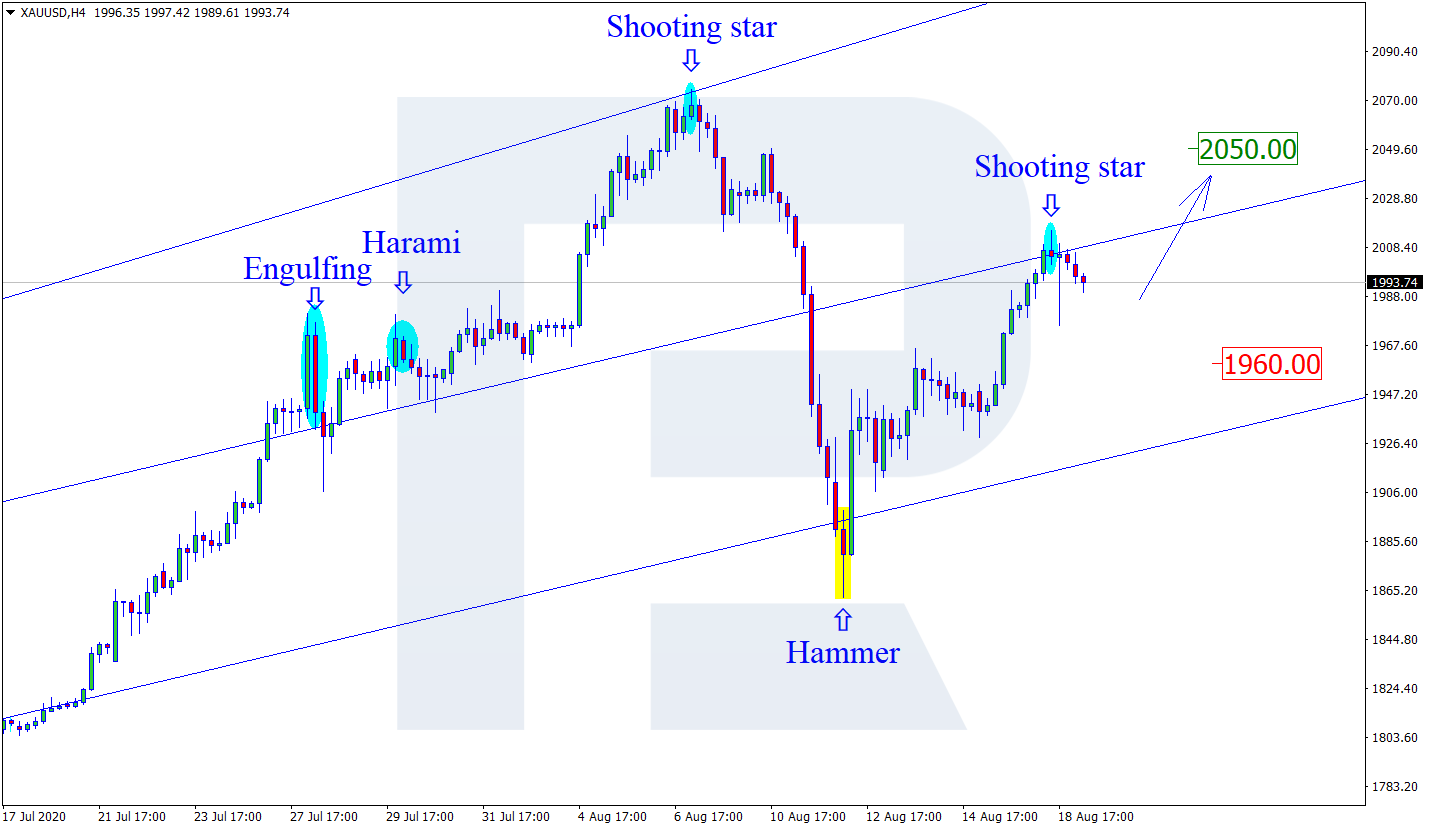
XAUUSD, “Gold vs US Dollar”
As we can see in the H4 chart, the uptrend continues. After finishing a Shooting Star pattern not far from the resistance level, XAUUSD may reverse and correct towards the support area at 1960.00. Later, the price is expected to rebound from this level and resume trading upwards. In this case, the upside target may be at 2050.00.

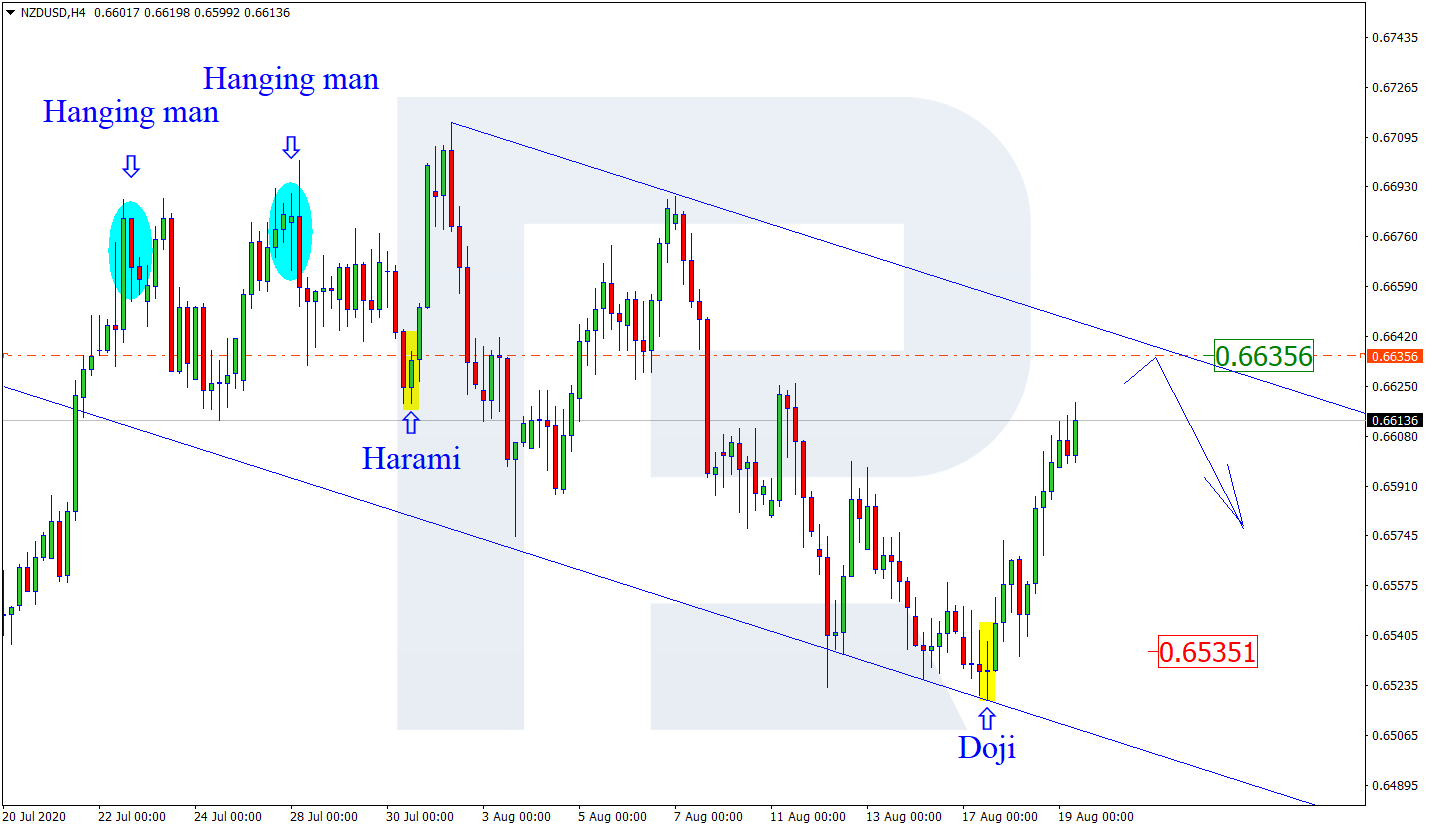
NZDUSD, “New Zealand vs. US Dollar”
As we can see in the H4 chart, NZDUSD is still correcting withing the descending tendency. After forming a Doji pattern close to the support level, NZDUSD has started reversing. At the moment, the price is expected to resume growing towards the resistance area at 0.6635. Later, the market may rebound from the channel’s upside border and resume falling. In this case, the downside target may be the support area at 0.6535.
Free Reports:
 Download Our Metatrader 4 Indicators – Put Our Free MetaTrader 4 Custom Indicators on your charts when you join our Weekly Newsletter
 Get our Weekly Commitment of Traders Reports - See where the biggest traders (Hedge Funds and Commercial Hedgers) are positioned in the futures markets on a weekly basis.
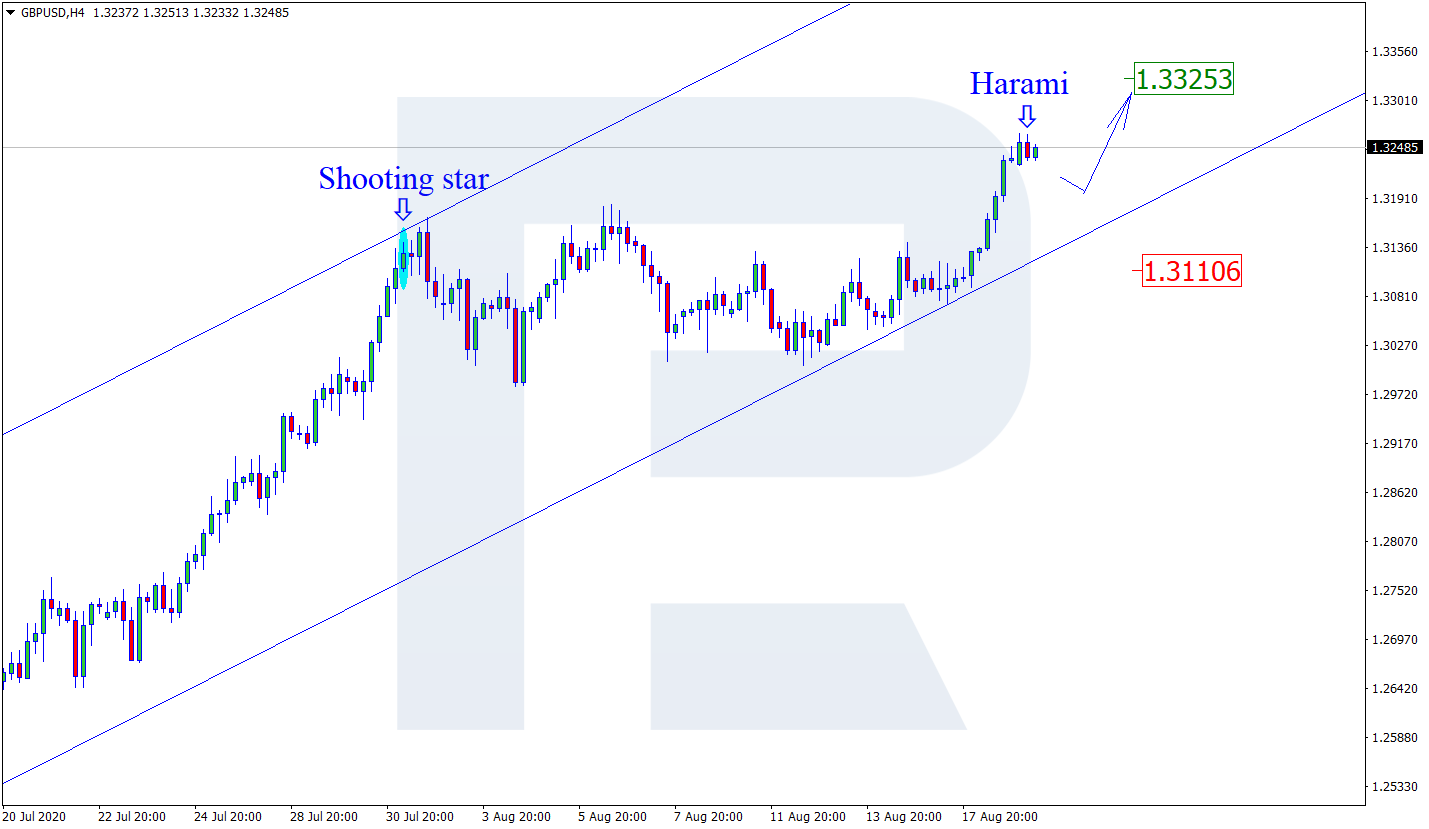
GBPUSD, “Great Britain Pound vs US Dollar”
As we can see in the H4 chart, the pair is still forming the ascending tendency. After forming a Harami pattern close to the resistance level, GBPUSD may reverse and form a slight correction towards the rising channel’s downside border. Later, the market may resume trading upwards. In this case, the upside target is at 1.3325. However, there might be another scenario, according to which the price may reverse and start a pullback towards 1.3110.
Article By RoboForex.com
Attention!
Forecasts presented in this section only reflect the author’s private opinion and should not be considered as guidance for trading. RoboForex LP bears no responsibility for trading results based on trading recommendations described in these analytical reviews.

- EUR/USD: Busy Week Ahead Aug 3, 2026
- Positive sentiment in the AI sector supported stock indices. Oil prices remain volatile Aug 3, 2026
- The Tech‑heavy NASDAQ Index jumped by more than 3.3%. The offshore yuan is trading at its highest level since 2023 Jul 31, 2026
- USD/JPY After Volatility: Multiple Events in One Day Jul 31, 2026
- The US indices sell off amid renewed US-Iran clashes. Oil jumps by 7% Jul 30, 2026
- USD/JPY Temporary in Equilibrium: Multiple Factors in Focus Jul 30, 2026
- GBP/USD at Month’s Lows: The Outlook Remains Weak Jul 29, 2026
- Crude oil falls below $80 per barrel. Australia sees inflation slowdown Jul 29, 2026
- The US Tech sector hit by sell‑off. Oil prices decline on renewed negotiations Jul 28, 2026
- Gold Declines, Focus on Fed and Falling Oil Prices Jul 28, 2026
