
Article By RoboForex.com
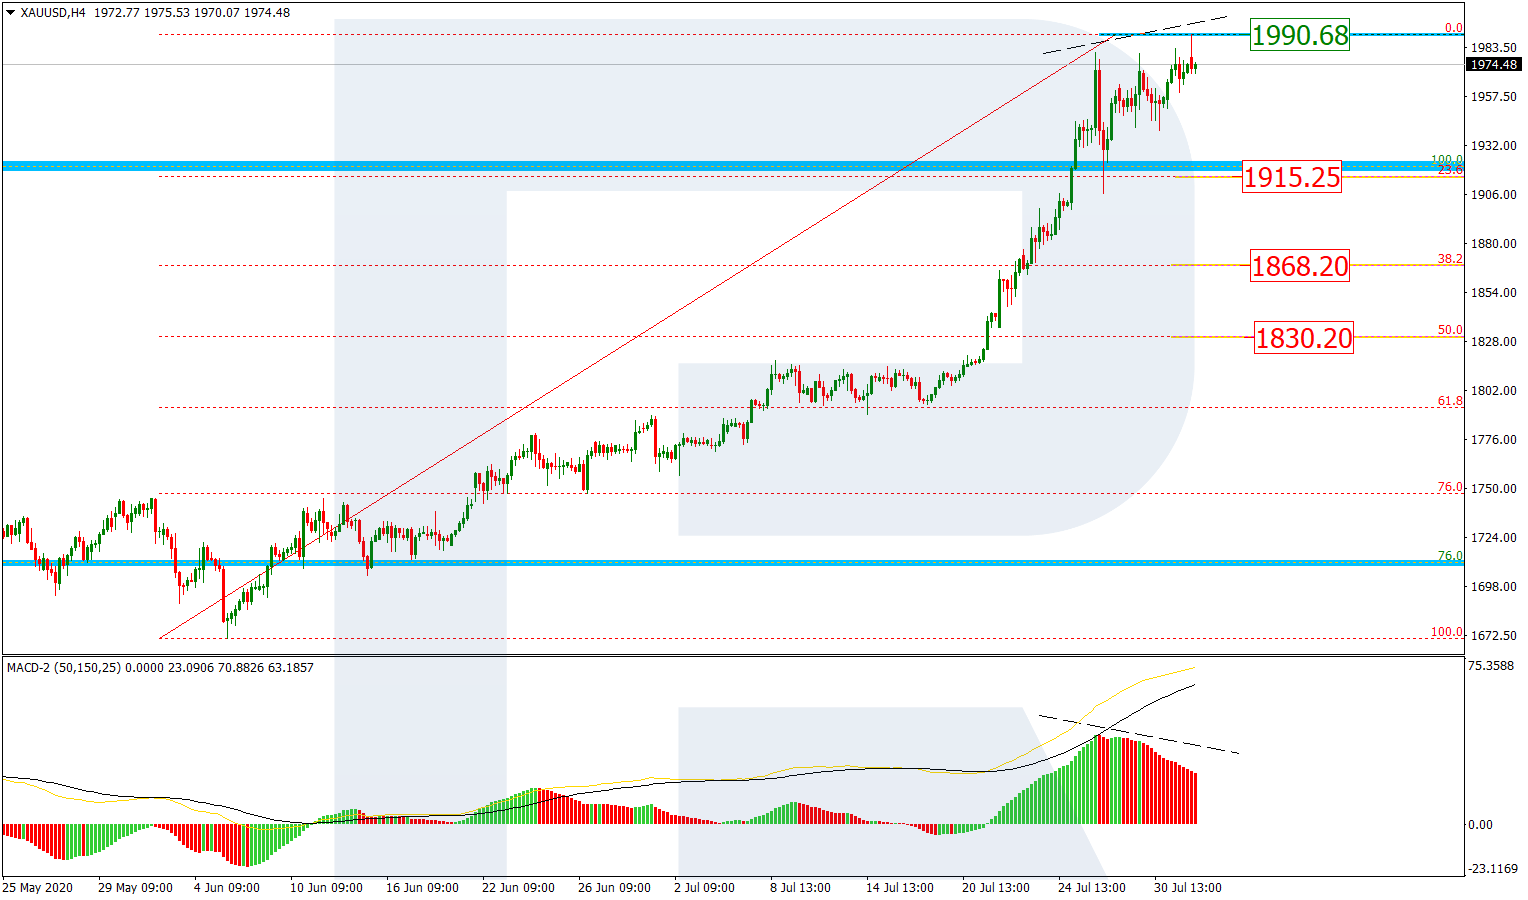
XAUUSD, “Gold vs US Dollar”
As we can see in the H4 chart, MACD is forming a divergence, which may indicate a possible correction to the downside with the targets at 23.6%, 38.2%, and 50.0% fibo at 1915.25, 1868.20, and 1830.20 respectively. The resistance is the high at 1990.68. The next upside targets are inside the post-correctional extension area between 138.2% and 161.8% fibo at 2254.60 and 2460.00 respectively.

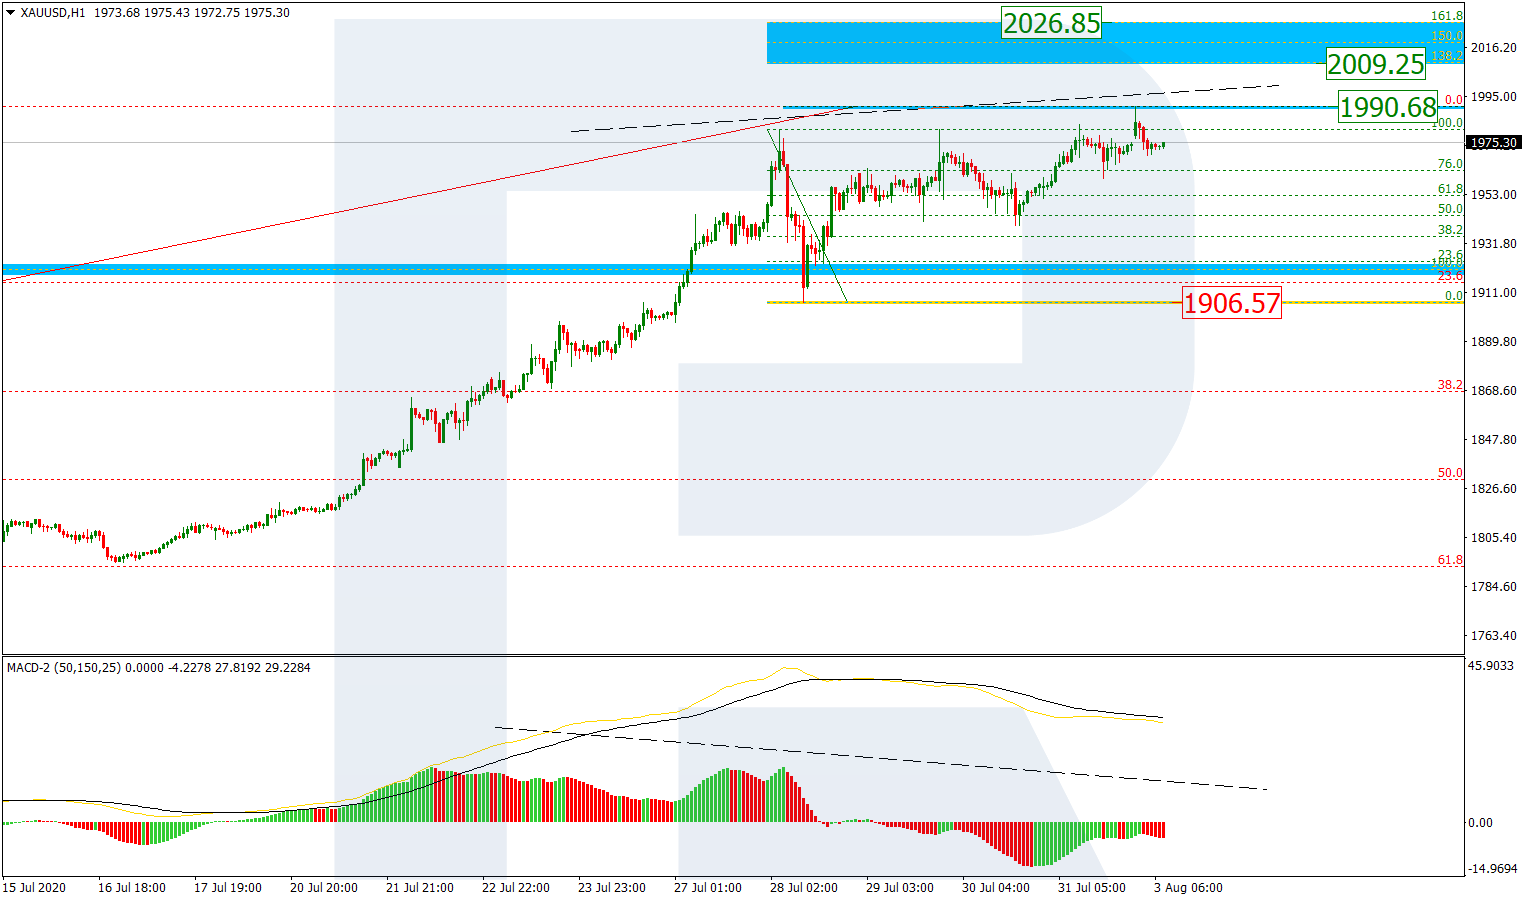
In the H1 chart, after breaking the previous high, the pair is still moving upwards. Later, the market may break the high at 1990.68 and then reach the post-correctional extension area between 138.2% and 161.8% fibo at 2009.25 and 2026.85 respectively. However, a breakout of the low at 1906.57 will indicate a correction.
Free Reports:
 Get our Weekly Commitment of Traders Reports - See where the biggest traders (Hedge Funds and Commercial Hedgers) are positioned in the futures markets on a weekly basis.
 Sign Up for Our Stock Market Newsletter – Get updated on News, Charts & Rankings of Public Companies when you join our Stocks Newsletter
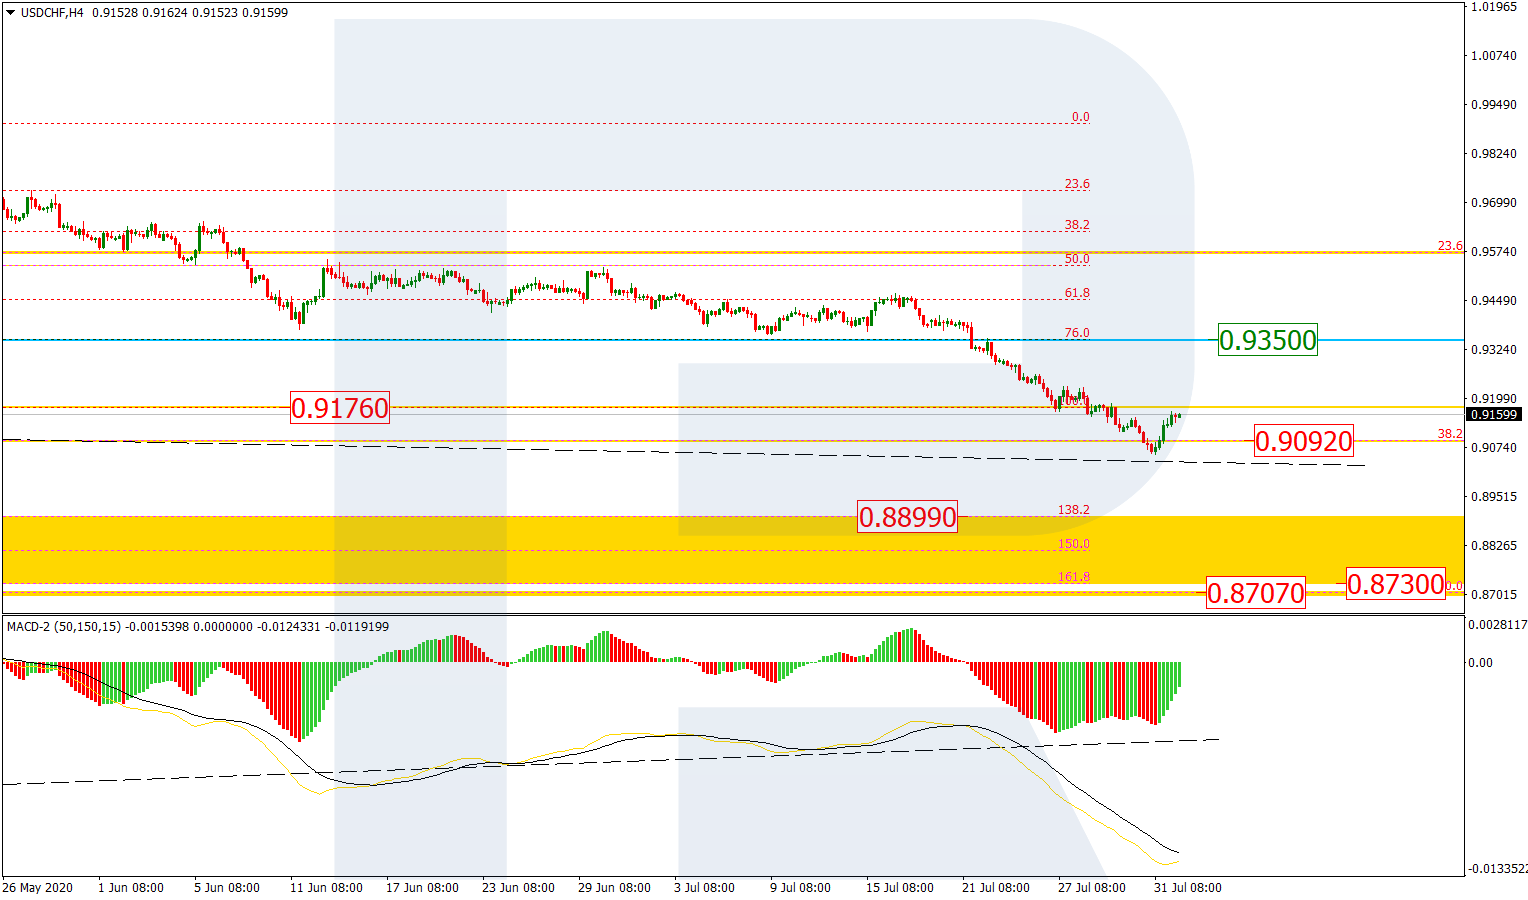
USDCHF, “US Dollar vs Swiss Franc”
As we can see in the H4 chart, the pair has reached the long-term 38.2% fibo at 0.9092. In the future, USDCHF may continue its decline towards the post-correctional extension area between 138.2% and 161.8% fibo at 0.8899 and 0.8730 respectively and the long-term 50.0% fibo at 0.8707. The resistance is at 0.9350.
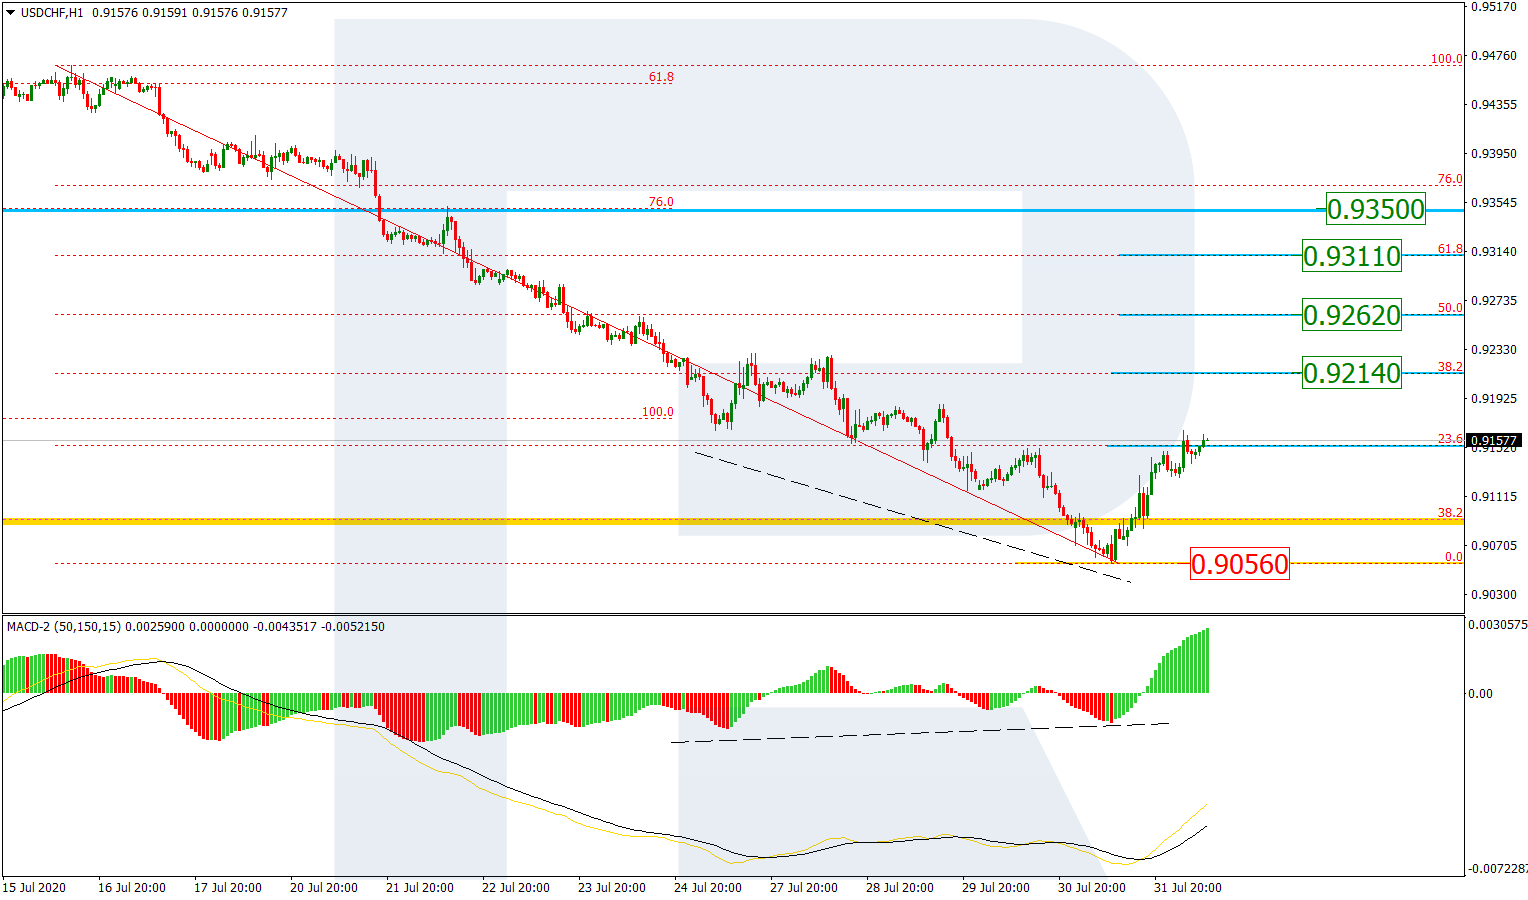
In the H1 chart, the convergence made the pair stop the descending wave and start a correction to the upside, which has already reached 23.6% fibo and may later continue towards 38.2%, 50.0%, and 61.8% fibo at 0.9214, 0.9262, and 0.9311 respectively. However, if the price breaks the low at 0.9056, the mid-term downtrend will continue.
Article By RoboForex.com
Attention!
Forecasts presented in this section only reflect the author’s private opinion and should not be considered as guidance for trading. RoboForex LP bears no responsibility for trading results based on trading recommendations described in these analytical reviews.

- The Eurozone has shown a significant slowdown in inflation. Australia has recorded its largest trade deficit since 2015 Jul 2, 2026
- Natural gas prices are rising amid increasing electricity consumption Jul 1, 2026
- USD/JPY at 40-Year High: Multiple Factors Weigh on the Yen Jul 1, 2026
- Gold Declines: Fed Policy and Geopolitics Weigh Jun 30, 2026
- Oil prices have once again risen above 70 dollars per barrel. The Australian dollar has updated a three‑month low Jun 30, 2026
- EUR/USD: The Advantage Remains with the Dollar Jun 29, 2026
- Escalation of the US–Iran conflict is once again supporting the rise in oil prices Jun 29, 2026
- Oil prices fall back to pre‑war levels. Silver drops to a 7‑month low Jun 25, 2026
- Gold Falls to an Eight-Month Low: This May Not Be the Bottom Jun 25, 2026
- Stock indices came under heavy selling pressure amid growing skepticism about AI investments Jun 24, 2026