GBPUSD Forex Trading Pivot Point Levels for 2014.05.08

2014.05.08 12:30 6:30AM ET | GBPUSD Currency Pair

SC GBPUSD 2014.05.08

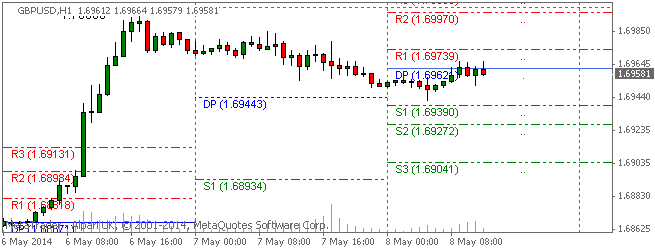
Here are the Pivot Points Levels with Support (S) and Resistance (R) for the GBPUSD currency pair today. Price action is currently trading right at the daily pivot point at the 1.69581 price level, according to data at 6:30 AM ET. The GBPUSD high for the day has been 1.69666 while the low of day has reached to 1.69425. The pair earlier today opened the Asian trading session below the daily pivot and has trended higher to the daily pivot area into the North American morning session.

Daily Pivot Point: 1.69621
— S1 – 1.69390
— S2 – 1.69272
— S3 – 1.69041
— R1 – 1.69739
— R2 – 1.69970
— R3 – 1.70088


Weekly Pivot Points: GBPUSD

SC GBPUSD 2014.05.08

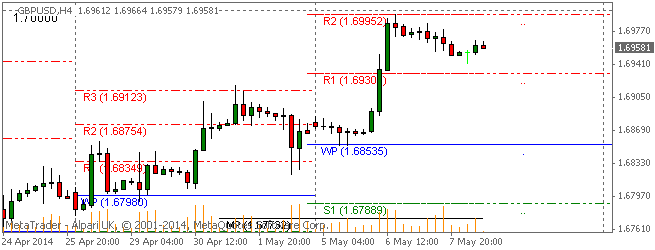
Prices are currently trading over the weekly pivot point and between the R1 and R2 resistance levels at time of writing. The GBPUSD has been on an overall bullish trend this week after opening the trading week modestly above the weekly pivot.

Weekly Pivot Point: 1.68535
— S1 – 1.67890
— S2 – 1.67118
— S3 – 1.66473
— R1 – 1.69307
— R2 – 1.69952
— R3 – 1.70724


By CountingPips.com – Forex Trading Apps & Currency Trade Tools

Disclaimer: Foreign Currency trading and trading on margin carries a high level of risk and volatility and can result in loss of part or all of your investment. All information and opinions contained do not constitute investment advice and accuracy of prices, charts, calculations cannot be guaranteed.


VIDEO: Future Of State-backed UK Lender RBS Set To Be Cleared Up

The future of Royal Bank of Scotland should become clearer on Friday, with Britain’s finance ministry expected to reveal if it wants the state-backed lender to be broken up. Bankers and political sources say the most likely outcome is that RBS, 81 percent-owned by the government, will agree to create an internal ‘bad bank’ to house more of its problem loans, with the government deciding against a formal break-up.

Our New Indicator: Automatic Fibonacci Retracements for Metatrader 4

By CountingPips.com

We are excited to announce that we have released our latest indicator for the Metatrader 4 platform: Automatic Fibonacci Retracements


usdjpy-Auto-Fibo-Levels

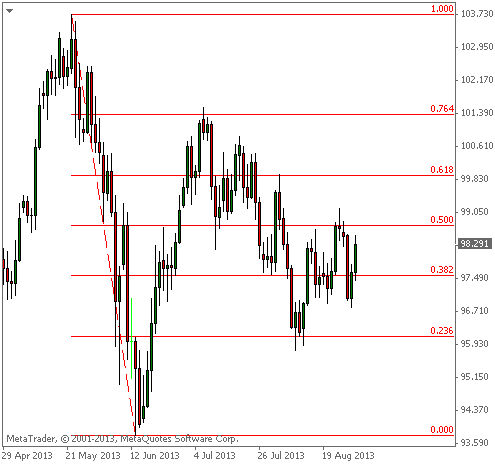
The standard Fibonacci Retracement indicator in the Metatrader 4 platform is great but it is static. Traders have to determine the trend, draw the indicator and update the chart when trends change.

This indicator was designed to do all that for you automatically – Automatic trend determination, plotted Fibonacci levels and updated retracements as price action changes.

There are user inputs for the number of periods to consider in drawing the fibonacci retracements as well as coloring and styling options. The indicator will update upon the completion of the latest bar or candle and a new retracement will be drawn when a new high or low is made over the chosen time-frame.

This is our fourth forex indicator for the MT4 platform and you can find our Automatic Fibonacci Indicator here. Our previous indicators include Pivot Point Levels, Linear Regression Channels and the High Low Support Resistance Indicator which all can be found in our Forex Apps section.

As always, we love to hear your feedback or suggestions for new indicators or apps that you may have (email us).


8 Largest Forex Trading Centers in the World

By CountingPips.com

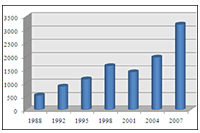
Forex market trading is truly a global phenomenon as well as the largest financial market in the world with over $4 trillion changing hands on a daily basis. Looking at the Forex Trading Global Turnovermost recent Bank of International Settlements foreign-exchange report, published every three years, we get a clear view of where most of the daily forex trading volume takes place. Many of the usual suspects like the UK and USA are found at the top of the list for the largest fx trading centers while others such as Singapore may be more surprising to many. Below is a list of the 8 largest forex trading centers in the world.

(Data from Bank of International Settlements (BIS) foreign-exchange report as of April 2010, All totals in US dollars)


1. United Kingdom – The UK and its financial center of London participate in the largest percentage of overall global forex daily trading volume of any geographical location. UK daily trading volume increased from 35 percent in 2007 to a total of 37 percent of the world’s overall trading volume in 2010, according to the BIS data. Total daily trading volume rose by just about 25 percent since 2007 when dollar volume equaled $1,483 billion to 2010 when volume stood at $1,854 billion per day. A more recent report has shown daily volume just passed the 2,000 billion mark in April 2011.

Financial Capital: London
Average Daily Trading Volume: $1,854 billion
Percentage of Daily Global Forex Volume: 37 %

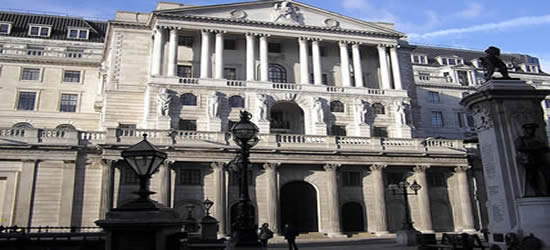
Bank of England


2. United States – The United States comes in second in daily trading volume and is the largest country on the list with over 300 million people. The US amounted to a total of 18 percent of the daily global forex volume in 2010 following a 17 percent share of the volume in 2007. The total dollar amount traded increased by approximately 20 percent to $904 billion a day in 2010 from a total of $745 billion in 2007.

Financial Capital: New York City
Average Daily Trading Volume: $904 billion
Percentage of Daily Global Forex Volume: 18 %

Wall Street


Get our Weekly Commitment of Traders Report: – See where the biggest traders (Hedge Funds and Commercial Hedgers) are positioned in the futures markets on a weekly basis.

Get Our Free Metatrader 4 Indicators – Put Our Free MetaTrader 4 Custom Indicators on your charts when you join our Weekly Newsletter


3. Japan – Japan is the third-largest forex trading center with a total of 6 percent of global foreign exchange turnover taking place in this country of 128 million people. Japan also amounted to 6 percent of the global turnover in 2007 following an 8 percent share in 2004. Total dollar amount of trading surged by over 20 percent from 250 billion in 2007 to a total of 312 billion in 2010.

Financial Capital: Tokyo
Average Daily Trading Volume: $312 billion
Percentage of Daily Global Forex Volume: 6 %

Japan-Tokyo


4. Singapore – Singapore is up next with a total of 5 percent of the world’s daily forex trading volume. This small country of roughly 5 million people averaged $266 billion of total daily volume in 2010. This was an increase from a total of $242 billion in 2007 which accounted for 6 percent of the overall global forex trade.

Financial Capital: Singapore
Average Daily Trading Volume: $266 billion
Percentage of Daily Global Forex Volume: 5 %

Singapore


5. Switzerland – Switzerland was the fifth-largest forex trading center in 2010 with 5 percent of the total global volume which was small a decrease from 2007 when it accounted for 6 percent of daily volume. This European country of roughly 8 million people is famous for its banking sector and is one of the richest countries in the world on a GDP per capita basis. Total daily volume increased to $263 billion in 2010 from a total of $254 billion in 2007.

Financial Capital: Zurich, Geneva
Average Daily Trading Volume: $263 billion
Percentage of Daily Global Forex Volume: 5 %

Switzerland


6. Hong Kong – Hong Kong follows Switzerland as the sixth largest trading center in 2010 with approximately 5 percent of forex daily trade volume. This is an increase from 4 percent in 2007 for this city-state on the southern coast of China which has an estimated population of 7 million people. Hong Kong’s total daily volume averaged $238 billion in 2010 which was over a 30 percent increase from 2007.

Financial Capital: Hong Kong
Average Daily Trading Volume: $238 billion
Percentage of Daily Global Forex Volume: 5 %

Hong Kong


7. Australia – Australia is next on the list with a 4 percent share of total forex daily volume which matches its 2007 volume share. Overall trading volume grew right around 9 percent from a total of $176 billion in 2007 to a total of $192 billion in 2010.

Financial Capital: Sydney
Average Daily Trading Volume: $192 billion
Percentage of Daily Global Forex Volume: 4 %

Sydney-Australia


8. France – Number eight on our list with right around a 3 percent share of the daily forex trading volume is France with its financial center of Paris. France also amounted to 3 percent of the daily global forex trade in 2007 and saw its daily total volume rise by roughly 20 percent from a total of $127 billion in 2007 to a total of $152 billion in 2010.

Financial Capital: Paris
Average Daily Trading Volume: $152 billion
Percentage of Daily Global Forex Volume: 3 %

Paris


GBP/USD Drifts Lower as Investors Digest Dubai

By Fast Brokers – As with the EUR/USD, the GBP/USD recovered well from Friday lows considering the uncertainty surrounding Dubai’s debt situation.  Although analysts are still trying to clarify the details of what has occurred, the Cable managed to piece together a solid rally back above our 1st tier uptrend line.  However, the GBP/USD is drifting lower again after the bounce topped off at our 2nd tier downtrend line and 10/29 highs.  The Pound is still experiencing relative weakness, highlighted by today’s solid performance thus far by the EUR/GBP.  The Pound’s weakness stems from both GfK Consumer Confidence and Net Lending to Individuals printing below analyst expectations.  Additionally, BoE Governor King’s latest comments regarding the central bank’s present monetary stance were a bit more opaque than what investors were looking for.  As a result, the Cable is being dragged lower while investors figure out where to send this market as the Dubai situation unfolds.

Meanwhile, the data train will keep on rolling with China’s Manufacturing PMI late Monday EST followed by the RBA’s monetary policy decision.  A strong China PMI number coupled with a hawkish stance by the RBA could help turn the Cable and the risk trade around.  Britain will release Manufacturing PMI data of its own on Tuesday coupled with Nationwide and HPI numbers.  Nationwide was recently a bit cautious concerning its outlook for UK housing prices in 2010, therefore it will be interesting to see how tomorrow’s HPI release turns out.

Technically speaking, the Cable’s more critical technical levels seem to be previous November lows along with our 1st tier uptrend line.  Hence, the Cable’s pop from Friday lows have helped create some breathing room to the downside.  Our 1st tier uptrend line runs through October lows, meaning a failure of our 1st tier could potentially result in a retracement towards the 1.57 area.  As for the topside, the Cable faces multiple downtrend lines along with 11/25 highs and the psychological level of 1.65.  Hence, there are quite a few near-term topside obstacles, and the immediate-term goal for bulls will likely be continued stabilization with a topside preference.

Present Price: 1.6446

Resistances: 1.6468, 1.6489, 1.6532, 1.6568, 1.6596, 1.6634, 1.6673

Supports: 1.6409, 1.6359, 1.6327, 1.6301, 1.6285, 1.6251, 1.6235

Psychological: 1.65, November Lows and Highs

Market Commentary provided by Fast Brokers.

Disclaimer: FastBrokers’ market commentary is provided for information purposes only and under no circumstances should be regardedneither as an investment advice nor as a solicitation or an offer to sell/buy any financial product. FastBrokers assumes no responsibility or liability from gains or losses incurred by the information herein contained.

Risk Disclosure: There is a substantial risk of loss in trading futures and foreign exchange. Please carefully review all risk disclosure documents before opening an account as these financial instruments are not appropriate for all investors.

USD/JPY Freefall Bottoms Out

By Anton Eljwizat -The USD/JPY pair has experienced much bearishness in the last few days as it currently trades at 86.30. The current bearish trend is expected to come to an end anytime soon, and a bullish correction may be in the making. I will illustrate below that the USD/JPY may very well be heading for a reversal. Traders are strongly advised to take advantage of the trend at an early stage.

• The chart below is the USD/JPY daily chart by ForexYard.

• The indicators used are the Slow Stochastic and RSI.

• Point 1: There is a “doji” candlestick that has formed on the chart, indicating that a reversal should take place.

• Point 2: The Slow Stochastic indicates a bullish cross, signaling that the next move may be in an upward direction.

• Point 3: The RSI is testing the lower border at the 0 mark, which may signal an upward movement is going to occur in the near future.

USD/JPY Daily Chart

Forex Market Analysis provided by Forex Yard.

© 2006 by FxYard Ltd

Disclaimer: Trading Foreign Exchange carries a high level of risk and may not be suitable for all investors. There is a possibility that you could sustain a loss of all of your investment and therefore you should not invest money that you cannot afford to lose. You should be aware of all the risks associated with Foreign Exchange trading.

US Home Prices see new record drop. US Dollar mixed in Forex Trading. NZ Kiwi drops.

Home prices in the U.S. continue to decline as the Standard & Poors/Case-Shiller index released today showed that home prices fell new record amounts in January when compared to a year prior.

The S & P’s/Case-Shiller Home Price Index measures sale prices of existing single-family homes nationally and tracks 10-city and 20-city composite home price measurements. The January house prices report showed that the 20-city composite index fell a record annual amount of 19.0 percent in January while the 10-city composite index also fell a new record 19.4 percent compared to last year.

The areas hardest hit on an annual basis were Phoenix, Las Vegas and San Francisco with annual declines of 35.0 percent, 32.5 percent and 32.4 percent, respectively. On an annual basis, none of the 20 metropolitan areas measured have shown house price increases with Dallas being the area with the lowest annual decline at 4.9 percent.

On a monthly basis from December to January, Phoenix registered the largest house price decline with a fall of 5.5 percent while Charlotte and New York registered the smallest declines for the month with each falling 1.2 percent.

David M. Blitzer, Chairman of the Index Committee at S & P, commented in the report, “Home prices, which peaked in mid-2006, continued their decline in 2009,” and that “There are very few bright spots that one can see in the data. Most of the nation appears to remain on a downward path, with all of the 20 metro areas reporting annual declines, and nine of the MSA’s falling more than 20% in the last year. Indeed, the two composites are very close to that rate and have been reporting consecutive annual record declines since October 2007. The monthly data follows a similar trend, with the 10-City and 20-City Composite showing thirty consecutive months of negative returns.”

US Dollar mixed in forex trading. NZD falls sharply.

The U.S. dollar has been mixed in forex trading against the major currencies today on the last day of the first quarter.

The euro has gained versus the dollar as the EUR/USD has edged up from today’s 1.3257 opening exchange rate at 00:00 GMT to trading at approximately 1.3267 near the end of the US trading session at 4:28pm EST according to currency data by Oanda.

The British pound has advanced slightly today versus the American currency from 1.4314 to trading at 1.4336 dollars per pound. The dollar has advanced gained against the Japanese yen today as the USD/JPY has gained from its 98.32 opening to trading at 98.87.

The dollar has also gained against the Canadian dollar after opening at 1.2570 earlier today to trading at 1.2626. Meanwhile, the USD has declined against the Swiss franc from 1.1451 to trading at 1.1387.

The Australian dollar has gained ground verses the USD as the AUD/USD trades at 0.6907 after opening today at 0.6884.

The New Zealand kiwi dollar came crashing down versus the USD late in the day because New Zealand Reserve Bank Governor Alan Bollard released a statement that expressed his “concern over the recent strength of long-term wholesale interest rates.”

Bollard said, “As we said in our 12 March Monetary Policy Statement, the economic recovery is expected to be very gradual.  Furthermore, the risks around the outlook continue to be weighted to the downside. In these circumstances we believe the rise in longer-term interest rates is unwarranted and inconsistent with the monetary policy outlook. As indicated in our March Statement, we are projecting interest rates to remain at relatively low levels for an extended period.”

The NZD dropped approximately 100 pips in less than an hour and now the NZD/USD trades around the 0.5603 level after opening the day at 0.5686.

NZD/USD Chart – The New Zealand kiwi spiking lower late in the day versus the USD in forex trading after Reserve Bank Governor Alan Bollard reiterated his view that interest rates in New Zealand would stay low for some time.

3-31nzdusd

Read more at our finance blog.