Archive for Forex and Currency News – Page 344

Calmer seas on Friday the 13th?

By Han Tan, Market Analyst, ForexTime

Asian stocks are mostly tracking Thursday’s declines on Wall Street, with most US and European equity futures edging lower at the time of writing. The VIX is now around its lowest levels since August, while the VIX futures have returned to pre-pandemic levels. Meanwhile, volatility in the currency markets around the world has reached a near 4-month low, as measured by the J.P. Morgan Global FX Volatility Index.

Market sentiment is merely bobbing about amid the cross currents in global financial markets, with investors awaiting the next gust of wind that could bring them further into risk-on waters. Monday’s post-US elections cheer and vaccine optimism have clearly ebbed, with market participants now facing a tepid end to the trading week.

Central banks urge cautious optimism

That isn’t to say that investors have nary a care in the world; there are dangerous undercurrents lurking below the surface. The persistent concerns over the state of the global economy, given the alarming resurgence of Covid-19 cases across major economies, from the US to Japan, have given risk-appetite reason to pause.

Investors should pay heed to the words of caution from some of the world’s most influential central banks, namely the Fed, ECB, and the BOE, whose chiefs have just warned against getting too excited about what a vaccine could actually contribute to the global economic recovery. The vaccine, when it reaches the world, may not be potent enough to immediately heal the mental scars left by the pandemic. Such an outlook suggests that more concerted monetary and fiscal support may be required in order to facilitate a full global economic recovery, with a longer runway potentially needed before marking such an event. Investors’ fears that this Covid-19 resurgence across major economies could derail their fledgling recovery are keeping safe havens well bid, with the Dollar index not straying far from the 93.0 mark for now.

Gold set to form death cross

Speaking of safe havens, a traditional pillar of this asset class appears to be falling out of favour. Gold prices are set to form a death cross, with its 50-day simple moving average about to move below its 100-day counterpart. Such a technical episode may herald further declines in the precious metal.

However, with US Treasury yields essentially halving its advance from the first half of the week and pulling further below the psychologically-important 1% level, it allows Bullion some breathing space for now.

Still, Bullion bulls are at risk of being left at the altar, waiting on more significant policy signals as to how US inflationary pressures will be boosted. Given that Thursday’s release of the October US CPI prints came in below market expectations, Gold may find itself on a softer footing, curtailing attempts to push higher from current levels.

Unless Friday the 13th lives up to superstitions and investors are blindsided by an “unlucky” event, it’s set to be a ho-hum day in global markets.


Disclaimer: The content in this article comprises personal opinions and should not be construed as containing personal and/or other investment advice and/or an offer of and/or solicitation for any transactions in financial instruments and/or a guarantee and/or prediction of future performance. ForexTime (FXTM), its affiliates, agents, directors, officers or employees do not guarantee the accuracy, validity, timeliness or completeness, of any information or data made available and assume no liability as to any loss arising from any investment based on the same.


Forex-Time-LogoArticle by ForexTime

ForexTime Ltd (FXTM) is an award winning international online forex broker regulated by CySEC 185/12 www.forextime.com


Take a breath everyone…

By Lukman Otunuga, Research Analyst, ForexTime

After a tumultuous week, it seems equity markets are pausing for some respite and trying to take stock of what has gone on over the last few sessions. (S&P500 up 10+% since the end of October!) Sadly, the positive vaccine news is now getting overshadowed by the near-term reality of virus cases increasing fast, as the US daily case rate runs to 135k per day. The potential for more lockdowns across the pond is clear and with it the near-term hit to the economy.

While the market appetite for risk is checked, King Dollar is only losing out to the classic safe haven currencies of the Yen and Swiss. Weekly US jobless figures came in better than expected but still remain elevated, while inflation figures have fallen again and printed unchanged in October, snapping four straight months of increases, though the pace has been slowing.

Momentum of the move higher in the Dollar after the bounce from strong support at 92 has slowed with the 20-day Moving Average capping the push north.

Gold continues to find support above major support at $1850 with eyes firmly on US bond yields and the all-important 1% level. Interestingly, ETF investors have maintained their exposure over the last month or so with no signs of this bullish trade letting up.

Ugly ‘shooting star’ in US stocks?

After this week’s thrills and spills of stock rotation and a broader rally, with the S&P500 making new highs, bulls are endeavouring to consolidate their positions above previous highs in September and October. We mentioned some weeks ago about the formation of a double top and prices did drop to the lower part of that pattern towards the end of last month, before bouncing off the support above 3,200.

We are now on those highs again and it can be helpful to change timeframes when looking for the next big move. In this instance, the weekly chart is showing the potential for a bearish candlestick pattern if the index remains below 3,600. That the Eurostoxx 50 has also paused at the previous cycle highs from July and the 200-day Moving Average is instructive too. The weekly closes look like they will be worth paying some attention tomorrow!

Sterling not so strong today

News, or lack of, is hurting the Pound today as Sunday’s deadline for a Brexit trade deal has seemingly not been enough to bang heads together. Pressure on both sides to compromise on key matters and break the deadlock has been insufficient. It seems pretty clear that more time is needed and yet the narrow legislative timeline gives very little room for manoeuvre, with the UK set to operate under WTO rules from 1st January. That said, 2020 does have form in postponing major events!

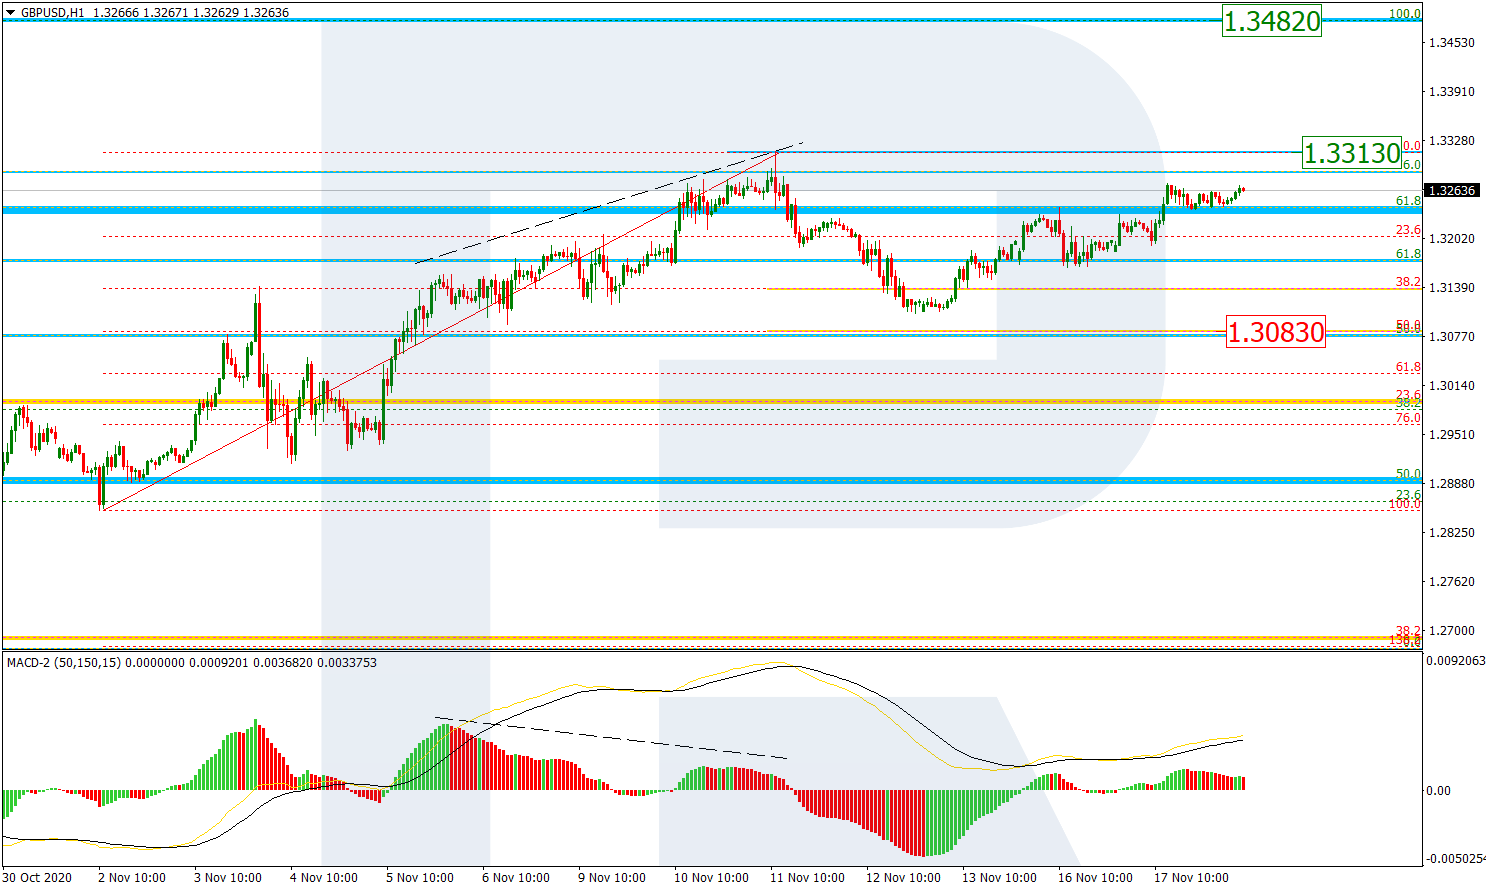
GBP/USD is now lower on the week and bulls would desperately like to hold on to the October high and the 61.8% Fib level from the high/low in September at 1,3176. Next support looks to be around the big figure at 1.31.

Disclaimer: The content in this article comprises personal opinions and should not be construed as containing personal and/or other investment advice and/or an offer of and/or solicitation for any transactions in financial instruments and/or a guarantee and/or prediction of future performance. ForexTime (FXTM), its affiliates, agents, directors, officers or employees do not guarantee the accuracy, validity, timeliness or completeness, of any information or data made available and assume no liability as to any loss arising from any investment based on the same.


Forex-Time-LogoArticle by ForexTime

ForexTime Ltd (FXTM) is an award winning international online forex broker regulated by CySEC 185/12 www.forextime.com
Ichimoku Cloud Analysis 12.11.2020 (AUDUSD, EURUSD, XAUUSD)

Article By RoboForex.com

AUDUSD, “Australian Dollar vs US Dollar”

AUDUSD is trading at 0.7261; the instrument is moving below Ichimoku Cloud, thus indicating a descending tendency. The markets could indicate that the price may test the cloud’s downside at 0.7280 and then resume moving downwards to reach 0.7165. Another signal in favor of further downtrend will be a rebound from the upside border of the Triangle pattern. However, the bearish scenario may no longer be valid if the price breaks the cloud’s upside border and fixes above 0.7315. In this case, the pair may continue growing towards 0.7405. To confirm further decline, the asset must break the pattern’s downside border and fix below 0.7235.

AUDUSD
Risk Warning: the result of previous trading operations do not guarantee the same results in the future

EURUSD, “Euro vs US Dollar”

EURUSD is trading at 1.1764; the instrument is moving below Ichimoku Cloud, thus indicating a descending tendency. The markets could indicate that the price may test the cloud’s downside at 1.1785 and then resume moving downwards to reach 1.1665. Another signal in favor of further downtrend will be a rebound from the descending channel’s upside border. However, the bearish scenario may be canceled if the price breaks the cloud’s upside border and fixes above 1.1865. In this case, the pair may continue growing towards 1.1945.

EURUSD
Risk Warning: the result of previous trading operations do not guarantee the same results in the future

XAUUSD, “Gold vs US Dollar”

XAUUSD is trading at 1869.00; the instrument is moving below Ichimoku Cloud, thus indicating a descending tendency. The markets could indicate that the price may test the cloud’s downside at 1875.00 and then resume moving downwards to reach 1805.00. Another signal in favor of further downtrend will be a rebound from the upside border of a Triangle pattern. However, the bearish scenario may no longer be valid if the price breaks the cloud’s upside border and fixes above 1920.00. In this case, the pair may continue growing towards 1960.00.

XAUUSD

Article By RoboForex.com

Attention!
Forecasts presented in this section only reflect the author’s private opinion and should not be considered as guidance for trading. RoboForex LP bears no responsibility for trading results based on trading recommendations described in these analytical reviews.

Japanese Candlesticks Analysis 12.11.2020 (GOLD, NZDUSD, GBPUSD)

Article By RoboForex.com

XAUUSD, “Gold vs US Dollar”

As we can see in the H4 chart, the instrument is quickly falling within the ascending tendency. After forming several reversal patterns, such as Harami, close to the support area, XAUUSD is expected to reverse and rebound from the channel’s downside border due to a strong rising tendency. In this case, the upside target will be the resistance area at 1945.00. At the same time, an opposite scenario implies that the price may start another decline to reach the support area at 1840.00 before resuming its ascending tendency.

XAUUSD
Risk Warning: the result of previous trading operations do not guarantee the same results in the future

NZDUSD, “New Zealand vs. US Dollar”

As we can see in the H4 chart, the instrument continues growing. After forming several reversal patterns, such as Hanging Man, not far from the resistance area, NZDUSD may reverse and form a slight correction towards 0.6805. After finishing this pullback, the pair may resume trading upwards to reach the resistance area at 0.6935.

NZDUSD
Risk Warning: the result of previous trading operations do not guarantee the same results in the future

GBPUSD, “Great Britain Pound vs US Dollar”

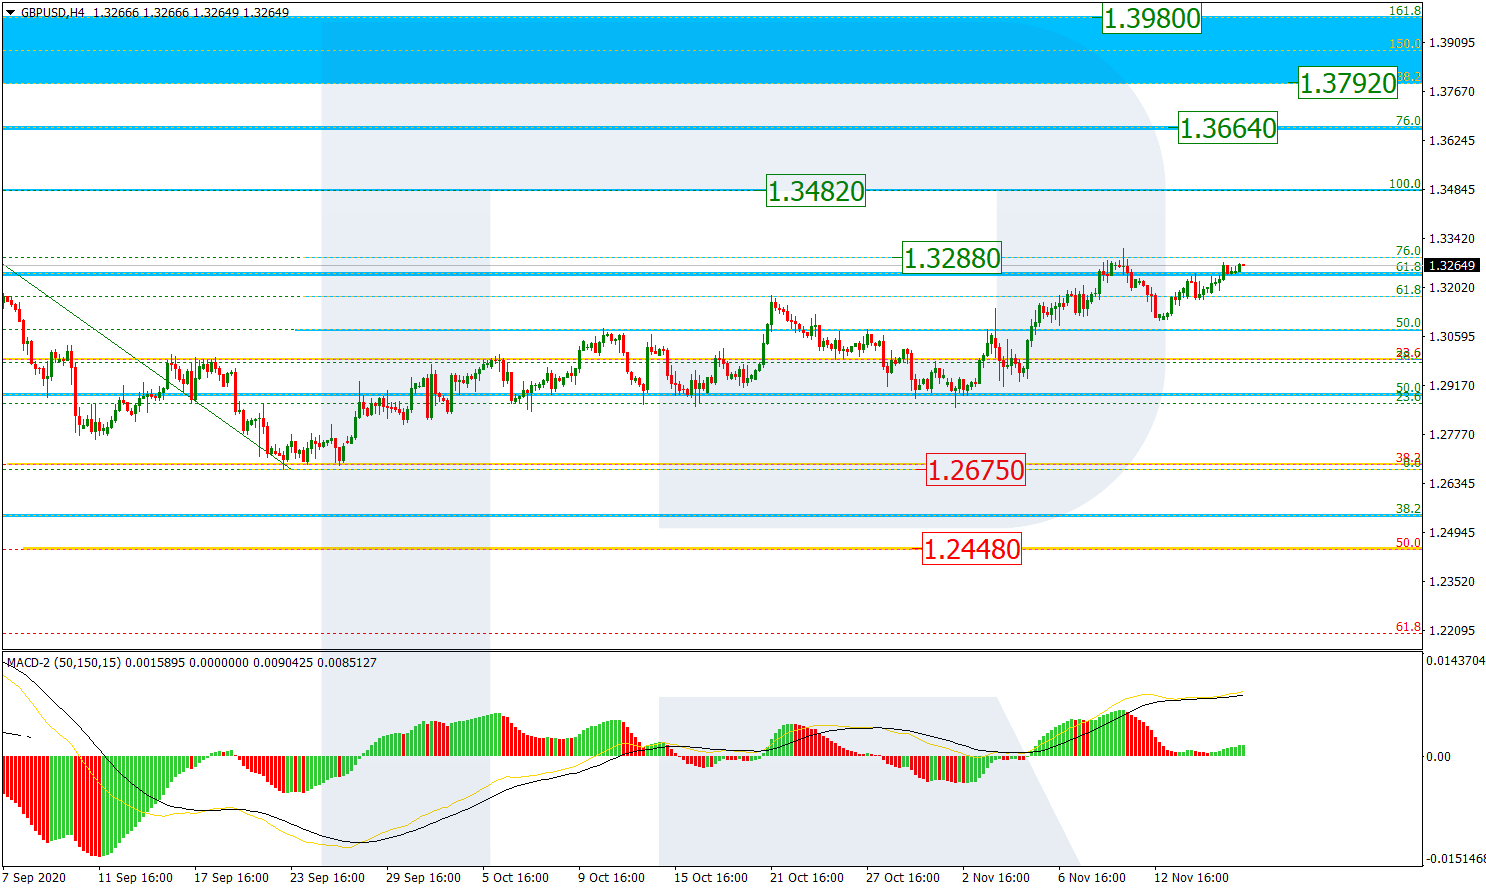
As we can see in the H4 chart, the instrument is still correcting within ascending tendency. By now, GBPUSD has formed several reversal patterns, such as Shooting Star not far from the resistance area. At the moment, the pair is correcting and may reach 1.3125. Later, the market may rebound from this level and resume trading upwards. In this case, the upside target will be at 1.3370.

GBPUSD

Article By RoboForex.com

Attention!
Forecasts presented in this section only reflect the author’s private opinion and should not be considered as guidance for trading. RoboForex LP bears no responsibility for trading results based on trading recommendations described in these analytical reviews.

EURUSD Gives Back Monday’s Gains

By Orbex

EURUSD Gives Back Monday’s Gains

The euro’s failure at the 1.1900 level is pushing price action lower.

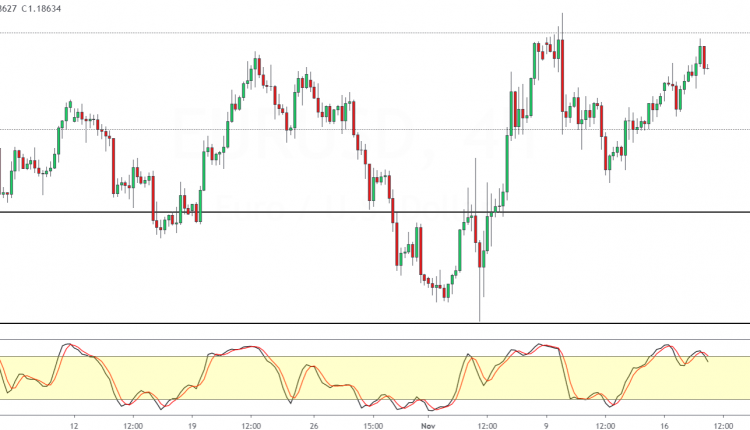
At the time of writing, the common currency is trading near the 1.1800 level. With the trend line and the horizontal support area, price action could be moving into a tight consolidation.

However, the Stochastics oscillator is oversold. Unless it moves further into the oversold levels, the EURUSD could be looking to rebound from the 1.1800 level.

This will keep prices trading flat between the 1.1800 and 1.1900 levels for the near term.

To the downside, the risks of a breakout are higher.

If the euro loses the 1.1800 support, then we expect a move back to the 1.1715 level next.

GBPUSD Advances Slightly Higher

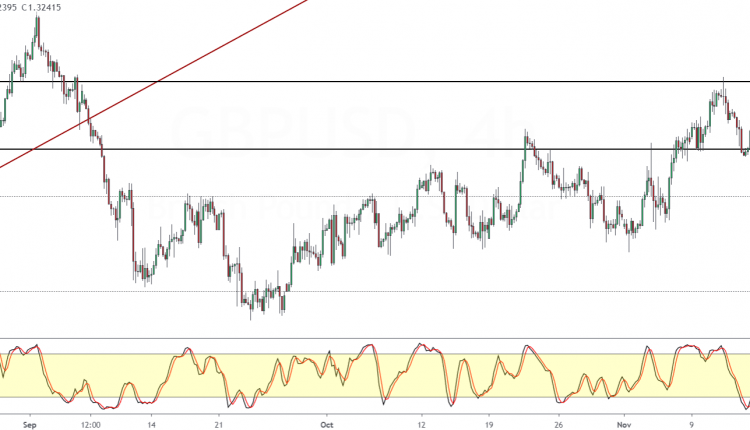
The British pound sterling is looking to build upon the gains from Monday.

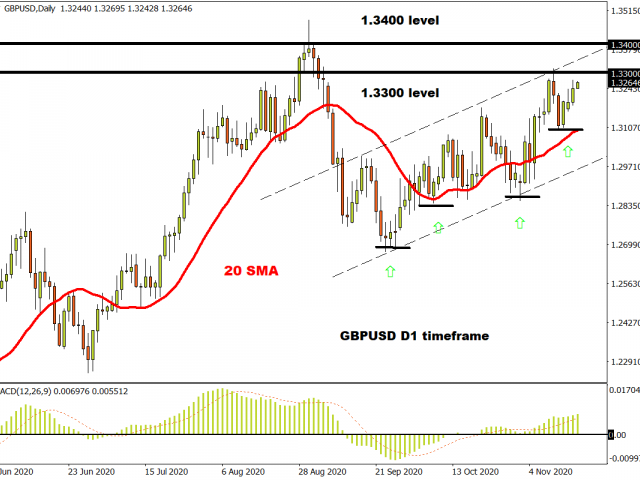
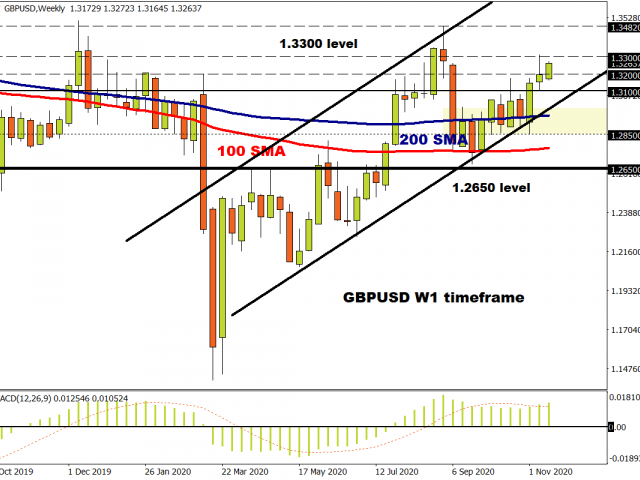
However, as price approaches the 1.3300 handle, the momentum is losing steam. This could see prices pulling back in the near term.

Any downside declines will be firmly stalled near the 1.3122 level of support.

This could mean that the GBPUSD might settle into a sideways range between the said levels for the moment, given the psychological importance of the 1.3300.

To the downside, in the event of prices failing near the 1.3122 level, we could see a decline back to the 1.3000 support area.

For the moment, the Stochastics oscillator is likely to signal a short term pullback from the current highs.

Crude Oil Attempts To Break Past 41.00 Handle Again

Oil prices pulled back after testing the technical resistance area near 41.00 on Tuesday.

However, oil recouped the bullish momentum, and the commodity is now attempting to break past this psychological barrier.

A strong breakout above 41.00 could breathe some fresh air for the oil markets, which have been stuck in a strong sideways range.

With the market sentiment likely to linger on, there is scope for oil prices to break past this level.

Above 41.00, support will need to form in order to confirm further upside. This will put the next key level near 43.50 into focus.

Gold Rises After Monday’s Declines

The precious metal is trading about 1% higher on Tuesday.

The gains came after price action fell to the 1850 level briefly. With traders rejecting prices near this level, gold prices made a modest bounce to the upside.

Despite the modest gains in comparison to Monday’s fall, gold prices could be looking to settle into a range.

The upside will once again be challenged near the 1911.50 – 1900.00 level of resistance.

To the downside, the 1850 level is firmly established as strong support level.

Only a breakout from either of these levels will determine the next direction in the commodity.

By Orbex

Murrey Math Lines 11.11.2020 (USDJPY, USDCAD)

Article By RoboForex.com

USDJPY, “US Dollar vs. Japanese Yen”

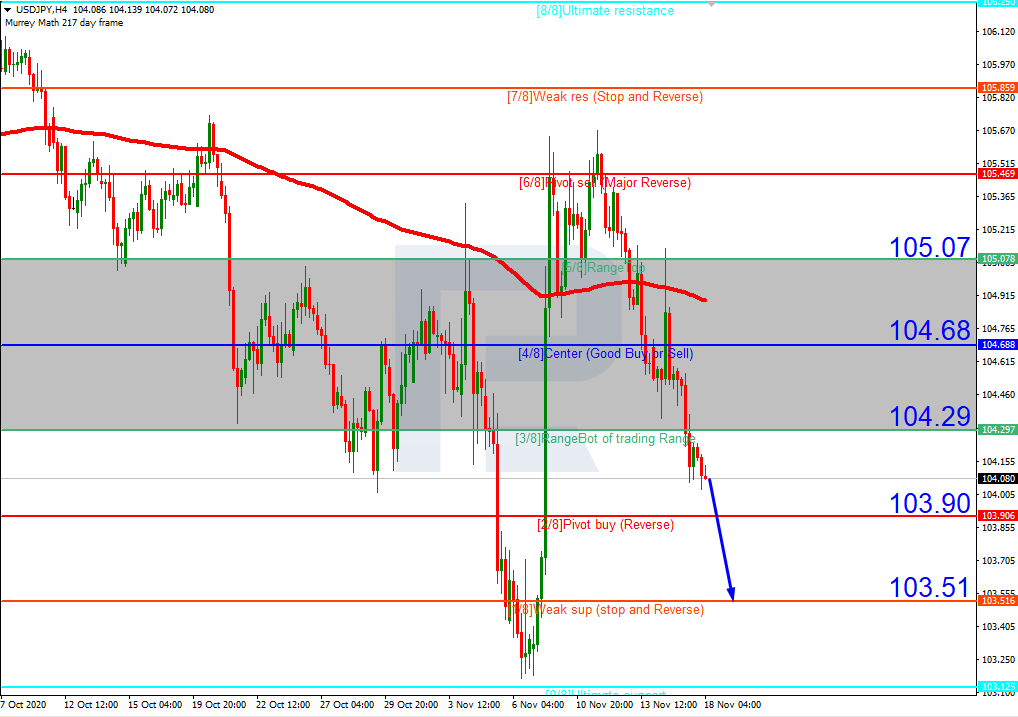
In the H4 chart, after breaking 5/8, USDJPY is moving above the 200-day Moving Average, thus indicating a possible ascending tendency. In this case, the price is expected to continue growing towards 105.85. However, this scenario may no longer be valid if the price breaks 5/8 to the downside. After that, the instrument may continue falling to reach the support at 4/8.

USDJPY_H4
Risk Warning: the result of previous trading operations do not guarantee the same results in the future

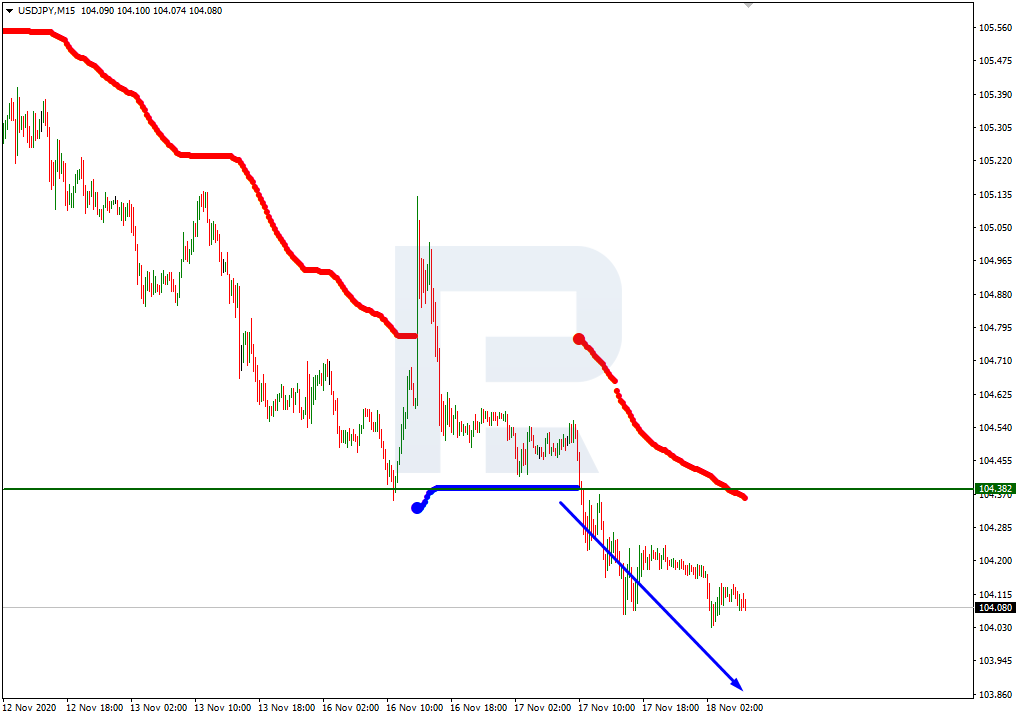
As we can see in the M15 chart, the pair has broken the upside line of the VoltyChannel indicator and, as a result, may continue moving upwards.

USDJPY_M15
Risk Warning: the result of previous trading operations do not guarantee the same results in the future

USDCAD, “US Dollar vs Canadian Dollar”

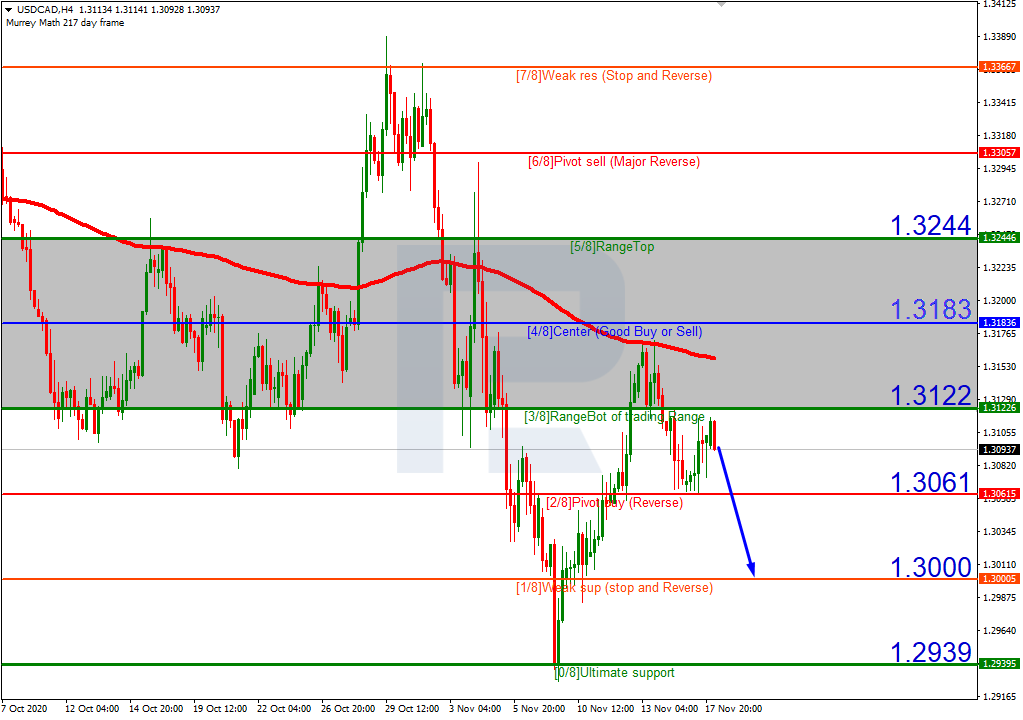
As we can see in the H4 chart, USDCAD is moving below the 200-day Moving Average but the asset rebounded from 0/8 several days ago. In this case, the pair is expected to correct towards 3/8. Still, this scenario may no longer be valid if the price breaks 1/8 to the downside. After that, the instrument may continue moving downwards to reach the support at 0/8.

USDCAD_H4
Risk Warning: the result of previous trading operations do not guarantee the same results in the future

In the M15 chart, the pair may break the upside line of the VoltyChannel indicator and, as a result, continue trading upwards.

USDCAD_M15

Article By RoboForex.com

Attention!
Forecasts presented in this section only reflect the author’s private opinion and should not be considered as guidance for trading. RoboForex LP bears no responsibility for trading results based on trading recommendations described in these analytical reviews.

Forex Technical Analysis & Forecast 11.11.2020

Article By RoboForex.com

EURUSD, “Euro vs US Dollar”

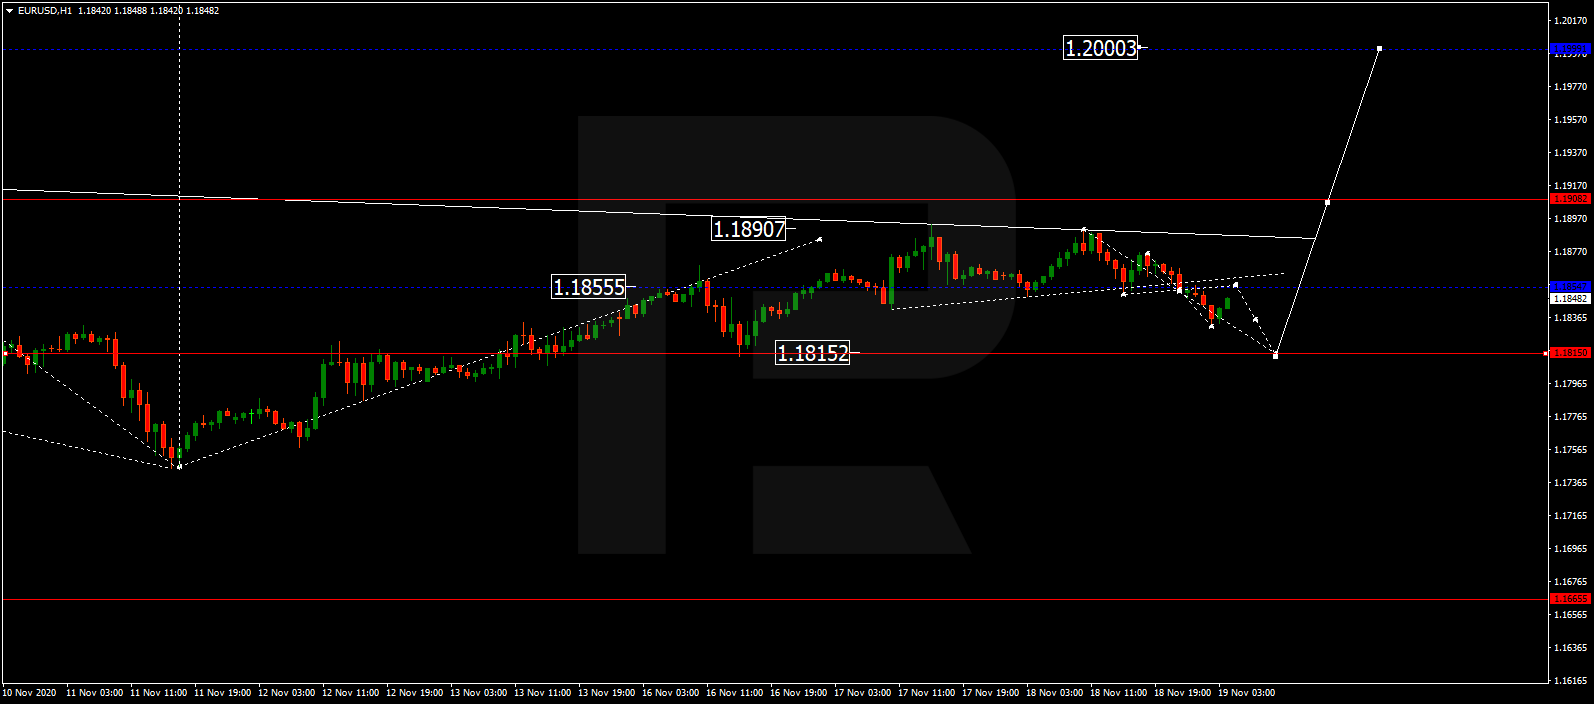
EURUSD is still consolidating around 1.1818. Possibly, today the pair may grow towards 1.1860 and then form a new descending structure to reach 1.1760. After that, the instrument may start another growth to break 1.1860 and then continue trading upwards with the target at 1.1944.

EURUSD
Risk Warning: the result of previous trading operations do not guarantee the same results in the future

GBPUSD, “Great Britain Pound vs US Dollar”

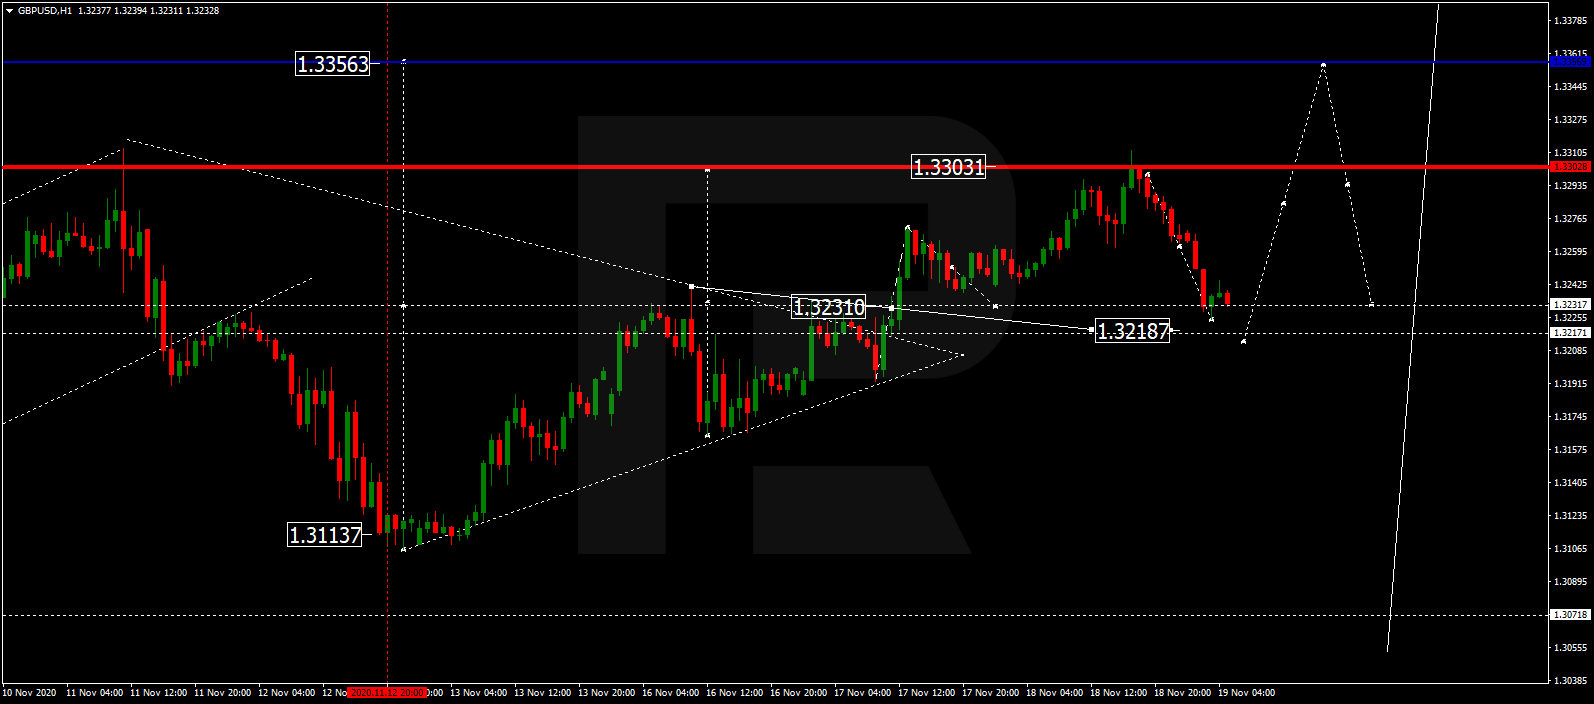
After finishing the ascending structure at 1.3232, GBPUSD is still consolidating around this level; right now, it is trading to break the range to the upside. Possibly, the pair may grow to reach 1.3360 and then start a new correction towards 1.3240. After that, the instrument may form one more ascending structure with the target at 1.3379.

GBPUSD
Risk Warning: the result of previous trading operations do not guarantee the same results in the future

USDRUB, “US Dollar vs Russian Ruble”

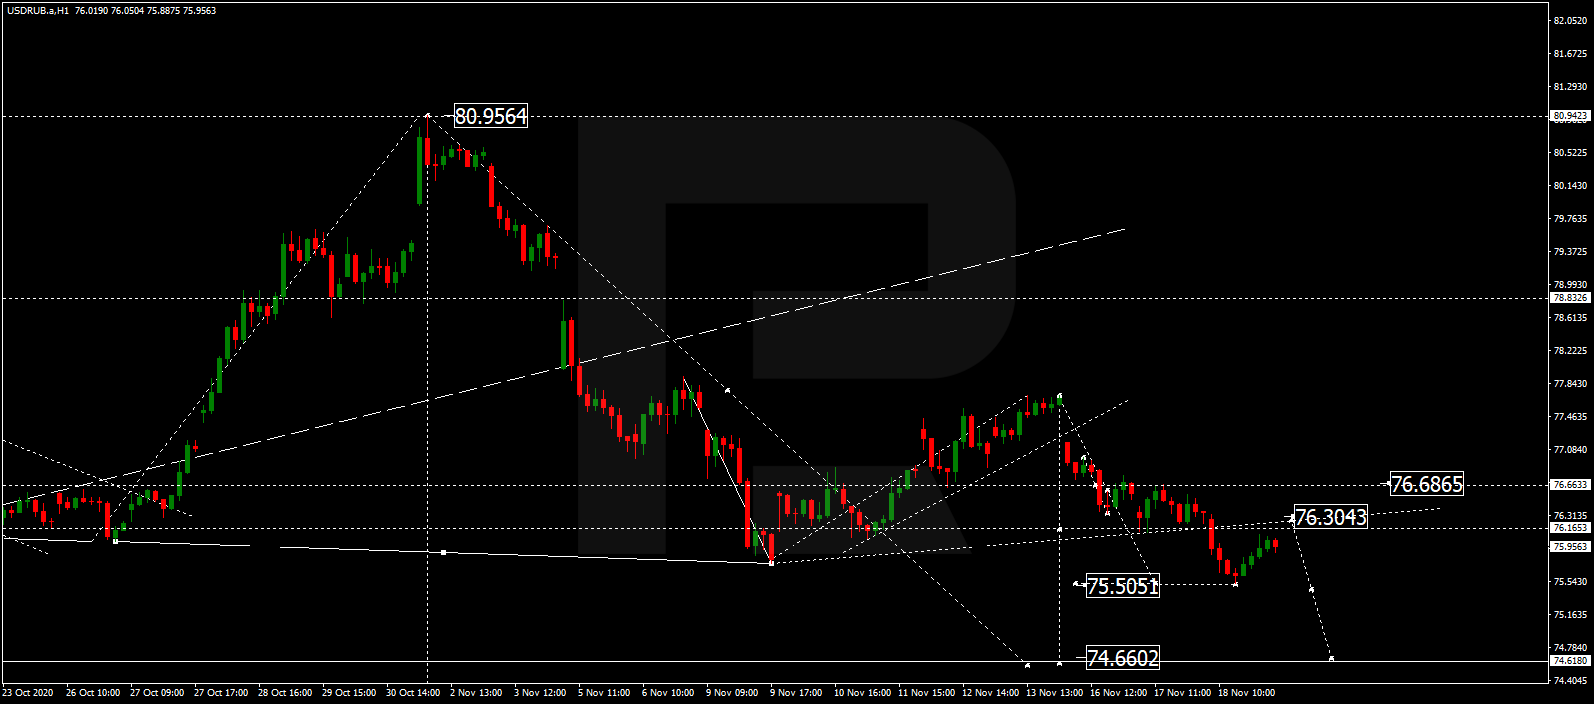
After finishing the ascending structure at 76.86, USDRUB is expected to fall towards 76.26, thus forming a new consolidation range between these two levels. If later the price breaks this range to the upside, the market may start another correction to reach 77.77; if to the downside – resume trading downwards to extend the descending wave with the target at 74.77.

USDRUB
Risk Warning: the result of previous trading operations do not guarantee the same results in the future

USDJPY, “US Dollar vs Japanese Yen”

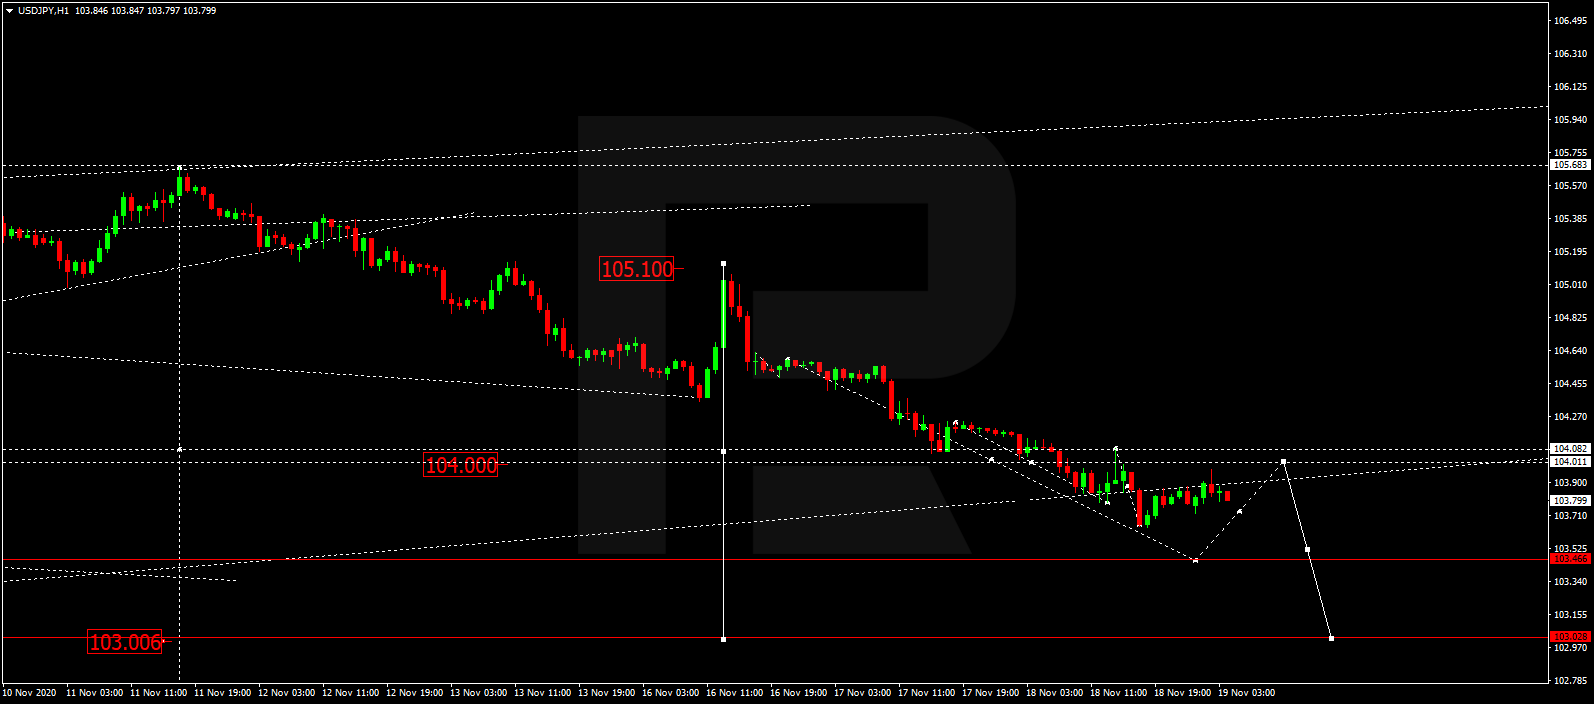
USDJPY has finished the descending impulse at 104.80 along with the correction towards 105.45, thus forming a new consolidation range between these two levels. If later the price breaks this range to the downside, the market may resume trading downwards with the target at 104.34.

USDJPY
Risk Warning: the result of previous trading operations do not guarantee the same results in the future

USDCHF, “US Dollar vs Swiss Franc”

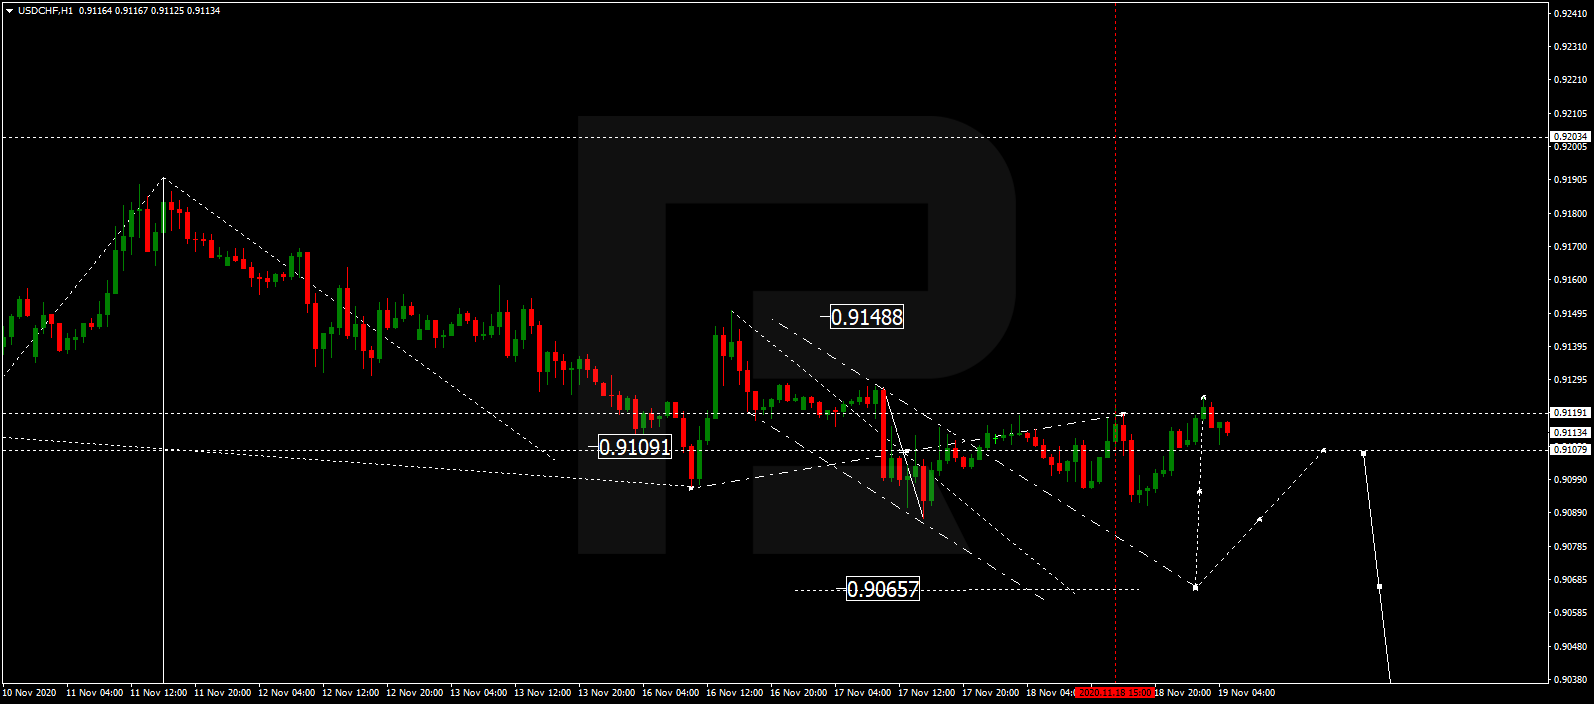
USDCHF is consolidating around 0.9141. Today, the pair may fall to reach 0.9122 and then start another growth towards 0.9178. Later, the market may resume moving downwards with the target at 0.9048.

USDCHF
Risk Warning: the result of previous trading operations do not guarantee the same results in the future

AUDUSD, “Australian Dollar vs US Dollar”

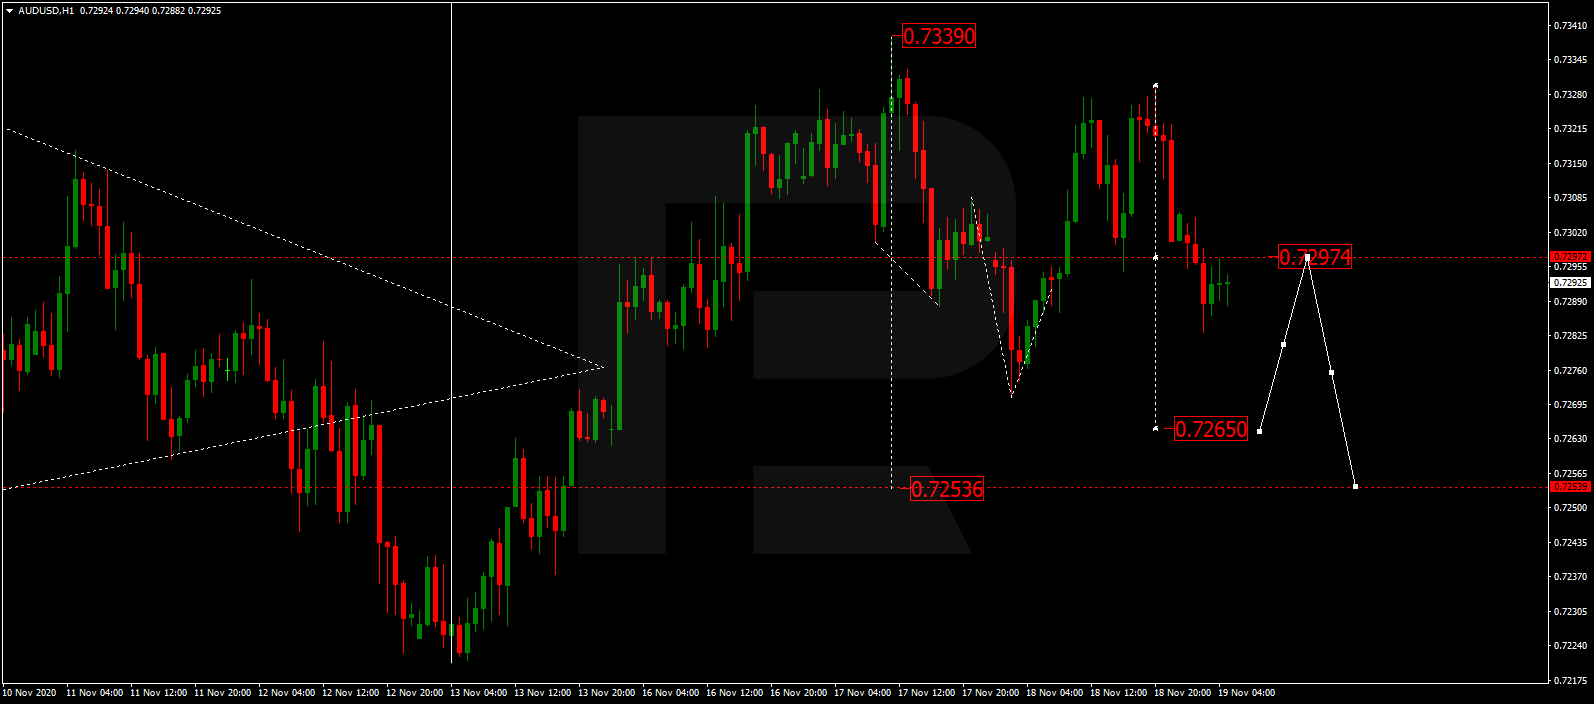
After forming a new consolidation range around 0.7292, AUDUSD is expected to fall towards 0.7245 and may later grow to return to 0.7292, thus forming a new consolidation range between these levels. If later the price breaks this range to the upside, the market may form one more ascending structure to reach 0.7333; if to the downside – start a new correction with the target at 0.7150.

AUDUSD
Risk Warning: the result of previous trading operations do not guarantee the same results in the future

BRENT

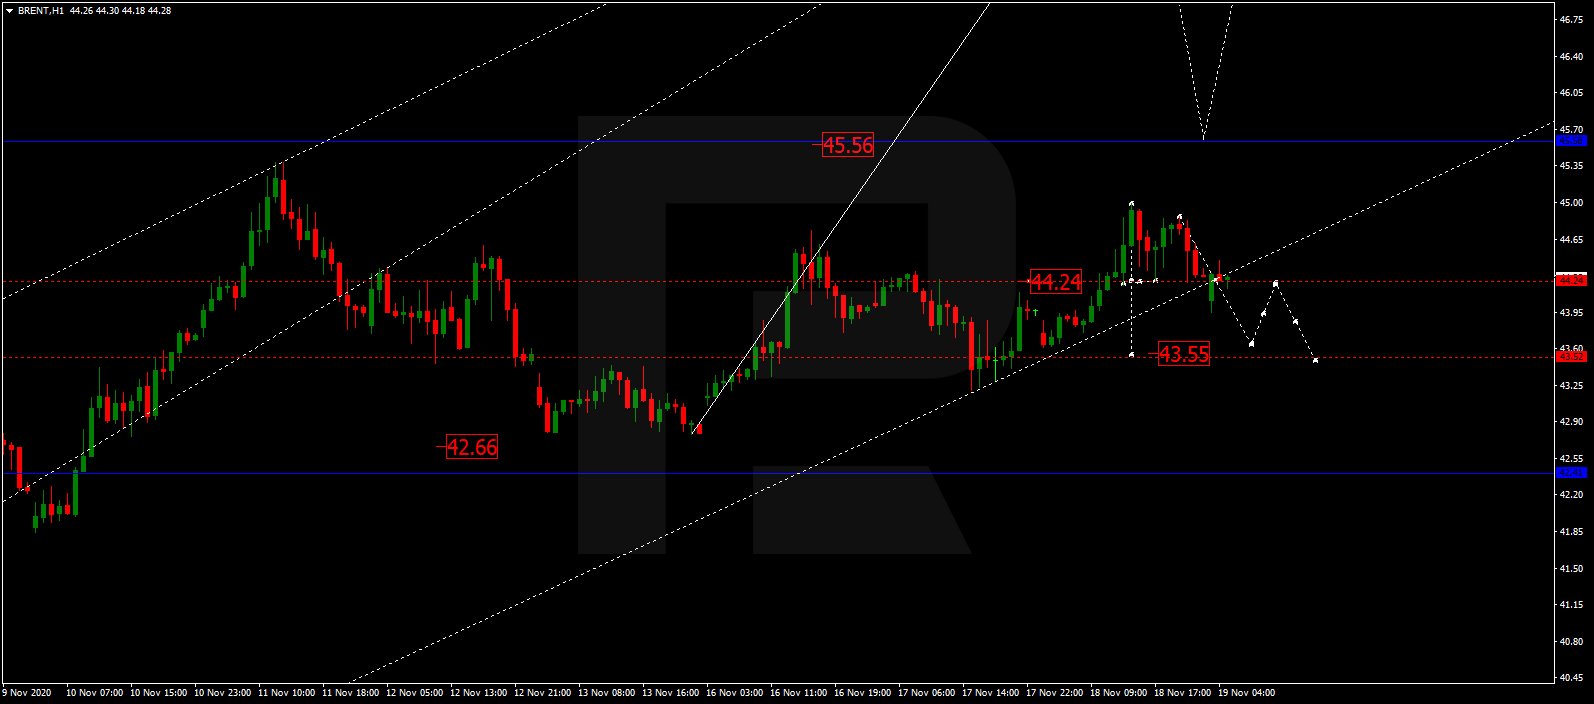
Brent is moving upwards. Possibly, the asset may extend this ascending wave up to 44.25 and then start a new correction with the closest target at 41.87. If later the price breaks this level, the market may continue the correction towards 39.60. After that, the instrument may form one more ascending wave with the target at 46.60.

BRENT
Risk Warning: the result of previous trading operations do not guarantee the same results in the future

XAUUSD, “Gold vs US Dollar”

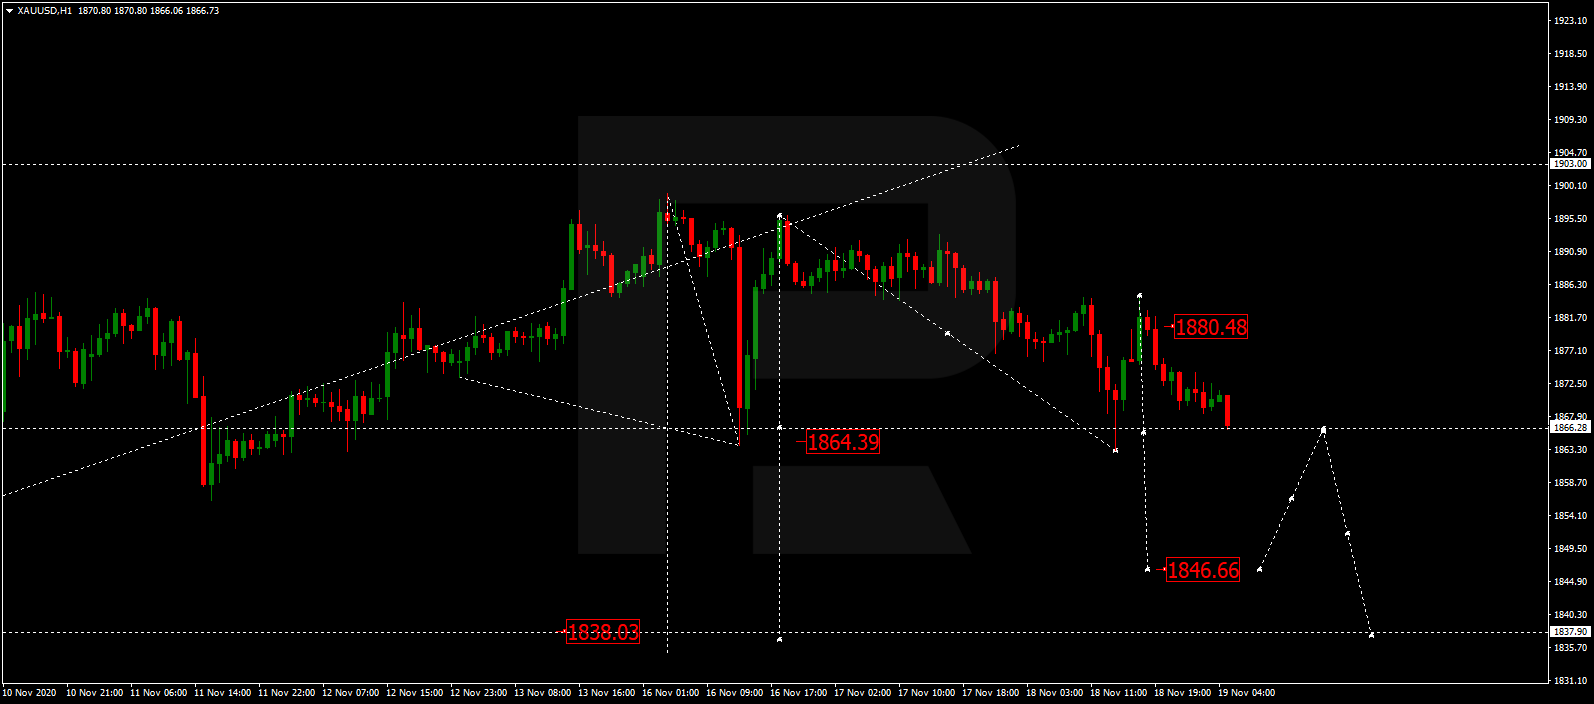
After finishing the ascending wave at 1890.30 along with the correction towards 1867.50, Gold is expected to form a new consolidation range between these levels. If later the price breaks this range to the upside, the market may continue the correction to reach 1902.70, at least, and then resume trading downwards with the target at 1840.08.

GOLD
Risk Warning: the result of previous trading operations do not guarantee the same results in the future

BTCUSD, “Bitcoin vs US Dollar”

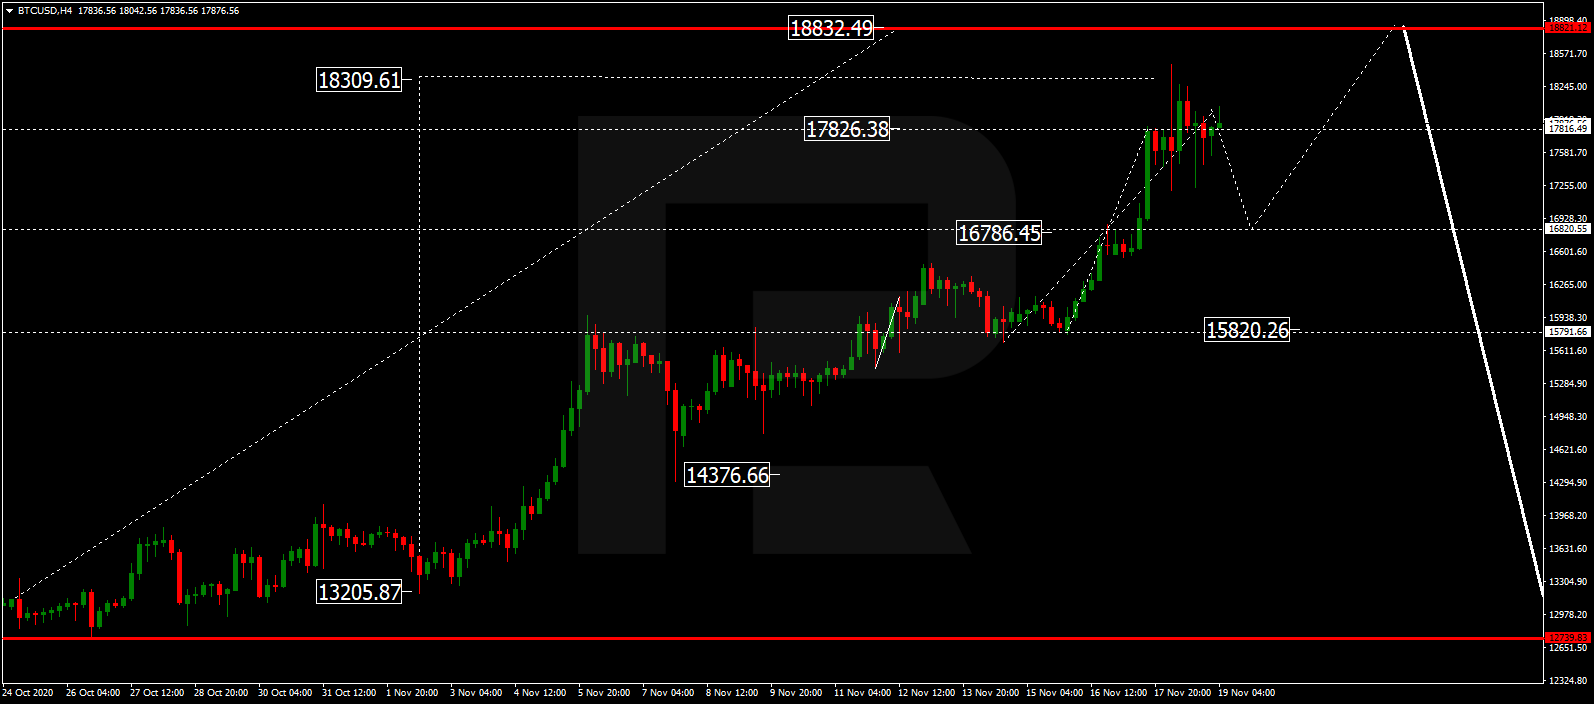
BTCUSD is forming a wide consolidation range around 15100.00. Possibly, today the asset may grow towards 15750.00 and then fall to reach 15200.00. If later the price breaks this range to the upside, the market may start another growth with the target at 16200.00; if to the downside – continue the correction towards 14500.00 and then resume growing to reach the above-mentioned target.

BITCOIN
Risk Warning: the result of previous trading operations do not guarantee the same results in the future

S&P 500

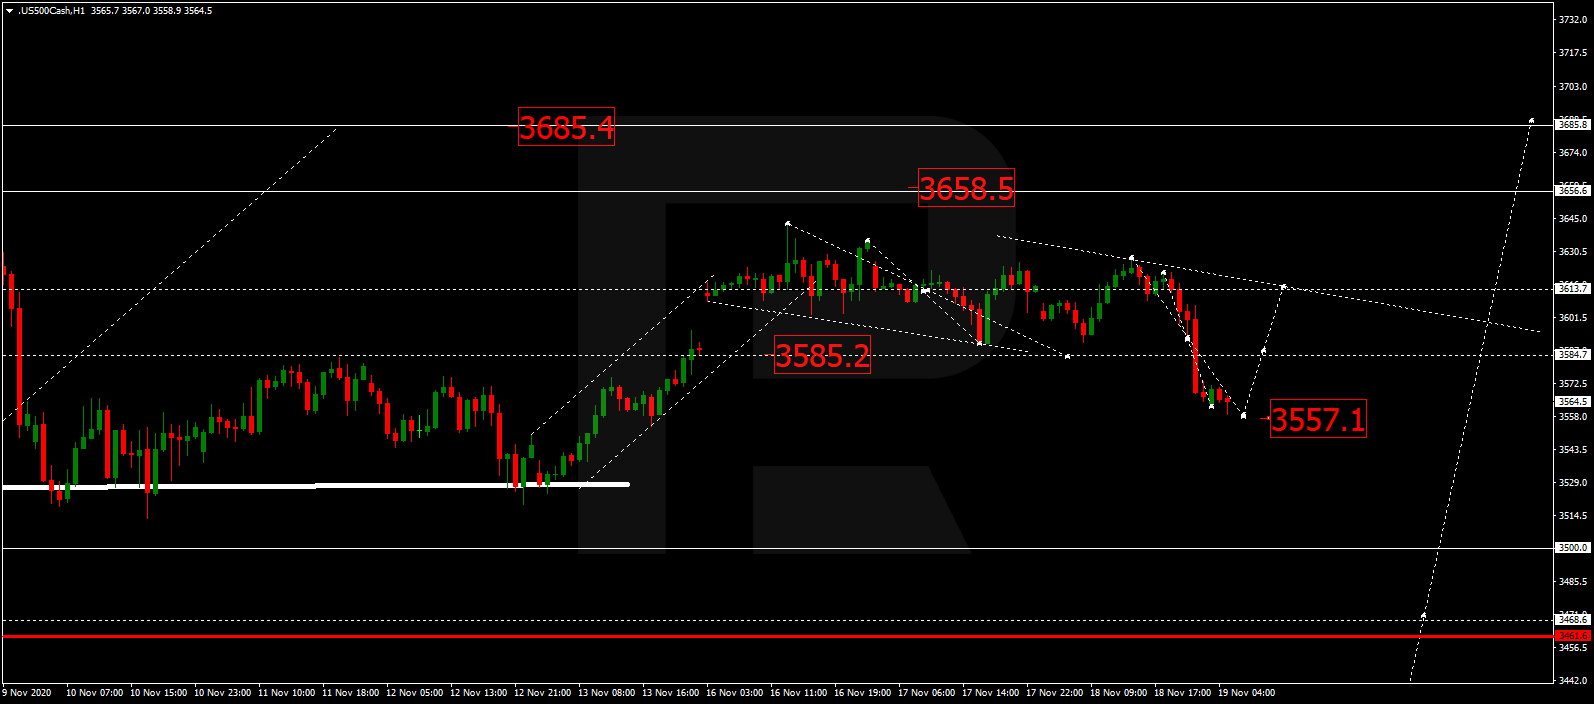
After breaking the ascending channel at 3565.5, the S&P index is consolidating below this level. Possibly, the asset may fall towards 3499.9 and then start another correction to return to 3565.5. After that, the instrument may form a new descending structure with the target at 3461.6.

S&P 500

Article By RoboForex.com

Attention!
Forecasts presented in this section only reflect the author’s private opinion and should not be considered as guidance for trading. RoboForex LP bears no responsibility for trading results based on trading recommendations described in these analytical reviews.

Mid-week technical outlook: Time for a Dollar rebound?

By Lukman Otunuga, Research Analyst, ForexTime

The last two days have been wild for financial markets!

After an explosion of vaccine optimism propelled global stocks to record highs earlier in the week, questions were later raised over how the drug will be produced and delivered which essentially dragged investors back to reality. Persistent concerns around the U.S fiscal stimulus and possible delay in the transition of power to President-elect Joe Biden dampened the market mood while surging coronavirus cases in Europe and the United States rubbed salt into the wound. With uncertainty still the name of the game and the core themes weighing on global sentiment firmly intact, king Dollar could make a comeback.

Talking technicals, the Dollar Index (DXY) remains in a wide range on the monthly timeframe with support at 92.00 and resistance at 95.00. The last time prices traded outside these regions was back in June 2020. Over the past few weeks, it has felt like the Dollar has been waiting for a fresh directional catalyst to breakout of the current range. If bulls are able to conquer the 95.00 resistance level, the Dollar Index could challenge 98.00 and beyond. However, a breakdown below 92.00 is seen opening the doors back towards 90.00.

It is the same story on the weekly timeframe. Prices are respecting a bearish channel; however strong support can be found around 92.00. Lagging indicators such as the 20 Simple Moving Average and MACD point to the downside. However, a daily close above 94.00 may trigger a move towards 94.80 and 95.00.

Before we knuckle down on the daily time, it must be kept in mind that there a wide selection of fundamentals themes influencing the Dollar. On Thursday, all eyes will be on the latest US inflation and jobless claims data which should provide fresh insight into the health of the largest economy in the world. Tomorrow’s U.S. inflation numbers expect to see a 0.1% increase to 1.8% in the core number, which excludes food and fuel while CPI is expected to dip to 1.3% this from 1.4%.

Focusing back on the technicals, the Dollar Index is trading above 92.70 as of writing. A solid close above the 93.40 level could pave a way towards 94.00 and 94.65. If 92.70 proves to be unreliable support, the DXY may slip back towards the 92.00 support.

Disclaimer: The content in this article comprises personal opinions and should not be construed as containing personal and/or other investment advice and/or an offer of and/or solicitation for any transactions in financial instruments and/or a guarantee and/or prediction of future performance. ForexTime (FXTM), its affiliates, agents, directors, officers or employees do not guarantee the accuracy, validity, timeliness or completeness, of any information or data made available and assume no liability as to any loss arising from any investment based on the same.


Forex-Time-LogoArticle by ForexTime

ForexTime Ltd (FXTM) is an award winning international online forex broker regulated by CySEC 185/12 www.forextime.com

How Elliott Waves Simplify Your Technical Analysis

Here’s a key insight into Elliott waves and classic technical chart patterns

By Elliott Wave International

First, before we explore a key insight into Elliott waves and technical chart patterns, expect to see a growing number of comments about technical analysis in the financial press.

That is, if a bear market in stocks has started. (The rally over the past few days notwithstanding — after all, stocks are still well off their highs for the year.)

As a classic Elliott Wave Theorist, a monthly publication which provides analysis of financial markets and social trends, says:

Technical analysis becomes popular in bear markets and loses popularity in bull markets.

For example, the country’s first major books on technical analysis — Technical Analysis and Stock Market Profits (Richard Schabacker) and The Dow Theory (Robert Rhea), were published in 1932. Of course, during that year, the nation was in the depths of a historic bear market.

Now, here in the closing weeks of 2020, some technical analysis references are already being made by some high-profile investment pros.

For example, on Oct. 27, a long-time and well-known global money manager was quoted in a CNBC headline:

Looks like a ‘double top’ in the S&P 500, [veteran] investor warns

On Oct. 30, Barron’s warned:

A double top is bad news. It’s a pattern in stock charts that forms after a security or index hits two highs close to one another with a dip in between. It looks like a capital letter M.

Of course, there are many other classic technical chart patterns, both bullish and bearish.

And, the key insight into how Elliott waves relate to these technical chart patterns is this: Elliott waves subsume all of them. This includes the head and shoulders top and bottom, rounding tops and bottoms, triangles, rectangle, double and triple tops and bottoms, diamond, falling and rising wedge, pennant, flag and any other valid technical chart pattern.

Let’s pick out just one of them — the head and shoulders top — to show an example of how the Wave Principle accommodates classic technical patterns. The commentary is from an Elliott Wave Theorist:

In a normal wave development, wave five of 3 and wave 4 form the “left shoulder” of the pattern, wave 5 and wave A form the “head,” and wave B and wave one of C form the “right shoulder.” Wave two of C creates the return to the neckline that is typical of the pattern.

In another issue of the Theorist, Robert Prechter approached the subject this way:

Traditional technical-analysis stock patterns, Dow Theory and other descriptions of market form fall within the compass of the Elliott wave model. I think this is an important point, because the Wave Principle can consolidate technical analysis under a single model.

Now, even though the Wave Principle subsumes well-known patterns — that doesn’t mean a technically inclined investor should stop being on the lookout for these patterns.

As the Wall Street classic book, Elliott Wave Principle: Key to Market Behavior, by Frost & Prechter, says:

The Elliott Wave Principle not only supports the validity of chart analysis, but it can help the technician decide which formations are most likely of real significance.

If you want to learn more about the Wave Principle, you can read the online version of Elliott Wave Principle: Key to Market Behaviorfree.

That’s right — this Wall Street classic can be on your computer screen in moments right after you sign up for a Club EWI membership. Club EWI is the world’s largest Elliott wave educational community with about 350,000 members and it’s free to join. Members get free access to a wealth of Elliott wave insights into financial markets, trading and investing.

Simply follow this link to get started: Elliott Wave Principle: Key to Market Behavior — free and unlimited access.

This article was syndicated by Elliott Wave International and was originally published under the headline How Elliott Waves Simplify Your Technical Analysis. EWI is the world’s largest market forecasting firm. Its staff of full-time analysts led by Chartered Market Technician Robert Prechter provides 24-hour-a-day market analysis to institutional and private investors around the world.


Ichimoku Cloud Analysis 10.11.2020 (GBPJPY, BRENT, XAUUSD)

Article By RoboForex.com
GBPJPY, “Great Britain Pound vs Japanese Yen”

GBPJPY is trading at 138.41; the instrument is moving above Ichimoku Cloud, thus indicating an ascending tendency. The markets could indicate that the price may test Tenkan-Sen and Kijun-Sen at 137.45 and then resume moving upwards to reach 139.85. Another signal in favor of further uptrend will be a rebound from the rising channel’s downside border. However, the bullish scenario may no longer be valid if the price breaks the cloud’s downside border and fixes below 136.45. In this case, the pair may continue falling towards 135.75.

GBPJPY
Risk Warning: the result of previous trading operations do not guarantee the same results in the future

BRENT

Brent is trading at 42.05; the instrument is moving above Ichimoku Cloud, thus indicating an ascending tendency. The markets could indicate that the price may test the cloud’s upside border at 40.70 and then resume moving upwards to reach 45.85. Another signal in favor of further uptrend will be a rebound from the rising channel’s downside border. However, the bullish scenario may no longer be valid if the price breaks the cloud’s downside border and fixes below 39.65. In this case, the pair may continue falling towards 37.35.

BRENT
Risk Warning: the result of previous trading operations do not guarantee the same results in the future

XAUUSD, “Gold vs US Dollar”

XAUUSD is trading at 1884.00; the instrument is moving below Ichimoku Cloud, thus indicating a descending tendency. The markets could indicate that the price may test Tenkan-Sen and Kijun-Sen at 1895.00 and then resume moving downwards to reach 1815.00. Another signal in favor of further downtrend will be a rebound from the descending channel’s upside border. However, the bearish scenario may no longer be valid if the price breaks the cloud’s upside border and fixes above 1920.00. In this case, the pair may continue growing towards 1955.00.

XAUUSD

Article By RoboForex.com

Attention!
Forecasts presented in this section only reflect the author’s private opinion and should not be considered as guidance for trading. RoboForex LP bears no responsibility for trading results based on trading recommendations described in these analytical reviews.