Archive for Forex and Currency News – Page 339

Ichimoku Cloud Analysis 25.11.2020 (BTCUSD, EURJPY, BRENT)

Article By RoboForex.com

BTCUSD, “Bitcoin vs US Dollar”

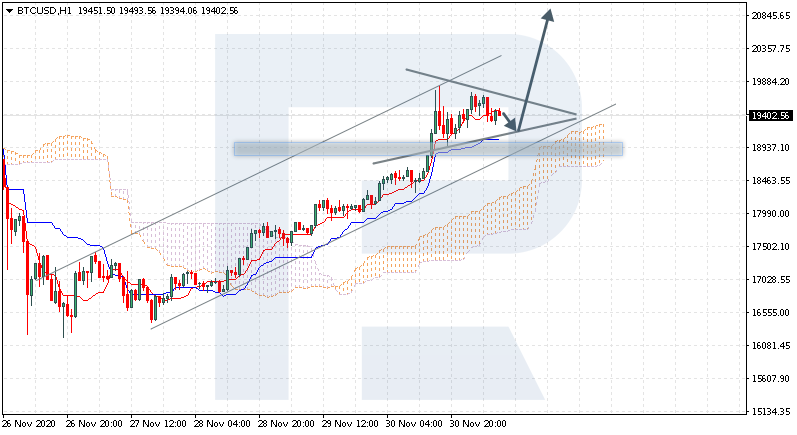
BTCUSD is trading at 18874.00; the instrument is moving above Ichimoku Cloud, thus indicating an ascending tendency. The markets could indicate that the price may test the cloud’s upside border at 18675.00 and then resume moving upwards to reach 19945.00. Another signal in favor of further uptrend will be a rebound from the rising channel’s downside border. However, the bullish scenario may no longer be valid if the price breaks the cloud’s downside border and fixes below 17905.00. In this case, the pair may continue falling towards 17025.00.

BTCUSD
Risk Warning: the result of previous trading operations do not guarantee the same results in the future

EURJPY, “Euro vs Japanese Yen”

EURJPY is trading at 124.31; the instrument is moving above Ichimoku Cloud, thus indicating an ascending tendency. The markets could indicate that the price may test the cloud’s upside border at 124.05 and then resume moving upwards to reach 126.25. Another signal in favor of further uptrend is the formation of a Head & Shoulders reversal pattern. However, the bullish scenario may no longer be valid if the price breaks the cloud’s downside border and fixes below 122.95. In this case, the pair may continue falling towards 122.05. To confirm further growth, the asset must break the resistance area and fix above 124.95, thus indicating a breakout the pattern’s “neckline”.

EURJPY
Risk Warning: the result of previous trading operations do not guarantee the same results in the future

BRENT

Brent is trading at 48.07; the instrument is moving above Ichimoku Cloud, thus indicating an ascending tendency. The markets could indicate that the price may test Tenkan-Sen and Kijun-Sen at 47.45 and then resume moving upwards to reach 50.25. Another signal in favor of further uptrend will be a rebound from the rising channel’s downside border. However, the bullish scenario may no longer be valid if the price breaks the cloud’s downside border and fixes below 46.15. In this case, the pair may continue falling towards 44.65.

BRENT

Article By RoboForex.com

Attention!
Forecasts presented in this section only reflect the author’s private opinion and should not be considered as guidance for trading. RoboForex LP bears no responsibility for trading results based on trading recommendations described in these analytical reviews.


The Analytical Overview of the Main Currency Pairs on 2020.11.25

by JustForex

The EUR/USD currency pair

Technical indicators of the currency pair:
  • Prev Open: 1.1839
  • Prev Close: 1.1892
  • % chg. over the last day: +0.44%

Yesterday, the EUR/USD pair was traded in an uptrend and showed +0.44%. An uptrend is observed on the chart, which indicates the prevalence of purchases on this asset. On the hourly timeframe, the price is being traded above the moving average MA 200. On the H4 timeframe, the situation is similar. The MACD indicator is in the positive zone. Based on the above, it is worth considering only buy positions while the price is above MA200 on H1.

Trading recommendations
  • Support levels: 1.1891, 1.1848, 1.1815, 1.1745
  • Resistance levels: 1.1905, 1.1920

The main scenario for trading EUR/USD is looking for buy entry points. If the price breaks through and fixes above 1.1905, it is better to consider purchases. After breaking through the 1.1905 level, quotes may move to the level of 1.1920 and further to the level of 1.2000.

Alternative scenario: if the price fixes below 1.1848 on the H1 timeframe and below MA200 on H1, the currency pair is likely to decline to 1.1815.

EUR/USD
News feed for 2020.11.25:
  • – Core durable goods orders in the US at 15:30 (GMT+2);
  • – US GDP at 15:30 (GMT+2);
  • – Initial jobless claims in the US at 15:30 (GMT+2);
  • – US new home sales at 17:00 (GMT+2);
  • – Crude oil inventories at 17:30 (GMT+2);
  • – Publication of the FOMC minutes at 21:00 (GMT+2).

The GBP/USD currency pair

Technical indicators of the currency pair:
  • Prev Open: 1.3318
  • Prev Close: 1.3362
  • % chg. over the last day: +0.33%

Yesterday, the GBP/USD currency pair was traded in the range of 1.3300-1.3370 and closed the day with a result of +0.33%. On the hourly chart, GBP/USD is being traded above the moving average MA (200) H1. The situation is similar on the four-hour chart. The MACD indicator is in the positive zone. There is still an uptrend. Based on the above, it is necessary to look for buy entry points while the pair remains above MA 200 H1.

Trading recommendations
  • Support levels: 1.3314, 1.3263, 1.3195, 1.3105
  • Resistance levels: 1.3398, 1.3482

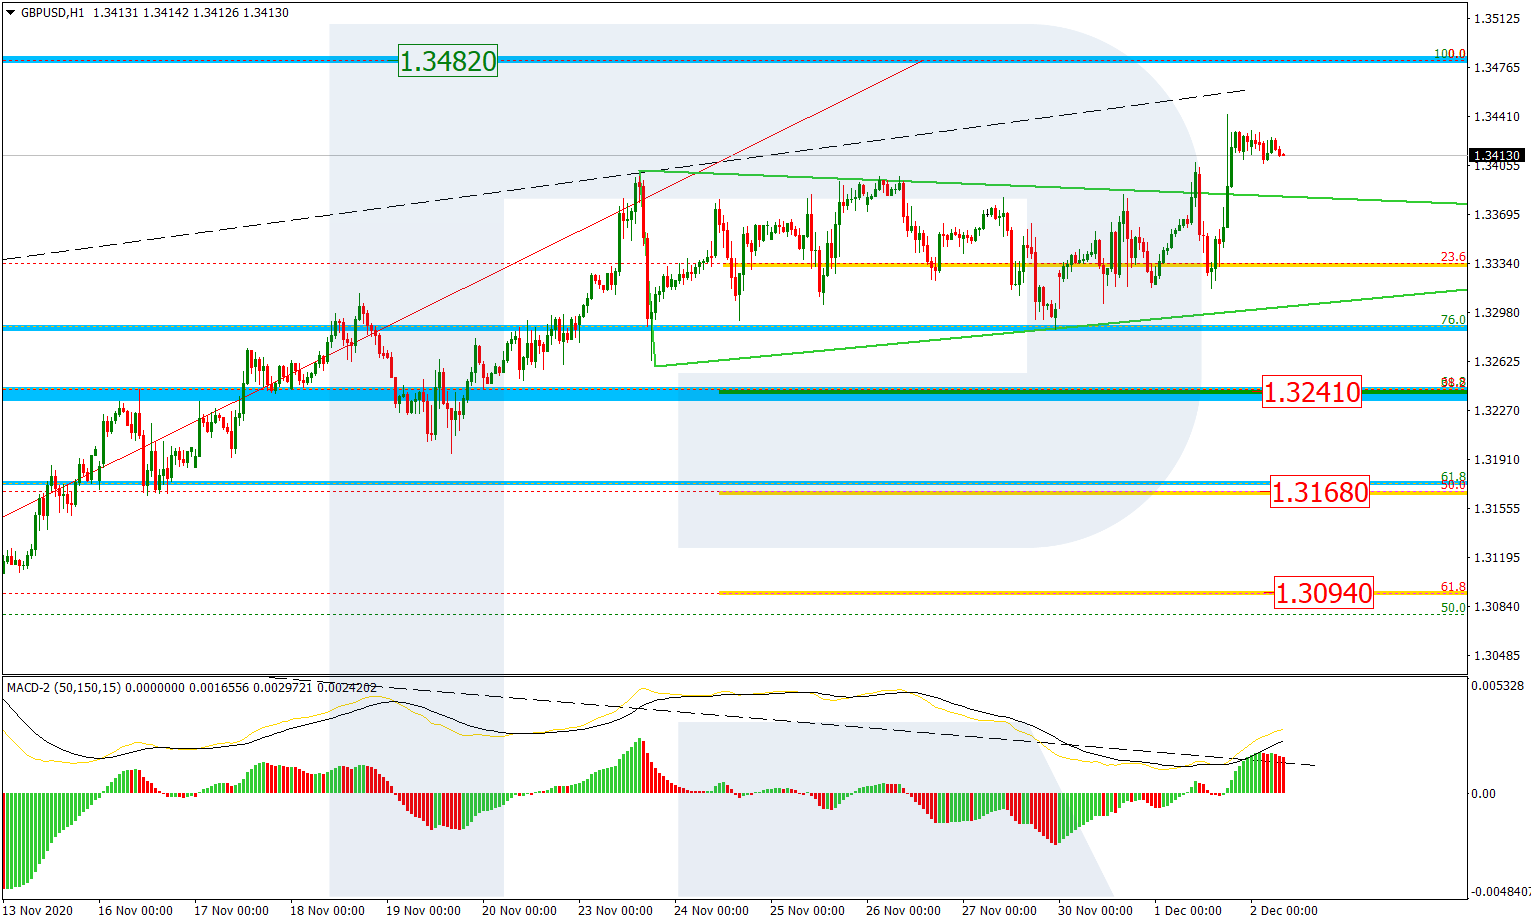
The main scenario: look for buy entry points. A technical analysis figure, Triangle, is drawn on H1. If the price breaks through the upper border of the Triangle and fixes above it, the price may move to the level of 1.3398. If the price breaks and fixes above the level of 1.3398, the price may move to the level of 1.3482. It is also worth noting that divergence is observed on the MACD on the H4 timeframe. This may signal the beginning of a pair correction.

Alternative scenario: if the price fixes below 1.3263, then the asset may fall to $1.3195.

GBP/USD
News feed for 2020.11.25:
  • – Core durable goods orders in the US at 15:30 (GMT+2);
  • – US GDP at 15:30 (GMT+2);
  • – Initial jobless claims in the US at 15:30 (GMT+2);
  • – US new home sales at 17:00 (GMT+2);
  • – Crude oil inventories at 17:30 (GMT+2);
  • – Publication of the FOMC minutes at 21:00 (GMT+2).
  • – UK autumn forecast statement.

The USD/JPY currency pair

Technical indicators of the currency pair:
  • Prev Open: 104.45
  • Prev Close: 104.44
  • % chg. over the last day: 0%

Yesterday, the USD/JPY currency pair was traded in the range of 104.22-104.70. The pair closed the day with 0%. Today, USD/JPY is being traded at yesterday’s close. On the hourly chart, the USD/JPY currency pair has fixed above the moving average MA (200). On the four-hour chart, the price is below MA200. The MACD indicator is in the positive zone, but the divergence is drawn, which signals that the price may fall. Based on the above, one should look at how the currency pair will behave at key levels.

Trading recommendations
  • Support levels: 104.22, 103.65
  • Resistance levels: 104.75, 105.12

The main scenario: consider buying an asset. If the price breaks through the level of 104.75 and fixes above it, then the currency pair may move to the level of 105.12.

An alternative scenario assumes consolidation below the level of 104.22 with further fall to the level of 103.65.

USD/JPY
News feed for 2020.11.25:
  • – Core durable goods orders in the US at 15:30 (GMT+2);
  • – US GDP at 15:30 (GMT+2);
  • – Initial jobless claims in the US at 15:30 (GMT+2);
  • – US new home sales at 17:00 (GMT+2);
  • – Crude oil inventories at 17:30 (GMT+2);
  • – Publication of the FOMC minutes at 21:00 (GMT+2).

The USD/CAD currency pair

Technical indicators of the currency pair:
  • Prev Open: 1.3083
  • Prev Close: 1.2997
  • % chg. over the last day: -0.65%

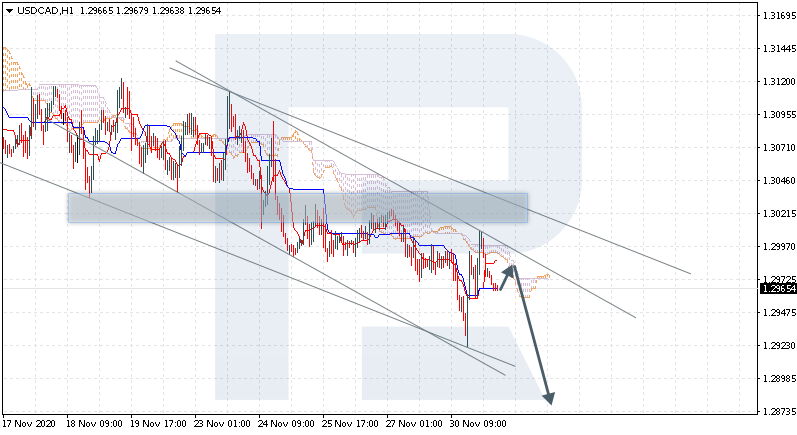
The USD/CAD currency pair was traded yesterday in a downtrend and closed with -0.65%. Today, the currency pair is correcting to yesterday’s fall. On the H1 timeframe, USD/CAD is below the moving average MA 200. On the four-hour chart, the price is below the moving average. Yesterday, the pair broke through the 1.3038-1.3110 trading channel and fixed below it. You may consider the sale of an asset on the correction.

Trading recommendations
  • Support levels: 1.2990, 1.2928
  • Resistance levels: 1.3033, 1.3089, 1.3118, 1.3172

The main scenario: consider the sale of an asset. It is better to look for a sell entry point when the price is corrected on lower timeframes near the level of 1.3033. The price may fall to the level of 1.2990.

Alternative scenario: if the price breaks through the level of 1.3089 and fixes above the 200 moving average on H1, one should consider a buy position to the level of 1.3172.

USD/CAD
News feed for 2020.11.25:
  • – Core durable goods orders in the US at 15:30 (GMT+2);
  • – US GDP at 15:30 (GMT+2);
  • – Initial jobless claims in the US at 15:30 (GMT+2);
  • – US new home sales at 17:00 (GMT+2);
  • – Crude oil inventories at 17:30 (GMT+2);
  • – Publication of the FOMC minutes at 21:00 (GMT+2).

by JustForex


This article reflects a personal opinion and should not be interpreted as an investment advice, and/or offer, and/or a persistent request for carrying out financial transactions, and/or a guarantee, and/or a forecast of future events.

How To Spot The End Of An Excess Phase – Part I

By TheTechnicalTraders 

– If you have been following my team’s research posts recently, we have highlighted some interesting new research related to Appreciation/Depreciation phases in the US stock market and how that relates to Gold. Today we will explore another method of identifying the different phases of market trends that appears to show very clear Appreciation/Depreciation phases and extended end-phase blow-off tops and bottoms.

My research team and I believe the current rally in the US stock markets represents an end-phase blow-off top after a 9.5-year Appreciation phase that began in mid-2009.  We believe it is very important for traders to understand these larger Appreciation/Depreciation cycles and how the Blow-Off end phases often create extreme volatility and price rotation.

Below, we are using a custom EURUSD/JPYUSD index divided by GOLD as the base Candlestick chart and have applied the real Gold price levels on the chart for visual reference.  Near the bottom of the chart, we are showing the RSI indicator, the TSICCI indicator, and the RSI + MFI Indicator that helps to highlight the broad market trends and cycle phases.  We want you to pay attention to the GREEN and RED arrows we’ve drawn on this chart showing the Appreciation/Depreciation phases of Gold and the broader US stock markets in EUR/JPY currency form.  This method of charting these phases takes a bit of patience and understanding.  We are looking for correlations to US stock market trends in relation to precious metals and we must consider the end-phase process.

The end-phase process after any appreciation or depreciation phase often includes a very volatile “blow-off” period where trends continue beyond the end of the actual price phase.  This happens because the momentum of the previous price move has yet to realize the transitional shift in underlying appreciation/depreciation factors. Traders still want the rally in the stock market or metals to continue, so they chase after the excess phase rally until the momentum of the move fails.

These end-phase excess rallies can be quite exciting and volatile but often end in a certain type of setup. We believe it is important for all traders and investors to understand the end-phase setup and how it translates into opportunities for skilled traders.

LEARN THE COMPONENTS OF AN EXCESS PHASE PEAK/BREAKDOWN

First, the Phase 1 Excess Rally must take place.  This is usually an impressive upside price move that may last far longer than many people expect.  For example, the 2014 peak in Bitcoin rallied from near $100 to over $1100 (over 1000%), then stalled.

The Second Phase of the Excess Blow-Off peak is the retracement of price followed by a FLAG/Pennant trend that appears to be a resumption of the original trend.  This is important from a psychological perspective because it provides further technical price data that the excess rally phase has failed.

Looking at Phases 3, 4, and 5 on the chart below, we can see the Third Phase is the breakdown of the FLAG formation. When the FLAG formation fails, price usually falls to a new lower support level which sets up the final “exhaustion rally” before stronger selling pressure continues.  This is usually a very good trend for short traders.  The FLAG setup usually gives traders time to setup Put Options or setup short positions waiting for the breakdown of the FLAG setup.

Be sure to sign up for our free market trend analysis and signals now so you don’t miss our next special report!

The Fourth Phase is the identification/setup of the Support/Recovery Attempt.  After the FLAG breakdown initiates, price starts to actively seek out fair valuation levels below the Excess Phase peak and the recent FLAG pattern lows.  This process usually attempts to identify a near term support level that begins to act as a Price Floor for quite some time.

Lastly, the Phase Five Breakdown, as the momentum of the past rally fades and traders resign themselves to the fact that the excitement of the Excess Phase rally has ended. At this point, price usually continues to consolidate near the Phase Four support level before finally breaking downward into the extended downside/bearish trend.

As we’ve stated near the top of this research post, our research team believes the current US stock market appreciation phase ended in mid-2018 and that we are nearly 2.5 years into an Excess Phase (blow-off) topping formation.  We believe the next phase of the US market trend will be something similar to what we are showing you in these examples. It is important for all traders and investors to recognize these late stage volatile price setups, particularly ones that are pushed to extreme limits because of Central Bank and US Fed interventions.

In Part II  of this research article, we’ll share more examples of late Excess Phase peaks and breakdowns as well as share more insight related to the current market conditions.  If our research is accurate, we are about to enter a very exciting phase of the market where big price rotation and wild trends will continue for the next 4 to 5+ years before a new US stock market appreciation phase begins again. We can help you find and identify great trading opportunities so visit TheTechnicalTraders.com to learn about my exciting ”Best Asset Now” strategy and indicators. You can also sign up for my daily pre-market video reports that walks you through the charts of all the major asset classes every morning.

Happy Thanksgiving!

Chris Vermeulen
Chief Market Strategist
www.TheTechnicalTraders.com

NOTICE AND DISCLAIMER: Our free research does not constitute a trade recommendation or solicitation for readers to take any action regarding this research.  We are not registered financial advisors and provide our research for educational and informational purposes only. Read our FULL DISCLAIMER here.


Analysts Are Confident in the BREXIT Trade Deal

by JustForex

JPMorgan analysts have raised their chances of the Brexit trade deal from two-thirds to 80% as far as negotiators from the UK and the European Union are trying to reach an agreement before the end of the year.

“Since the summer we have put the odds of a deal at about two-thirds, and no-deal at a third,” JPMorgan said in a note to clients on Tuesday.

“Given the recent newsflow, the likelihood of a deal is clearly growing, and hence we shift our assessment to 80-20 in favour of a deal,” – it’s said in the message. A BREXIT trade deal will have a positive effect on the movement of EUR and GBP, so it’s recommended for traders to follow the progress of the negotiations.

Chinese Prime Minister Li Keqiang expects that the economic activity in the country may return to reasonable limits next year after the impact of the coronavirus pandemic on economic growth in 2020.

It was noted that China will continue to open up and will not pursue a trade surplus, but instead will pay equal attention to imports and exports. The Chinese government also plans to reduce the tax burden on business this year by 2.5 trillion yuan (about $ 373.1 billion) to support economic growth amid the pandemic. This may indicate the attractiveness of the Chinese yuan for investments in the future.

On Wednesday, oil prices are rising after reaching their highest levels since early March based on the results of the previous trading.

Investors remain optimistic about the demand outlook due to the news about the coronavirus vaccines development.

WTI crude oil prices are trading at $ 45.30.

Market indicators

US indices were closed with the rise on Tuesday after the US President-elect Joe Biden got approval to lead the country after a few weeks of political uncertainty and amid encouraging news about the COVID vaccine.

The Dow Jones index rose by 1.54% to 30.046.24, the S&P 500 – by 1.62% to 3.635.41, which also became a historic closing record.

The Nasdaq Composite added 1.31% to 12.036.79.

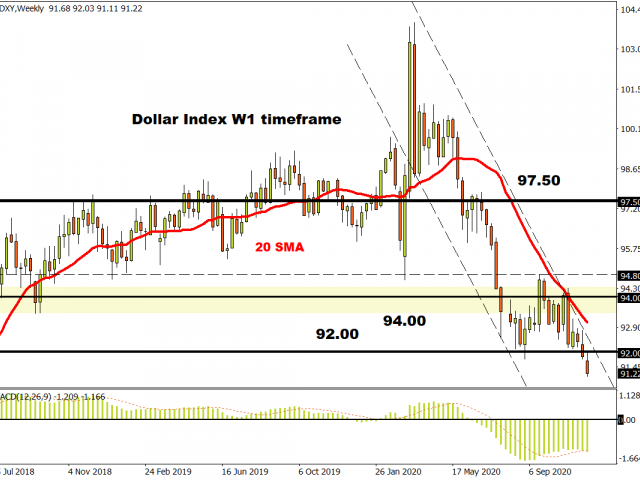
The dollar index dropped to 92.03 as a result of macro statistics on consumer confidence.

The 10-year US government bonds yield remains stable at 0.88%

It is worth paying attention to the news feed for today. At this time, we recommend limiting your risks in positions.

The news feed for 2020.11.25:
  • – US core durable goods orders at 15:30 (GMT+2)
  • – US GDP at 15:30 (GMT+2)
  • – US new home sales at 17:00 (GMT+2)
  • – US crude oil reserves at 17:30 (GMT+2)
  • – Publication of the FOMC minutes at 21:00 (GMT+2)
  • – UK autumn forecast report.

by JustForex


This article reflects a personal opinion and should not be interpreted as an investment advice, and/or offer, and/or a persistent request for carrying out financial transactions, and/or a guarantee, and/or a forecast of future events.

GBPUSD Tests The 1.3300 Support Level

By Orbex

gbpusd

The British pound sterling is failing to make further gains after clearing the 1.3300 level.

Price action continues to pullback as the GBPUSD is firmly testing the 1.3300 level for support.

As long as the support holds, the GBPUSD is biased to move to the upside.

The next key target will be the September 1st highs of 1.3483. For this to happen, GBPUSD will need to post higher highs.

o the downside, if the cable loses the 1.3300 support, we could expect to see a brief decline.

But the trend line should act as dynamic support to keep prices from falling further.

By Orbex

EURUSD Holds Steady Above 1.1800

By Orbex

eurusd

The euro currency managed to recover from the declines on Monday. Price action made a quick recovery after testing the lower support near 1.1800.

However, the upside gains are stalling near the trend line. This could keep price action contained for the moment.

Only a strong breakout above the trend line will see further gains coming.

But the resistance level of 1.1900 is also weighing on the common currency.

As a result, we could expect the EURUSD to hold on to its sideways range for the moment between 1.1900 and 1.1800.

By Orbex

USDPLN Bears Look For Monthly Lows

By Orbex

usdpln

USDPLN has seen attempts of breaking out from monthly highs hitting a plateau as bears take hold. Prices are currently finding resistance at the 23.6% of the 4.2432/3.6557 downside Fibonacci leg. In addition, the lower border of the Ichimoku cloud is highlighted as a confluence level of the said leg.

The bias remains to the downside as momentum wanes, with the next target being August’s lows. A recent bearish divergence has pulled prices down through the 38.2% from monthly highs.

Should another attempt to move towards cloud engulfment fail, then further downside is expected. As momentum increases, we will wait to see if further divergences become apparent.

A short-term outlook shows the currency pair in a descending channel from the beginning of November. Prices are now clinging to the top border of the channel in an attempt for bulls to pounce on the direction.

A hidden and standard divergence could lead to a trend reversal, moving prices to monthly highs. However, with the Ichimoku cloud forming a resistance, then the recent rally to the upside could reverse and bring prices back down to the mean.

Should this occur, then we could see the descending channel continue, moving the trend lower to the mid-$3 range.

By Orbex

Ichimoku Cloud Analysis 24.11.2020 (ETHUSD, XAUUSD, EURGBP)

Article By RoboForex.com

ETHUSD, “Ethereum vs US Dollar”

ETHUSD is trading at 610.04; the instrument is moving above Ichimoku Cloud, thus indicating an ascending tendency. Bulls are trying to hold 600.00. The markets could indicate that the price may test the cloud’s upside border at 580.00 and then resume moving upwards to reach 675.75. Another signal in favor of further uptrend is a rebound from the rising channel’s downside border. However, the bullish scenario may no longer be valid if the price breaks the cloud’s downside border and fixes below 535.00. In this case, the pair may continue falling towards 465.00.

ETHUSD
Risk Warning: the result of previous trading operations do not guarantee the same results in the future

XAUUSD, “Gold vs US Dollar”

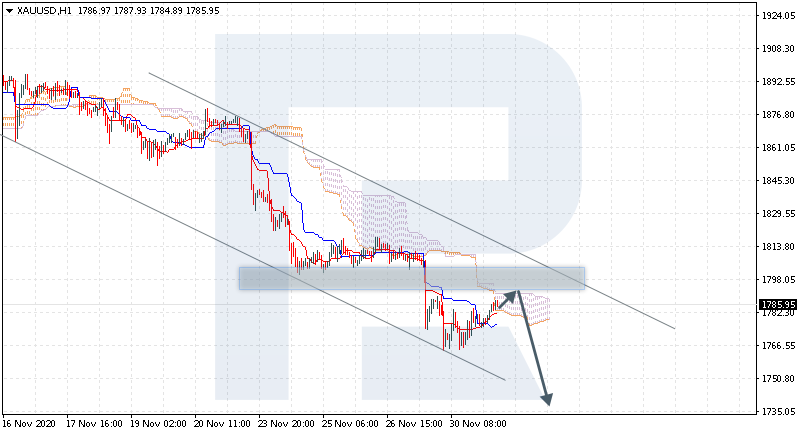
XAUUSD is trading at 1826.00; the instrument is moving below Ichimoku Cloud, thus indicating a descending tendency. Earlier, after breaking the support level at 1850.00, bears tried to fix below this area three times. The markets could indicate that the price may test Tenkan-Sen and Kijun-Sen at 1850.00 and then resume moving downwards to reach 1775.00. Another signal in favor of further downtrend will be a rebound from the descending channel’s upside border. However, the bearish scenario may no longer be valid if the price breaks the cloud’s upside border and fixes above 1915.00. In this case, the pair may continue growing towards 1945.00.

XAUUSD
Risk Warning: the result of previous trading operations do not guarantee the same results in the future

EURGBP, “Euro vs Great Britain Pound”

EURGBP is trading at 0.8885; the instrument is moving below Ichimoku Cloud, thus indicating a descending tendency. The markets could indicate that the price may test the cloud’s downside border at 0.8905 and then resume moving downwards to reach 0.8835. Another signal in favor of further downtrend will be a rebound from the resistance level. However, the bearish scenario may be canceled if the price breaks the cloud’s upside border and fixes above 0.8925. In this case, the pair may continue growing towards 0.9015.

EURGBP

Article By RoboForex.com

Attention!
Forecasts presented in this section only reflect the author’s private opinion and should not be considered as guidance for trading. RoboForex LP bears no responsibility for trading results based on trading recommendations described in these analytical reviews.

Pandemic Hits the Eurozone Economic Activity

by JustForex

The bloc’s economy is tending to its first double recession in nearly a decade, and the Purchasing Managers’ Index (PMI) published on Monday has confirmed it. Analysts say the Eurozone economy has plunged into severe recession again in November amid renewed efforts to prevent the growing wave of COVID-19 infections. This data increases the likelihood that the Eurozone GDP will decrease again in the fourth quarter.

UK economic activity has reduced in November as a new wave of coronavirus restrictions hit the service industry, but news of possible vaccines has brought hopes for 2021.

The UK economy is also expected to decrease in the fourth quarter after Prime Minister Boris Johnson introduced a four-week lockdown for the UK.

In contrast to Europe, in the United States, economic activity in November grew at the fastest pace for over five years driven by the highest production growth since September 2014.

Based on this data, we recommend trading currency pairs with EUR, GBP more conservatively, fixing positions at the nearest levels and considering USD purchases.

Today, oil prices are rising on increased optimism about energy demand amid the success of several pharmaceutical companies in developing vaccines against COVID-19.

WTI crude oil prices are being traded at $43.25.

Market indicators

US indices gained support at the end of the trading session after reports that President-elect Joe Biden may nominate former Federal Reserve Chairman Janet Yellen for the post of Treasury chief. Biden’s headquarters confirmed this information. The Dow Jones rose by 1.12% to 29.591.27 points, the S&P 500 rose by 0.56% to 3.577.59 points, and the Nasdaq rose by 0.22% to 11.880.634 points.

The dollar index increases to the level of 92.43 amid positive data on US economic activity.

10-year government bonds yield is still stable at 0.86%.

It is worth paying attention to the news feed for today. At this time, we recommend limiting your risks in positions.

The news feed for 2020.11.24:
  • – German GDP at 9:00 (GMT+2);
  • – German business climate index at 11:00 (GMT+2);
  • – Speech by ECB President Lagarde at 16:00 (GMT+2);
  • – US consumer confidence index at 17:00 (GMT+2);
  • – UK autumn forecast statement.

by JustForex


This article reflects a personal opinion and should not be interpreted as an investment advice, and/or offer, and/or a persistent request for carrying out financial transactions, and/or a guarantee, and/or a forecast of future events.

Japanese Candlesticks Analysis 24.11.2020 (EURUSD, USDJPY, EURGBP)

Article By RoboForex.com

EURUSD, “Euro vs. US Dollar”

As we can see in the H4 chart, the ascending tendency continues. Right now, after finishing the correction and forming several reversal patterns, such as Doji, close to the support area, EURUSD is reversing. The upside target remains at 1.1970. After that, the instrument may continue moving upwards. However, an alternative scenario implies that the price may start a new pullback to return to 1.1810 before resuming the uptrend.

EURUSD
Risk Warning: the result of previous trading operations do not guarantee the same results in the future

USDJPY, “US Dollar vs. Japanese Yen”

As we can see in the H4 chart, after rebounding from the support area and finishing another correction, the asset has formed several reversal patterns, such as Engulfing, not far from the horizontal resistance level. Possibly, the asset may reverse and continue the descending tendency. The downside target is at 103.15. At the same time, an opposite scenario says that the price may continue growing towards 104.80 without reversing and reaching the above-mentioned target.

USDJPY
Risk Warning: the result of previous trading operations do not guarantee the same results in the future

EURGBP, “Euro vs. Great Britain Pound”

As we can see in the H4 chart, the asset continues moving within the descending channel. Right now, after forming several reversal patterns, such as Hammer and Inverted Hammer, not far from the horizontal support level, EURGBP may reverse and correct towards the channel’s upside border. In this case, the correctional target may be at 0.9000. However, judging by previous movements, the pair may yet continue falling towards the channel’s downside border without reversing. In this case, the downside target will be at 0.8840.

EURGBP

Article By RoboForex.com

Attention!
Forecasts presented in this section only reflect the author’s private opinion and should not be considered as guidance for trading. RoboForex LP bears no responsibility for trading results based on trading recommendations described in these analytical reviews.