Archive for Forex and Currency News – Page 311

Treasury yields and the stock market rose following oil prices

by JustForex

A sudden change in the weather in Texas was a surprise for traders. An arctic cyclone sweeping some areas of the US threatens to restrict supplies from one of the world’s leading oil producers. West Texas Intermediate crude oil futures increased by 2.5% and surpassed $60 a barrel for the first time since January last year. Meanwhile, Brent crude oil price rose to $64 in London. Traders estimate that production of several hundred thousand barrels per day in Texas could be affected by wells shutdown, disfunction of road transport, and electrical power outage to extreme weather conditions.

As a result of the jump in oil prices, US 10-year Treasuries yield rose to 1.21%. The stock market was next to react. The S&P 500 set a new all-time high at the level of 3947. The Stoxx 600 rose primarily on gains in banking and commodities stocks. The Nikkei 225 reached 30,000 for the first time since 1990. The latest statistics showed that Japan’s economic growth exceeded expectations.

An additional growth driver for risky assets is a decrease in the level of daily coronavirus infections. The rate of distribution in the US continues to slow down. The weekly national average fell to its lowest level in nearly four months. All of these factors bolster hopes for an early recovery from the pandemic.

Against this background, the dollar index continues to decline. The greenback, as a defensive asset, continues to be under pressure from rising stock prices, the commodity market, and negative statistics. The latest US consumer sentiment data has hit the dollar. Consumer sentiment in the US dropped unexpectedly to a six-month low at the beginning of February because of the decline in income and the development of inflation. The University of Michigan Sentiment Index fell to 76.2 from 79 in January. Consumers expect inflation to rise 3.3%, the highest since July 2014.

Main market quotes:

S&P 500 (F) 3,946.62 +15.62 (+0.40%)

Dow Jones 31,458.40 +27.70 (+0.09%)

DAX 14,103.15 +53.26 (+0.38%)

FTSE 100 6,664.16 +74.37 (+1.13%)

USD Index 90.323 -0.147 (-0.16%)

Important events:
  • – Japan GDP (q/q) (q4) at 01:50 (GMT+2).

by JustForex


This article reflects a personal opinion and should not be interpreted as an investment advice, and/or offer, and/or a persistent request for carrying out financial transactions, and/or a guarantee, and/or a forecast of future events.

The Week Ahead: Critical Support

By Orbex

USDJPY bounces as risk assets overheat

usdjpy

The greenback has come to the moment of truth, after rallying to a three-month high, will there be enough buyers to sustain the momentum? Lousy job market and near-zero inflation may continue to hammer the buck as the central bank is unlikely to shift from its dovish stance soon.

However, one should not disregard the power of buying the dip as the US dollar bounced back from last March’s low. Covering from a heavily loaded short side may have prompted traders to reassess the sentiment.

If the pair stays above 103.30, more buying interests could join in for a U-turn, if not, the latest rally could be a mere flag consolidation.

AUDNZD recovers on domestic resilience

The Australian dollar has recouped most of its losses against its neighbor despite the ongoing trade war between China and Australia. Investors seem to be unfazed by Beijing’s hefty tariffs and the fact that the country represents nearly 40% of Australia’s goods exports.

This would mean that their attention has shifted to Australia’s economic recovery. If the labor and inflation data continue to show resilience this week, the currency could see more upside.

The pair is heading towards the previous high of 1.0840 and a bullish breakout would resume the uptrend. Failing that 1.0540 is a key support level in case of a retracement.

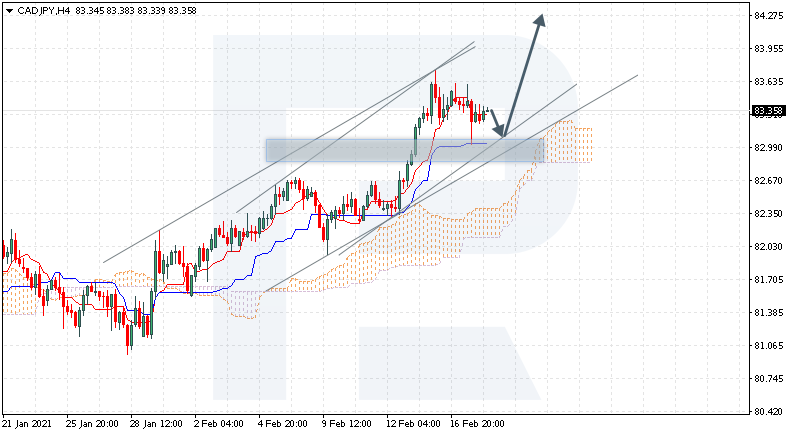
CADJPY rise backed by oil rally

The loonie is grinding towards a twelve-month high as the rally in oil prices has provided the currency a strong tailwind. Canada’s weak jobs report earlier this month barely jittered the market.

It was a sign that the underlying momentum has remained robust, and it would take a lot of disappointment in the upcoming inflation figures to put a dent in the bullish sentiment, which seems unlikely according to the consensus.

The uptrend would be intact as long as price action stayed above the psychological level of 81.00. If the pair overcomes the intermediate hurdle of 83.00, the next target would be last February’s high of 84.60.

EURGBP slides to a 10-month low

The euro continues to lose ground to the pound much due to technical rather than fundamental selling. It is worthwhile to note that the UK and EU are still wrestling on trade relations, especially in regards to financial services equivalence, which accounts for 40% of service exports to the EU. Volatility is currently subdued as traders are yet to commit their chips, but news of Brexit 2.0 will surely make a comeback.

In the meantime, growth and inflation data from both sides may trigger some intraday whipsaws near April’s low of 0.8680. Should the support stand firm short coverings could help the pair rebound to 0.8900.
By Orbex

The Analytical Overview of the Main Currency Pairs on 2021.02.15

by JustForex

The EUR/USD currency pair

Technical indicators of the currency pair:
  • Prev Open: 1.2129
  • Prev Close: 1.2119
  • % chg. over the last day: -0.08%.

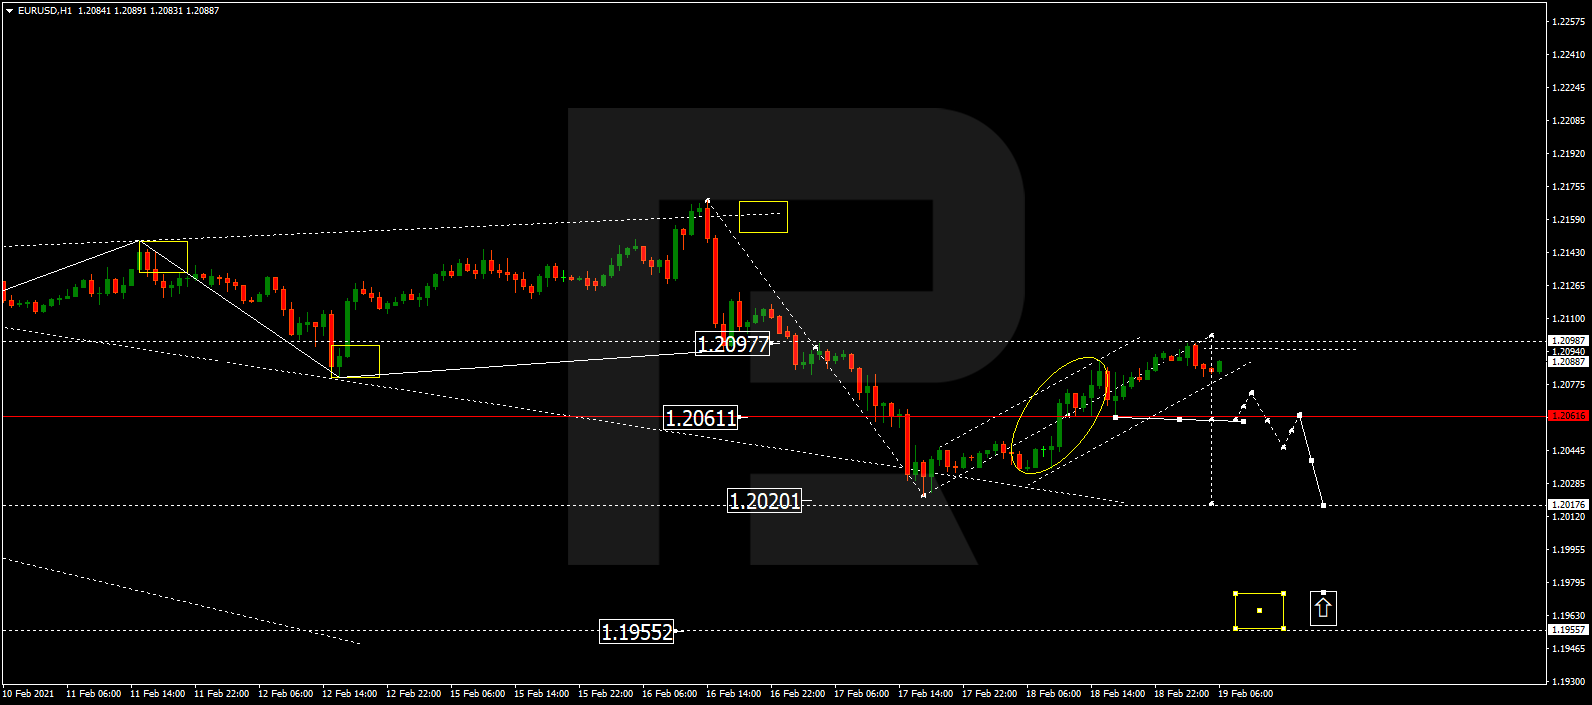
The EUR/USD on Friday fell to the support level, but the disappointing data from the University of Michigan brought the pair back to weekly highs. Inflation expectations in the US are growing much faster, which puts pressure on the US dollar.

Trading recommendations
  • Support levels: 1.2081, 1.2059
  • Resistance levels: 1.2155, 1.2189

The main scenario for trading the EUR/USD is buying on a decline. The ADX has slightly reacted to the rise of the pair in the Asian session, but the oscillator is directed upwards. This indicates the likelihood of gradual growth. As long as the price is above the moving averages, long positions will be relevant.

Alternative scenario: if the price manages to consolidate below the level of 1.2118, the pair may return to the area of 1.2081  – 1.2059.

EUR/USD
There is no news feed for today.

The GBP/USD currency pair

Technical indicators of the currency pair:
  • Prev Open: 1.3812
  • Prev Close: 1.3847
  • % chg. over the last day: +0.25%

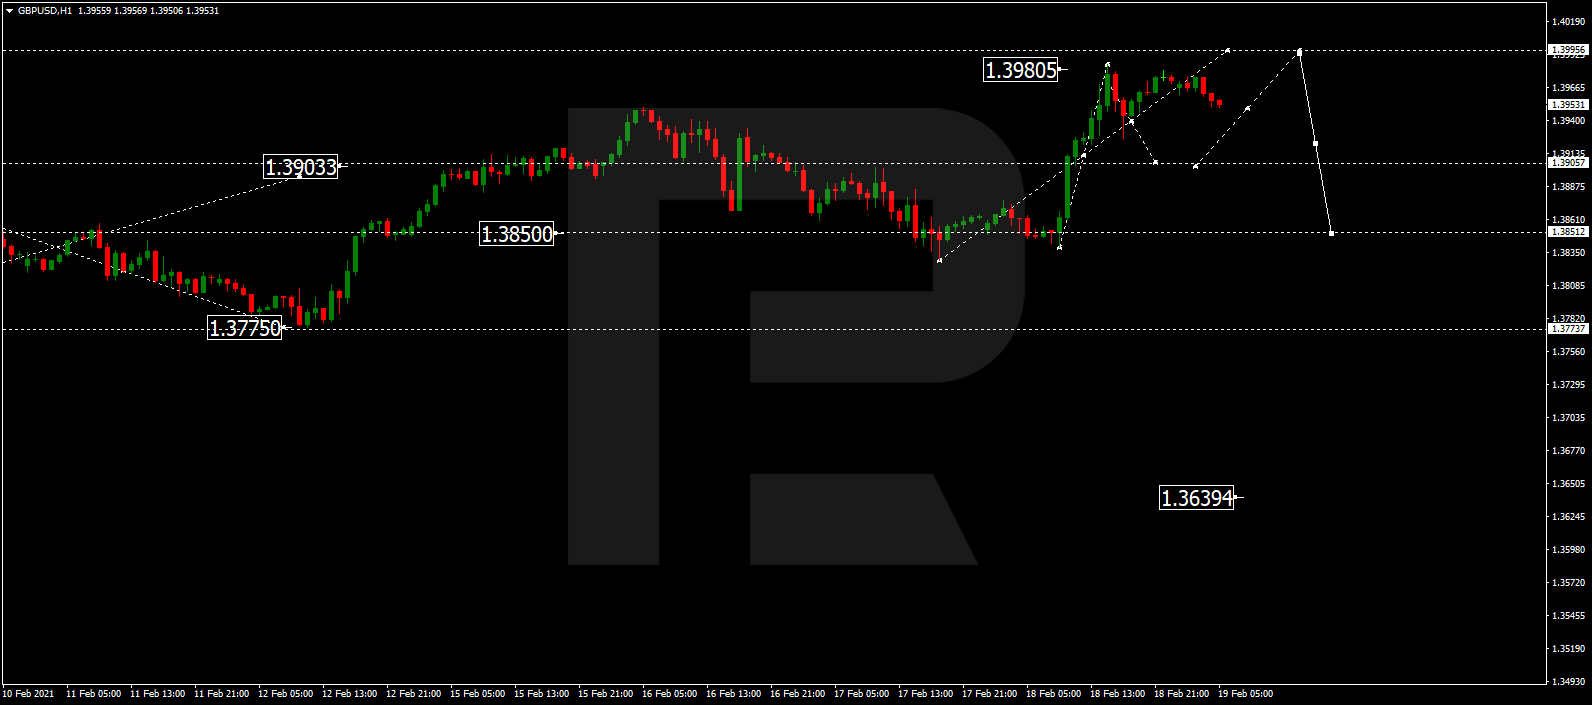
The sterling continues to set its annual highs, gradually moving towards the round 1.4000. The market continues to ignore the negative data in the UK, but growth is accelerating due to the decline in the dollar. As a result, the pound remains the leader in the foreign exchange market, showing the largest gains against the dollar.

Trading recommendations
  • Support levels: 1.3775, 1.3757
  • Resistance levels: 1.3900, 1.4000

The main scenario for trading the GBP/USD is buying on a decline. The decline on Friday was interrupted during the American session. At the end of the day, a bullish engulfing pattern was formed on the daily candlestick. This indicates strong upward momentum. But the ADX has already entered the short-term overbought area, which increases the likelihood of a pullback to the moving averages in the 1.3830 area.

Alternative scenario: if the pair consolidates below 1.3830, it may return to 1.3775.

GBP/USD
There is no news feed for today.

The USD/JPY currency pair

Technical indicators of the currency pair:
  • Prev Open: 104.72
  • Prev Close: 104.92
  • % chg. over the last day: +0.19%

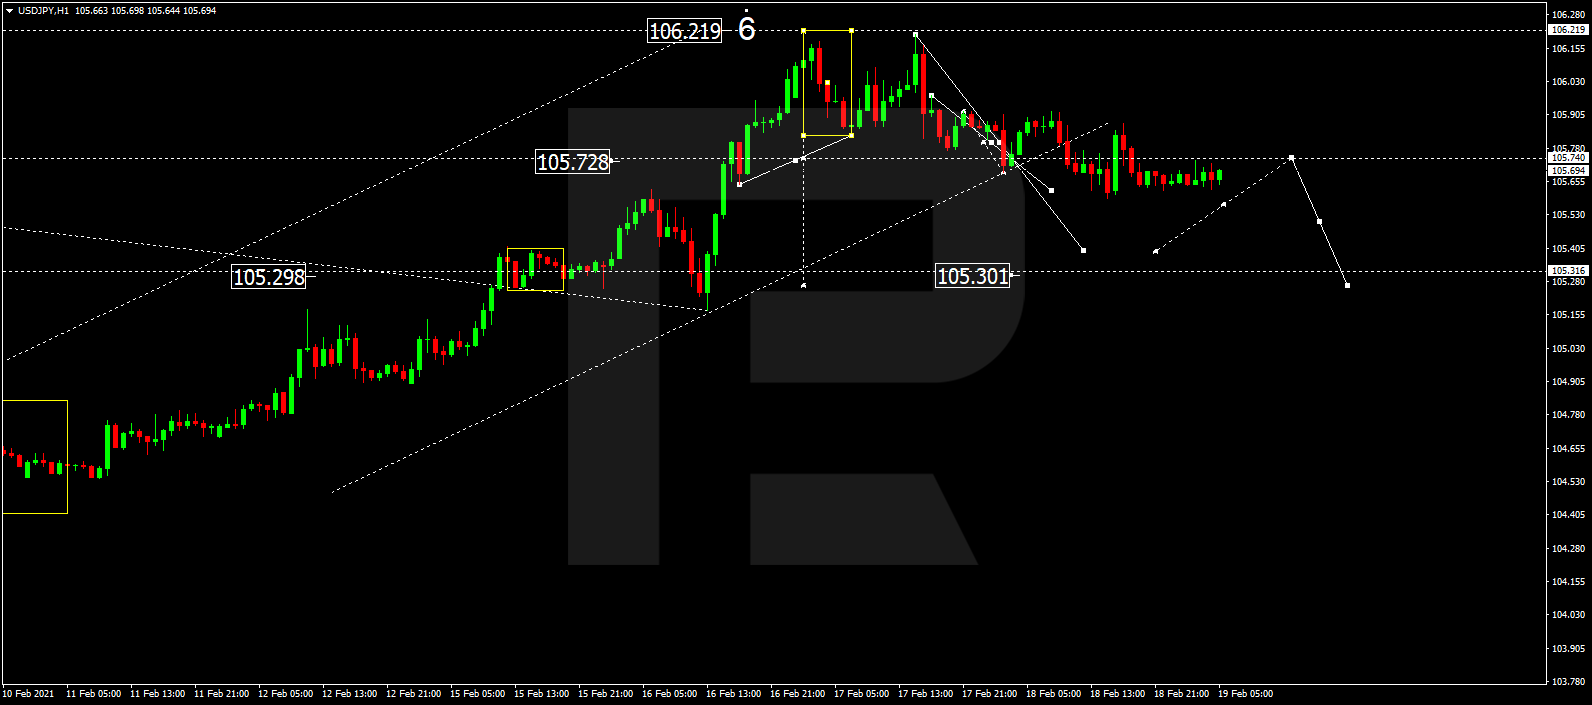
The dollar-yen showed a slight increase on Friday. Despite the decline in the dollar index, the pair managed to close the day in positive territory amid rising bond yields and the stock market. The risky assets set a new record, which supported the growth of quotations.

Trading recommendations
  • Support levels: 104.40, 103.56
  • Resistance levels: 105.68, 106.12

The main scenario is trading in a sideways range between 104.95 – 104.40. Specifications have barely changed since Friday. There are slight signs of growth, but the move is likely to be slow. The ADX shows almost no reaction to price growth.

An alternative scenario assumes the price-fixing above 104.95. In this case, the pair may rise to 105.68. A breakеthrough of 104.40 could send the pair down to 103.56.

USD/JPY
There is no news feed for today.

The USD/CAD currency pair

Technical indicators of the currency pair:
  • Prev Open: 1.2700
  • Prev Close: 1.2686
  • % chg. over the last day: -0.11%

After a correctional pullback, the pair moved to a sharp decline. The oil market saw a surge in prices, as a result of which the black gold rose in price by about 2.5%. The Canadian dollar strengthened, and a bearish engulfing pattern was formed on the daily chart.

Trading recommendations
  • Support levels: 1.2666, 1.2590
  • Resistance levels: 1.2781, 1.2844

The main scenario is selling. The ADX and the MACD showed a significant reaction to the last wave of decline. Although the price has stopped near the 1.2666 support level, forming a local “double bottom” pattern, the probability of a breakdown and further decline remains.

Alternative scenario: if the price manages to gain a foothold above 1.2701, the pair may resume its growth to the resistance level of 1.2762.

USD/CAD
There is no news feed for today.

by JustForex


This article reflects a personal opinion and should not be interpreted as an investment advice, and/or offer, and/or a persistent request for carrying out financial transactions, and/or a guarantee, and/or a forecast of future events.

Ichimoku Cloud Analysis 12.02.2021 (LTCUSD, BRENT, USDRUB)

Article By RoboForex.com

LTCUSD, “Litecoin vs US Dollar”

LTCUSD is trading at 180.68; the instrument is moving above Ichimoku Cloud, thus indicating an ascending tendency. The markets could indicate that the price may test Tenkan-Sen and Kijun-Sen at 176.75 and then resume moving upwards to reach 214.50. Another signal in favor of a further uptrend is a rebound from the downside border of the Triangle pattern. However, the bullish scenario may no longer be valid if the price breaks the cloud’s downside border and fixes below 135.55. In this case, the pair may continue falling towards 125.05. To confirm further growth, the asset must break the pattern’s upside border and fix above 195.05.

LTCUSD
Risk Warning: the result of previous trading operations do not guarantee the same results in the future

BRENT

Brent is trading at 60.39; the instrument is moving above Ichimoku Cloud, thus indicating an ascending tendency. The markets could indicate that the price may test the cloud’s upside border at 58.05 and then resume moving upwards to reach 63.15. Another signal in favor of a further uptrend will be a rebound from the rising channel’s downside border. However, the bullish scenario may no longer be valid if the price breaks the cloud’s downside border and fixes below 57.05. In this case, the pair may continue falling towards 56.35.

BRENT
Risk Warning: the result of previous trading operations do not guarantee the same results in the future

USDRUB, “US Dollar vs Russian Ruble”

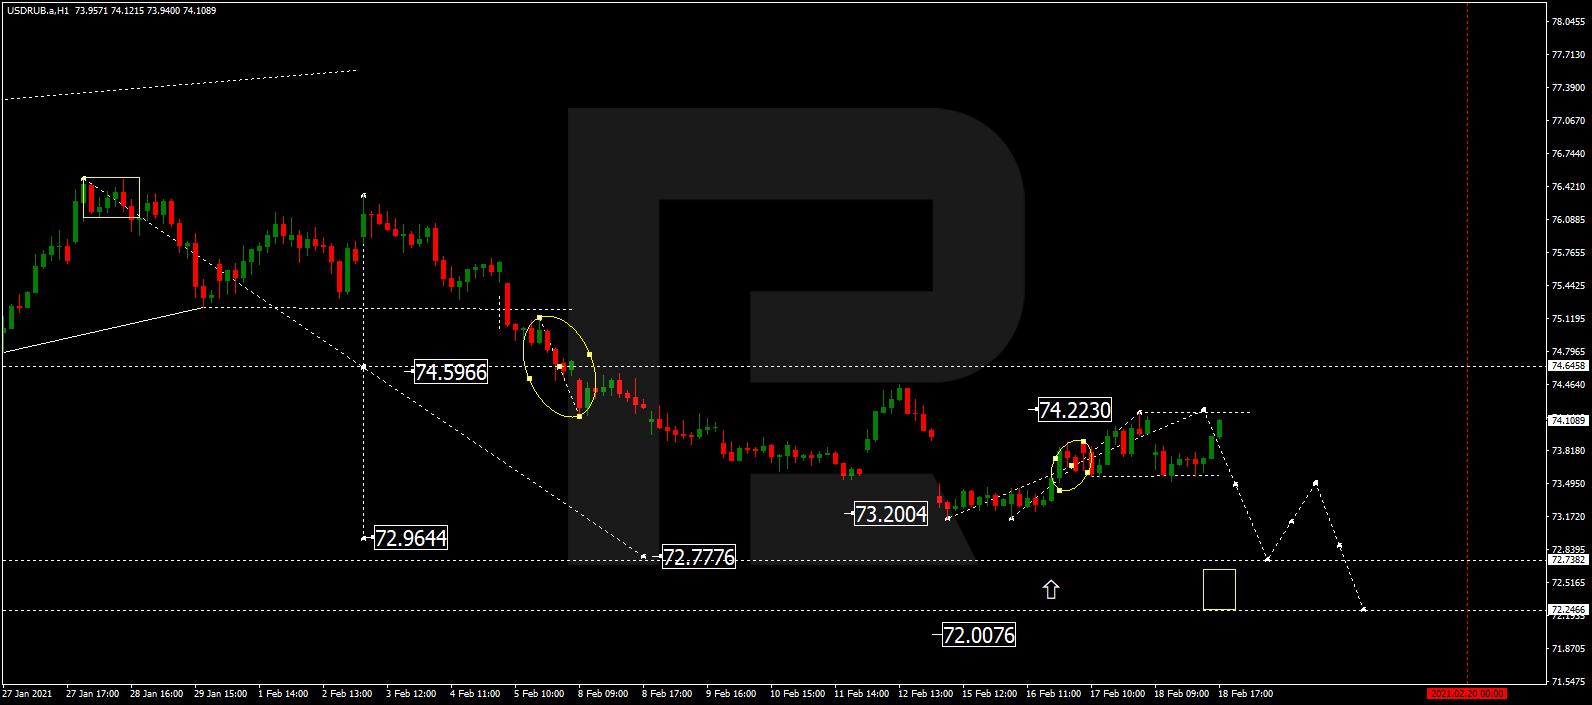
USDRUB is trading at 73.55; the instrument is moving below Ichimoku Cloud, thus indicating a descending tendency. The markets could indicate that the price may test Tenkan-Sen and Kijun-Sen at 74.05 and then resume moving downwards to reach 71.95. Another signal in favor of a further downtrend will be a rebound from the descending channel’s upside border. However, the bearish scenario may be canceled if the price breaks the cloud’s upside border and fixes above 75.75. In this case, the pair may continue growing towards 76.65. To confirm further decline, the asset must break the support area and fix below 72.75. As one can see, the price has already rebounded from this level three times.

USDRUB

Article By RoboForex.com

Attention!
Forecasts presented in this section only reflect the author’s private opinion and should not be considered as guidance for trading. RoboForex LP bears no responsibility for trading results based on trading recommendations described in these analytical reviews.

Britain experienced its largest economic contraction since 1709

by JustForex

The shares rally was paused on Thursday and declined on Friday morning. One of the reasons was the lack of progress in the Brexit negotiations. The country’s withdrawal from the EU was 6 weeks ago, but it hasn’t been possible to resolve a dispute regarding a trade with Northern Ireland so far. On Thursday, four-hour negotiations came to nothing again. The sterling declined together with Gilts.

Minister for the Cabinet Office Michael Gove and European Commission Vice-President Maros Sefcovic held a meeting in London, which their teams described as “frank but meaningful”. However, the key trade differences that have strained the UK-EU relationship over the past six weeks haven’t been resolved. The ministers promised to intensify their work with the common goal of finding functional solutions.

Since the Brexit transition period ended on December 31, tensions between the two sides have intensified on a number of issues, including the financial services trading, the supply of Covid-19 vaccines, and the goods flow between mainland Britain and Northern Ireland.

Meanwhile, the UK Office for National Statistics released data on economic growth in the fourth quarter. At the end of the year, GDP increased twice as much as expected. The preliminary estimate was 1%. For the whole year, the UK economy lost 9.9%, which is the worst metric since 1709.

Fourth-quarter results confirm the Bank of England’s estimation that growth will boost when a large-scale vaccination campaign begins. Central Bank Chief Economist Andy Haldane expects consumer spending to rise by £250 billion from savings accumulated by households during the lockdown.

After the closure of trading floors in China, there is a correction across the entire spectrum of the market. Oil lost just over 2%. Treasury yield decreased to 1.50%. World stock indices are showing a tendency towards correction.

Main market quotes:

S&P 500 (F) 3,896.38 -15.62 (-0.40%)

Dow Jones 31,430.70 -7.10 (-0.02%)

DAX 13,945.45 -95.46 (-0.68%)

FTSE 100 6,497.85 -30.87 (-0.47%)

USD Index 90.602 +0.189 (+0.21%)

Important events:
  • – UK GDP (q/q) (q4) at 09:00 (GMT+2);
  • – UK Manufacturing Output (m/m) (Dec) at 09:00 (GMT+2);
  • – University of Michigan United States Consumer Sentiment (Feb) at 17:00 (GMT+2).

by JustForex


This article reflects a personal opinion and should not be interpreted as an investment advice, and/or offer, and/or a persistent request for carrying out financial transactions, and/or a guarantee, and/or a forecast of future events.

The Analytical Overview of the Main Currency Pairs on 2021.02.12

by JustForex

The EUR/USD currency pair

Technical indicators of the currency pair:
  • Prev Open: 1.2118
  • Prev Close: 1.2130
  • % chg. over the last day: +0.10%.

EUR/USD currency pair managed to increase a bit at the end of the day. The weekly gain has slowed down significantly, and intraday volatility has decreased to 40 pips. One of the reasons for this situation is the decrease in liquidity. At the end of the week, the Chinese market closed until next week. A calm trading atmosphere can be expected today.

Trading recommendations
  • Support levels: 1.2059, 1.1952
  • Resistance levels: 1.2155, 1.2189

The main trading scenario for EUR/USD is trading in a sideways range between 1.2111 – 1.2155. The MACD gradually declined to zero. The ADX is seamlessly decreasing to minimum values. At the same time, the price shows minor fluctuations near the SMA 50. This suggests that the bullish scenario remains in the medium term, but intraday trading in a narrow sideways range can be expected.

Alternative scenario: if the price can fix below the level of 1.2111, the pair may return to the zone of 1.2072 – 1.2059. A break-through of 1.2155 might send the pair towards 1.2189.

EUR/USD
News feed for 2021.02.12:
  • – University of Michigan United States Consumer Sentiment (Feb) at 17:00 (GMT+2).

The GBP/USD currency pair

Technical indicators of the currency pair:
  • Prev Open: 1.3831
  • Prev Close: 1.3813
  • % chg. over the last day: -0.13%

The sterling closed the day in the red zone by contrast with the euro. Disagreements with the European Union regarding the trade with Northern Ireland are beginning to put pressure on the British currency. The problem in this region wasn’t resolved until the UK officially left the EU. During Thursday’s meeting, the ministers failed to come to a common decision again, which puts pressure on the profitability of the British Gilts and the GBP quotes.

Trading recommendations
  • Support levels: 1.3757, 1.3680
  • Resistance levels: 1.3866, 1.3900

The main scenario in GBP/USD is selling. Although the medium-term north trend is still strong, the intraday picture looks bearish. The ADX reacted to the decline in quotations significantly, while the MACD moved into the negative zone. The price is preparing to fix below SMA 100. These are all the signs of a progressing correction.

Alternative scenario: if the pair fixes above 1.3825, it may return to 1.3866.

GBP/USD
News feed for 2021.02.12:
  • – UK GDP (q/q) (q4) at 09:00 (GMT+2).

The USD/JPY currency pair

Technical indicators of the currency pair:
  • Prev Open: 104.57
  • Prev Close: 104.73
  • % chg. over the last day: +0.15%

The dollar-yen currency pair showed a slight pullback on Thursday. The stock market is completely calm, which allows the bulls to take a little break. There won’t be any important data, and low volatility trading might be observed today.

Trading recommendations
  • Support levels: 104.40, 103.56
  • Resistance levels: 105.68, 106.12

The main scenario is trading in a sideways range between 104.95 – 104.40. The MACD has gradually moved into the positive zone, but other indicators remain in equilibrium. The price keeps between the moving averages, and the ADX is near the minimum values.

An alternative scenario assumes the price-fixing above 104.95. In this case, the pair may rise to 105.68. A break-through of 104.40 could send the pair down to 103.56.

USD/JPY
News feed for 2021.02.12:
  • – University of Michigan United States Consumer Sentiment (Feb) at 17:00 (GMT+2).

The USD/CAD currency pair

Technical indicators of the currency pair:
  • Prev Open: 1.2697
  • Prev Close: 1.2699
  • % chg. over the last day: +0.01%

The Canadian dollar is gradually falling amid a pullback in the oil market. Brent and WTI oil fell by almost $1, which allows developing a slight correction in the pair. But there is no talk about a reversal yet. The oil market is still in an uptrend.

Trading recommendations
  • Support levels: 1.2666, 1.2590
  • Resistance levels: 1.2781, 1.2844

The main scenario is risk-averse buyings. The ADX reacted to yesterday’s bounce mildly, which indicates a weak bullish sentiment. But the price was able to fix above the moving averages and this gives a signal for a gradual rise to 1.2781.

Alternative scenario: if the price manages to fix below 1.2695, the pair may resume its decline to the resistance level of 1.2666.

USD/CAD
There is no news feed for today.

by JustForex


This article reflects a personal opinion and should not be interpreted as an investment advice, and/or offer, and/or a persistent request for carrying out financial transactions, and/or a guarantee, and/or a forecast of future events.

Japanese Candlesticks Analysis 11.02.2021 (EURUSD, USDJPY, EURGBP)

Article By RoboForex.com

EURUSD, “Euro vs. US Dollar”

As we can see in the H4 chart, the ascending tendency continues. Right now, after forming several reversal patterns, including Harami, close to the support level, EURUSD may reverse and start a new growth. In this case, the upside target may be at 1.2210. However, an alternative scenario implies that the price may correct to reach 1.2050 before testing 1.2210.

EURUSD
Risk Warning: the result of previous trading operations do not guarantee the same results in the future

USDJPY, “US Dollar vs. Japanese Yen”

As we can see in the H4 chart, USDJPY is testing the channel’s downside border; earlier, it formed a Hammer reversal pattern. Judging by the previous movements, one may assume that the asset may reverse and resume trading upwards. In this case, the upside target is the resistance area at 105.55. At the same time, an opposite scenario implies that the price may continue its decline to return to 104.00 before resuming its ascending movement.

USDJPY
Risk Warning: the result of previous trading operations do not guarantee the same results in the future

EURGBP, “Euro vs. Great Britain Pound”

As we can see in the H4 chart, after forming several reversal patterns, such as Hammer, not far from the support level, EURGBP is reversing and forming another pullback. In this case, the upside target remains at the resistance area at 0.8830. However, judging by previous movements, the pair may yet continue its decline to reach 0.8690 without correcting towards the resistance area.

EURGBP

Article By RoboForex.com

Attention!
Forecasts presented in this section only reflect the author’s private opinion and should not be considered as guidance for trading. RoboForex LP bears no responsibility for trading results based on trading recommendations described in these analytical reviews.

Soft Inflation Data Keeps USD Pressured

By Orbex

EURUSD Rises To A Two-Week High

eurusd

The euro currency continues to push higher, rising for the third consecutive day, to a two-week high.

The gains, however, are slowing as price moves closer to the 1.2144 – 1.2177 level of resistance. We also continue to see the hidden bearish divergence on the chart, which could suggest a pullback.

To the downside, price is likely to stall near the 1.2050 level of support for the moment. However, a close below this level could see the Feb 5 lows of 1.1952 come into the picture.

If the current bullish moment continues, then the euro currency will need to break out above 1.2177 to confirm further upside.

GBPUSD Pushes Higher But Gives Back Gains

gbpusd

The British pound sterling continues to rise higher, marking a new high of 1.3866 intraday. But price action is pulling back after testing this level.

The Stochastics oscillator is firmly in the overbought levels supporting the upside bias. For the moment, the downside remains limited until we see a lower high forming.

Given the current pace of gains, the GBPUSD is seen testing the support area of 1.3790.

A strong close on a weekly basis above this level is needed to confirm further upside.

For the moment, the untested support level near 1.3759 will be the likely downside target in case of a correction.

Oil Price Grinds Higher To A New 13-Month High

wti crude oil

WTI crude oil prices continue to maintain a strong bullish moment.

Price action rose to fresh highs of 58.73. This makes price action likely to test the unfilled gap from January 20 last year at 59.47

However, with price now trading below the trend line, this could act as a potential resistance for price action.

To the downside, the support level at 57.35 is already tested albeit only slightly.

Therefore, any declines could see this level coming under a firm re-test. Only a strong close below 57.35 will confirm a move down to the 53.77 level of support.

Gold Prices Rejected Near 1850

xauusd

The precious metal is struggling to breakout above 1850 as price action was firmly rejected near this level intraday.

Overall, gold prices remain trading subdued compared to the gains made in the previous sessions.

We expect the precious metal to maintain a sideways range between the 1850 resistance and 1817.80 level of support in the near term.

The Stochastics oscillator is also starting to move a bit down from the overbought levels currently. This will likely mark an end to a three-day winning streak in gold.

By Orbex

Brussels Tussles With UK

By Orbex

Dollar Remains Depressed

The US index fell for a fourth consecutive session as it closed 0.10% lower on Wednesday.

Core CPI figures came in relatively flat on a monthly basis for January as the greenback looks to retreat to monthly lows.

This meant that gold held onto its modest intra-day gains and refreshed one-week tops, beyond the $1850 region.

The subdued greenback assisted the dollar-denominated commodity to gain some positive traction for another run towards the $1900 psychological handle.

However, with more budget deficits on the way, how long will this take for the yellow metal?

Fiscal Support Required After 2021

The euro finished on a level footing yesterday. This comes as European Central Bank president Lagarde reiterated that fiscal spending must remain this year and into 2022 to protect the bloc from permanent damage.

Adding to the negative sentiment, Ursula von der Leyen admitted vaccine rollout failures and acknowledged the EU had been overconfident about production targets being met.

There is anger that the bloc has fallen behind countries like the UK, as the economy stumbles once again to break free from lockdown restrictions.

Brexit Back in the Headlines

The pound closed 0.11% higher on Wednesday, capping off a fifth daily winning streak.

Britain’s successful vaccination campaign has kept the ball rolling, as more than 12 million people have already received the jab.

However, Brussels could put an end to the bullish rally, as they have rejected UK requests to overturn an export ban, escalating a dispute over seafood that has soured post-Brexit relations.

Brussels has also sent out a warning shot to the UK, addressing shortcomings on customs rules for the Northern Ireland border.

Stocks Close Mixed

Indices saw little movement on Wednesday. However, the Dow managed to close 0.20% higher and set another record close.

This came as Fed chairman Powell said he remained focused on getting Americans back to work and downplayed the risk of any runaway inflation.

However, investors were more inclined to focus on Biden’s proposed stimulus package, as the Democrats and Republicans drag out the small print.

EIA Lifts Oil Price Outlook

Oil ended yesterday’s session indecisively as the recent rally came to a brief halt.

The EIA revised its crude price forecast higher in its monthly outlook, with expectations of WTI to average over $50 in 2022.

In addition, crude oil inventories fell by 6.644 million barrels last week, a third consecutive week of declines as bulls look for further momentum.

By Orbex

Murrey Math Lines 11.02.2021 (USDCHF, GOLD)

Article By RoboForex.com

USDCHF, “US Dollar vs Swiss Franc”

In the H4 chart, after breaking the 200-day Moving Average, USDCHF is trading below it, thus indicating a tendency reversal and a further decline. In this case, the price is expected to break 3/8 and then continue falling to reach the support at 2/8. Still, this scenario may no longer be valid if the price breaks 4/8 to the upside. After that, the instrument may grow to reach the resistance at 5/8.

USDCHF_H4
Risk Warning: the result of previous trading operations do not guarantee the same results in the future

As we can see in the M15 chart, the pair has broken the downside line of the VoltyChannel indicator and, as a result, may continue the descending tendency.

USDCHF_M15
Risk Warning: the result of previous trading operations do not guarantee the same results in the future

XAUUSD, “Gold vs US Dollar”

As we can see in the H4 chart, XAUUSD has rebounded from the 200-day Moving Average once again. In this case, the price is expected to break 1/8 and then continue falling to reach the support at 0/8. However, this scenario may no longer be valid if the price breaks the resistance at 3/8 to the upside. After that, the instrument may continue growing towards 5/8.

XAUUSD_H4
Risk Warning: the result of previous trading operations do not guarantee the same results in the future

In the M15 chart, the price may break the downside line of the VoltyChannel indicator and, as a result, continue falling.

XAUUSD_M15

Article By RoboForex.com

Attention!
Forecasts presented in this section only reflect the author’s private opinion and should not be considered as guidance for trading. RoboForex LP bears no responsibility for trading results based on trading recommendations described in these analytical reviews.