Archive for Forex and Currency News – Page 305

Forex Technical Analysis & Forecast 02.03.2021

Article By RoboForex.com

EURUSD, “Euro vs US Dollar”

EURUSD continues the correction. Possibly, today the pair may reach 1.2010 and then form a new consolidation range near the current lows. Later, the market may break the range to the upside and form one more ascending structure to break 1.2070. After that, the instrument may continue trading upwards with the first target at 1.2140.

EURUSD
Risk Warning: the result of previous trading operations do not guarantee the same results in the future

GBPUSD, “Great Britain Pound vs US Dollar”

GBPUSD is still consolidating near the lows. Possibly, the pair may expand the range 1.3820 to extend the correction. Later, the market may form the first ascending wave with the target at 1.4138.

GBPUSD
Risk Warning: the result of previous trading operations do not guarantee the same results in the future

USDRUB, “US Dollar vs Russian Ruble”

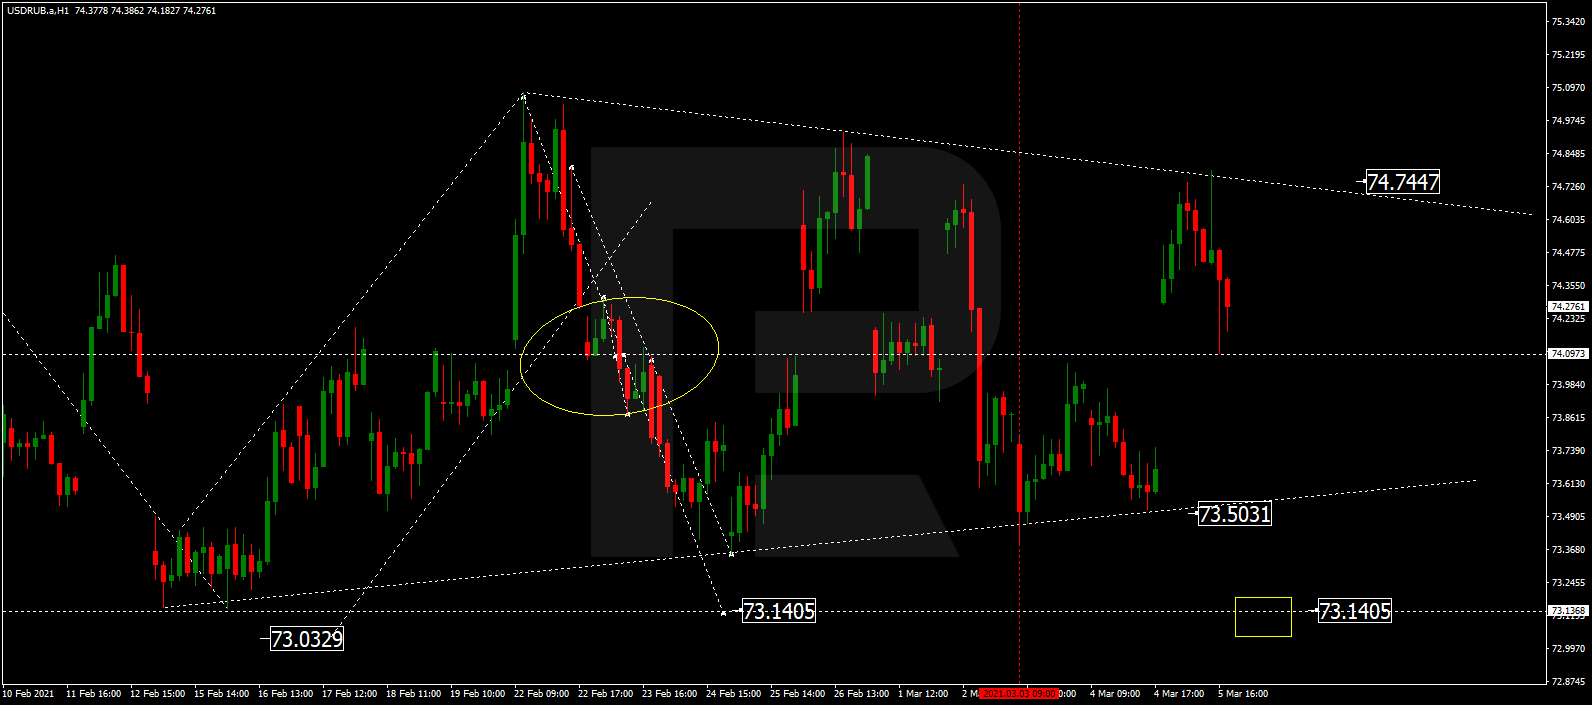
USDRUB is still consolidating around 74.58. Today, the pair may grow to reach 75.00 and then fall to return to 74.58. If later the price breaks this range to the upside, the market may start another growth with the short-term target at 75.85.

USDRUB
Risk Warning: the result of previous trading operations do not guarantee the same results in the future

USDJPY, “US Dollar vs Japanese Yen”

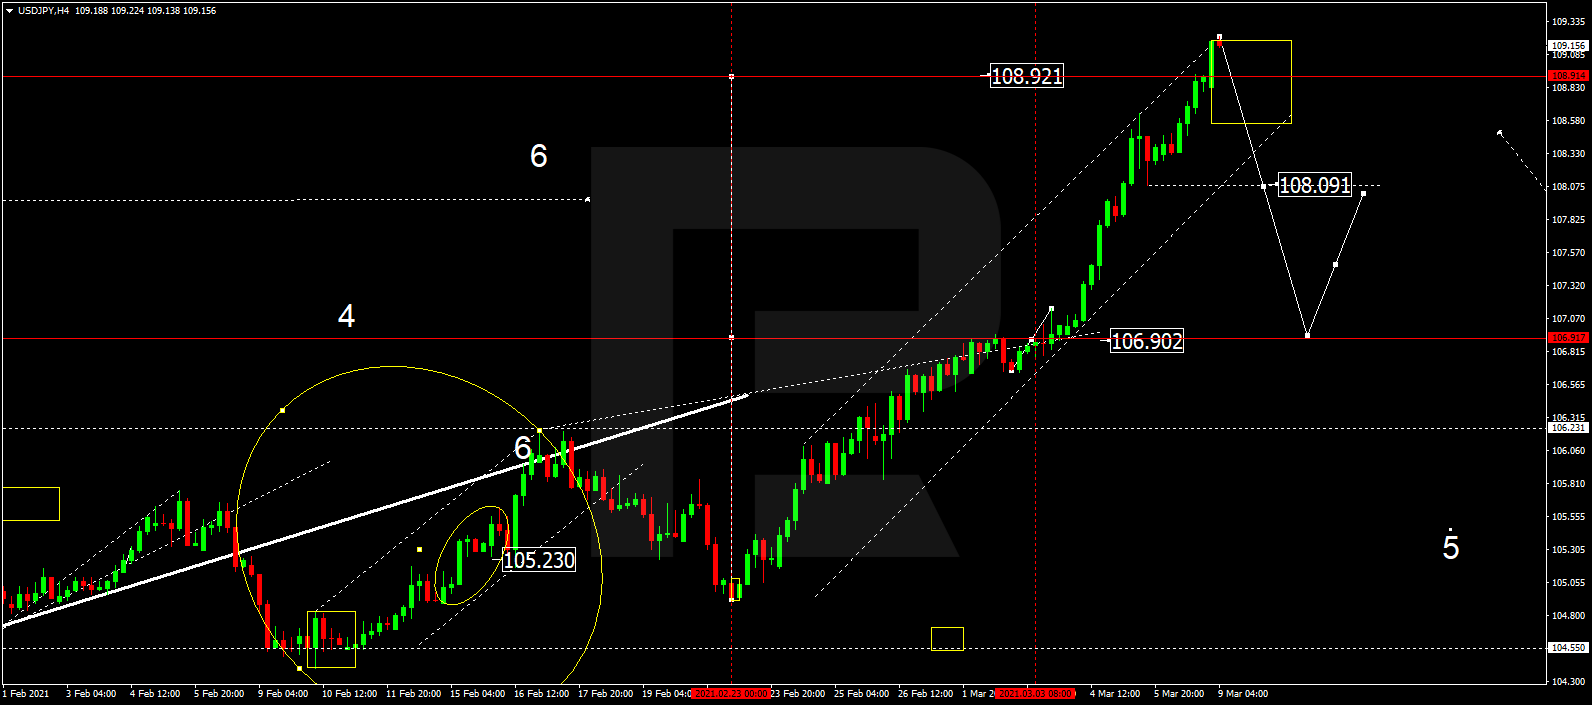
USDJPY is still consolidating around 106.60. Possibly, today the pair may fall to reach 106.33 and then grow to return to 106.60. Later, the market may break the range to the downside and resume trading downwards with the first target at 105.80.

USDJPY
Risk Warning: the result of previous trading operations do not guarantee the same results in the future

USDCHF, “US Dollar vs Swiss Franc”

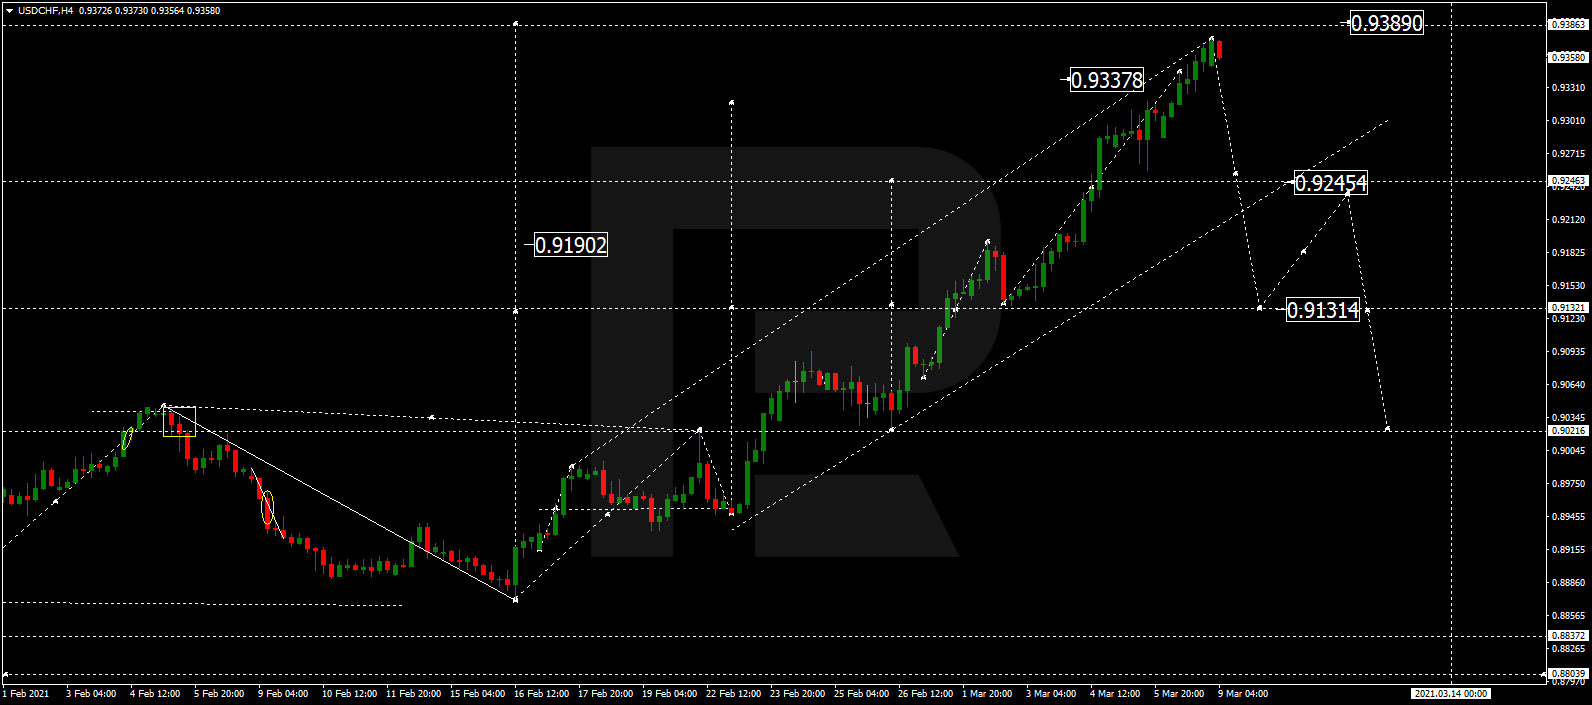
USDCHF is still consolidating around 0.9140. Today, the par may break the range to the downside and then start a new decline with the first target at 0.9044.

USDCHF
Risk Warning: the result of previous trading operations do not guarantee the same results in the future

AUDUSD, “Australian Dollar vs US Dollar”

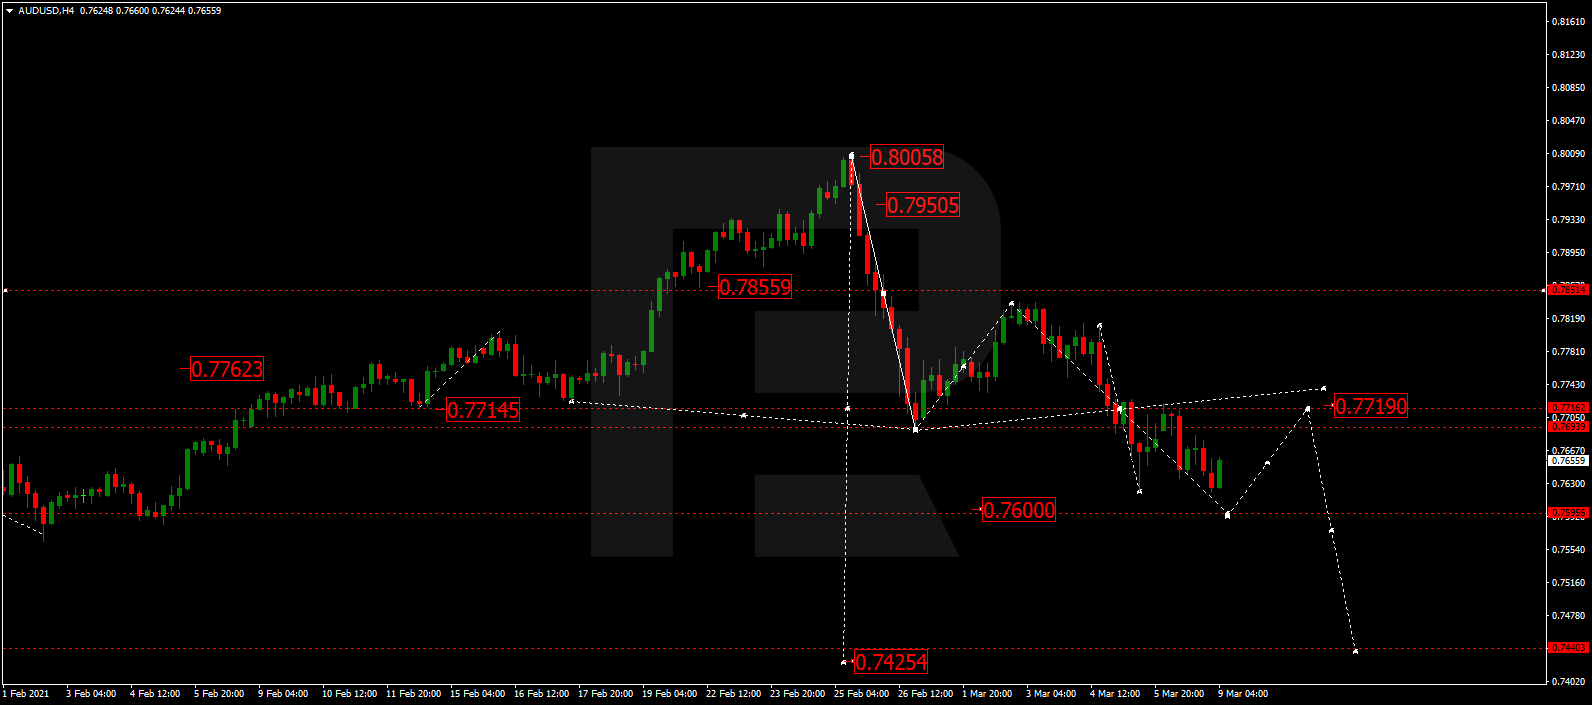
AUDUSD is moving upwards to reach 0.7848. After that, the instrument may start a new decline towards 0.7760 and then form one more ascending structure with the target at 0.7950.

AUDUSD
Risk Warning: the result of previous trading operations do not guarantee the same results in the future

BRENT

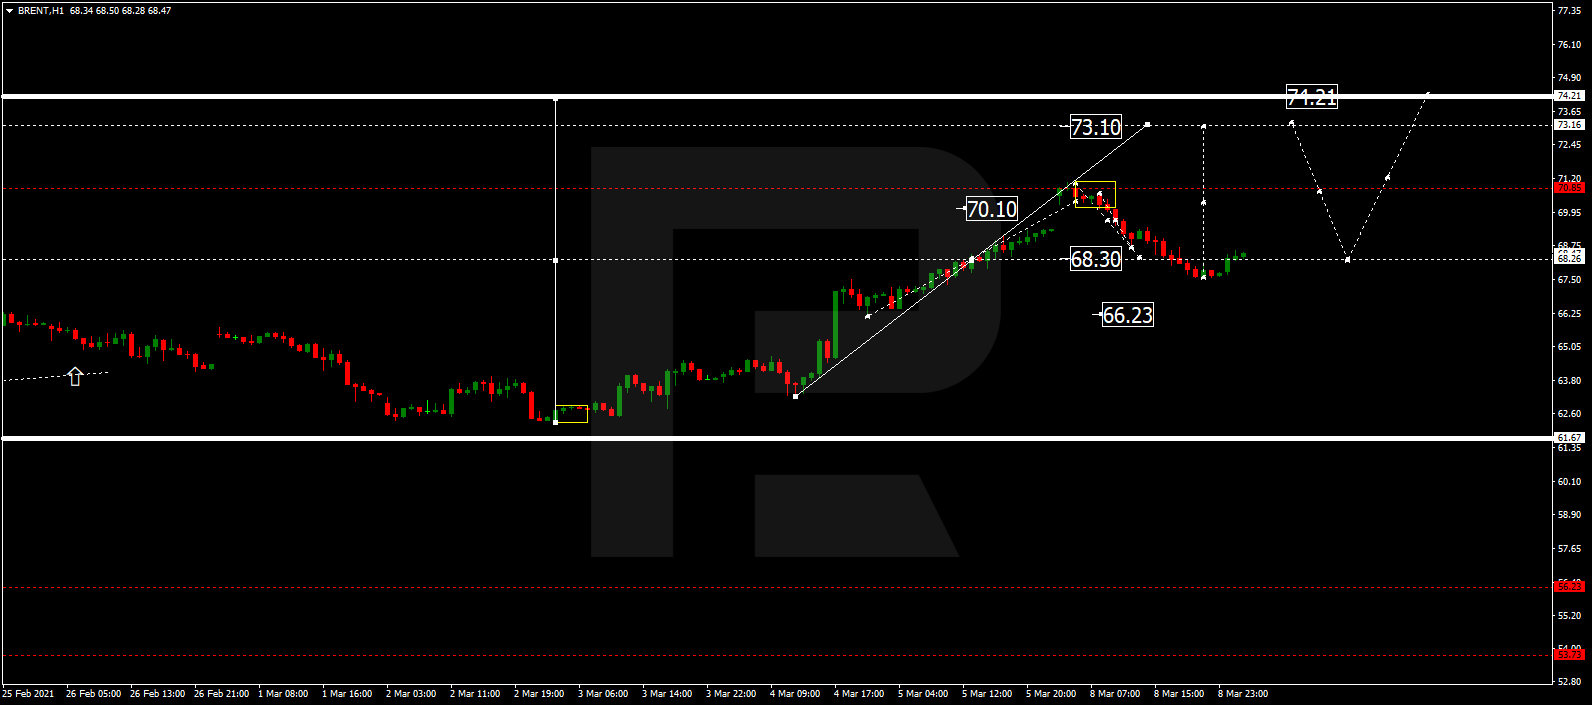
After breaking 64.00 to the downside, Brent is expected to correct with the short-term target at 62.22. Later, the market may form one more ascending structure to test 64.00 from below and then resume moving downwards with the target at 61.00.

BRENT
Risk Warning: the result of previous trading operations do not guarantee the same results in the future

XAUUSD, “Gold vs US Dollar”

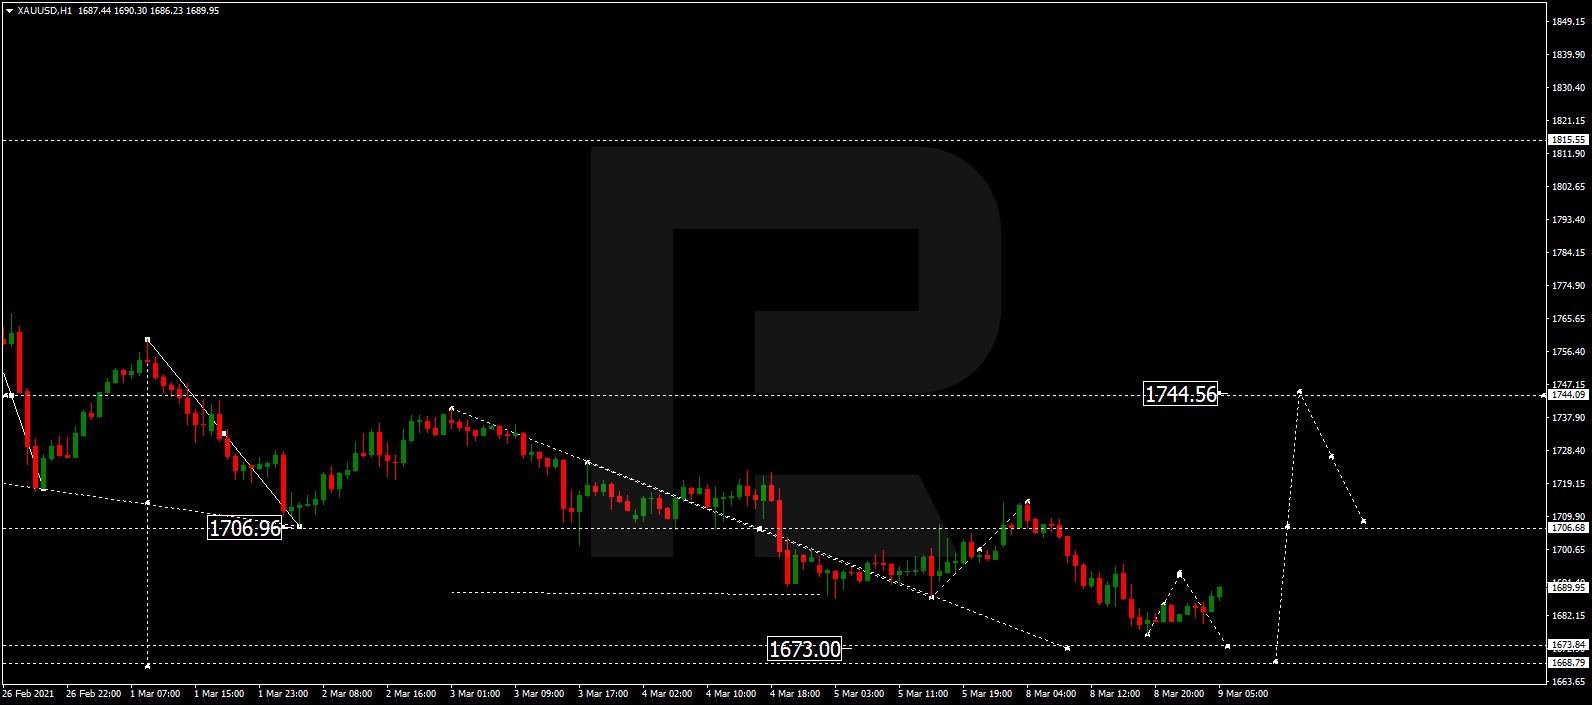
After rebounding from 1759.00, Gold is falling towards 1702.72. Possibly, the metal may reach 1700.00 to complete the descending wave. After that, the instrument may resume growing with the first target at 1760.00.

GOLD
Risk Warning: the result of previous trading operations do not guarantee the same results in the future

BTCUSD, “Bitcoin vs US Dollar”

BTCUSD has finished the ascending wave at 50000.00 and may consolidate there. If later the price breaks this range to the downside, the market may resume trading downwards to reach 41700.00; if to the upside – start another growth with the target at 60000.00.

BITCOIN
Risk Warning: the result of previous trading operations do not guarantee the same results in the future

S&P 500

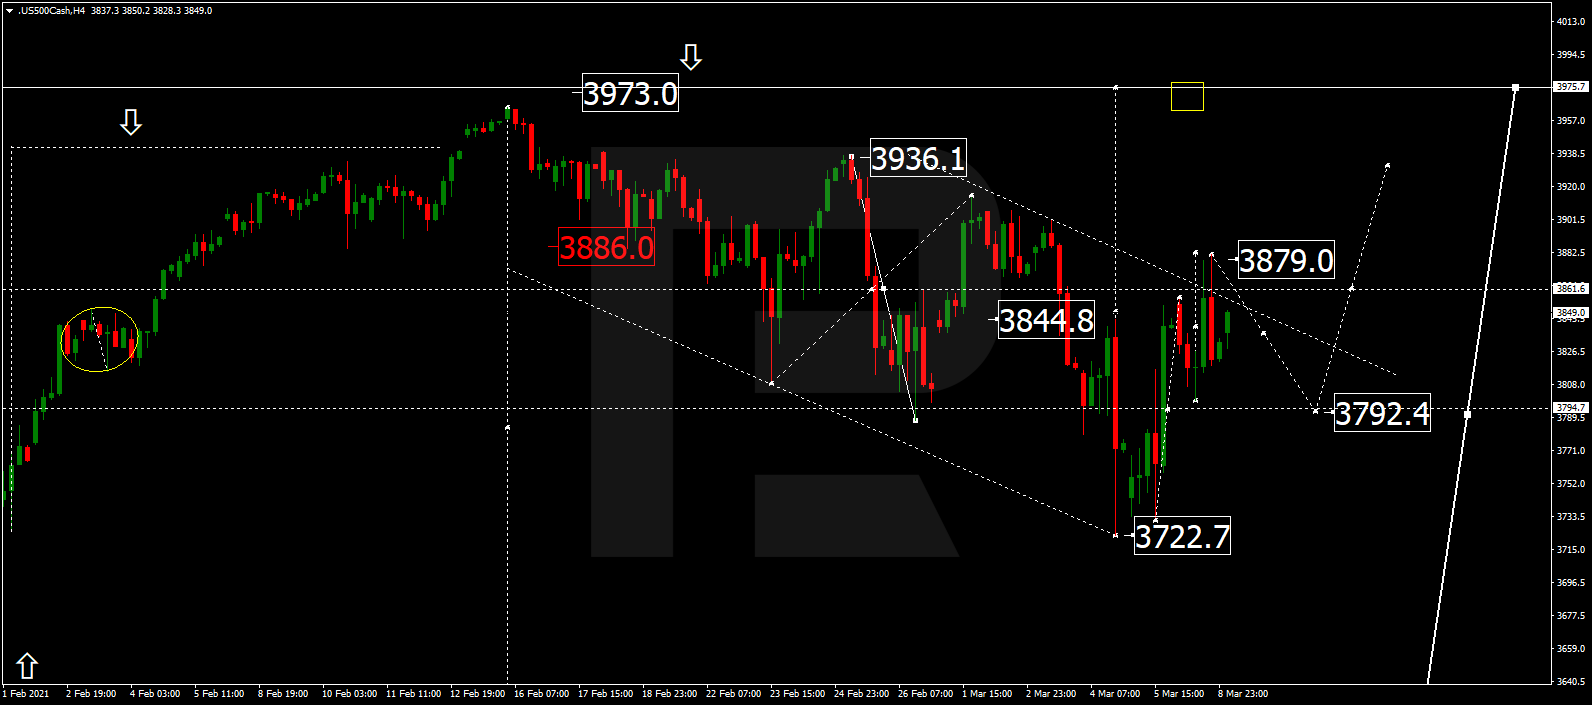
After breaking 3800.0 to the upside, the S&P index is expected to form the fifth ascending structure to reach 3973.0. Later, the market may resume trading downwards with the target at 3611.0.

S&P 500

Article By RoboForex.com

Attention!
Forecasts presented in this section only reflect the author’s private opinion and should not be considered as guidance for trading. RoboForex LP bears no responsibility for trading results based on trading recommendations described in these analytical reviews.

The Analytical Overview of the Main Currency Pairs on 2021.03.02

by JustForex

The EUR/USD currency pair

Technical indicators of the currency pair:
  • Prev Open: 1.2071
  • Prev Close: 1.2048
  • % chg. over the last day: -0.19%

Trading on Monday was calmer than on Friday. The euro showed a gradual decline against the dollar in light of positive data from the US ISM. At the same time, the dollar index almost reached the SMA 100 moving average on the daily chart. From a technical point of view, this is a defining moment for the market. Further strengthening of the dollar and its consolidation above the moving average may indicate a change in the direction of the foreign exchange market in the long term.

Trading recommendations
  • Support levels: 1.2023, 1.1952
  • Resistance levels: 1.2179, 1.2222

The main scenario for trading EUR/USD is selling. Friday’s bearish momentum continued on Monday. The ADX is growing on the decline, which indicates the presence of significant bearish pressure. But amid a slowdown of the fall, convergence has formed on the MACD, which may indicate a temporary halt or pullback.

Alternative scenario: if the price manages to gain a foothold above the level of 1.2123, the pair may return to growth up to 1.2179.

EUR/USD
News feed for 2021.03.02:
  • – Unemployment Change in Germany (Feb) at 10:55 (GMT+2);
  • – The Eurozone Consumer Price Index (CPI) (y/y) (Feb) at 09:00 (GMT+2);
  • – The FOMC Member Governor Lael Brainard Speech at 20:00 (GMT+2).

The GBP/USD currency pair

Technical indicators of the currency pair:
  • Prev Open: 1.3925
  • Prev Close: 1.3922
  • % chg. over the last day: -0.02%

On Monday, the bulls were unable to take over. The intraday growth was completely erased in the American session. The profitability of the British Gilts showed the first significant decline in the last five days. Although the pair closed with only slight losses, it left a long shadow at the top, which indicated the prevalence of bearish influence.

Trading recommendations
  • Support levels: 1.3819, 1.3775
  • Resistance levels: 1.3997, 1.4224

The main scenario for trading GBP/USD is selling. After the pullback on Monday, the decline was resumed with consolidation below the first support level. However, the ADX is hardly responsive. On the MACD, in the event of another rollback, a divergence may form. As a result, a decline is expected, but the trend may be slower.

Alternative scenario: if the pair consolidates above 1.3997, it may resume its growth.

GBP/USD
There is no news feed for today.

The USD/JPY currency pair

Technical indicators of the currency pair:
  • Prev Open: 106.53
  • Prev Close: 106.75
  • % chg. over the last day: +0.21%

The dollar-yen pair continues to grow steadily following the dollar index. At the same time, the pair has received additional support from the stock market, where positive trends are observed. Although the slowdown in growth is easy to notice, there are no signs of a reversal so far.

Trading recommendations
  • Support levels: 105.50, 104.92
  • Resistance levels: 106.94, 107.50

The main scenario is trading in a sideways range between 106.94 – 106.31. In the short term, the pair may stop or go for a correction, as divergence has formed on the MACD, and the ADX has fallen. But it is too soon to talk about selling. The H4 and D1 timeframes indicate growth over the medium term.

The alternative scenario implies the price-fixing below 106.30. In this case, the pair may return to decline to 105.50. A breakout of 106.94 could indicate further gains.

USD/JPY
News feed for 2021.03.02:
  • – The FOMC Member Governor Lael Brainard Speech at 20:00 (GMT+2).

The USD/CAD currency pair

Technical indicators of the currency pair:
  • Prev Open: 1.2727
  • Prev Close: 1.2642
  • % chg. over the last day: -0.67%

On Monday, there was a pullback after Friday’s strong north impulse. But it is too soon to talk about further decline. The oil market suddenly went down, allowing the pair to grow in the Asian session. The H4 timeframe shows a small pullback.

Trading recommendations
  • Support levels: 1.2608, 1.2467
  • Resistance levels: 1.2745, 1.2763

The main scenario is cautious buying. Technically, the pair is showing a mid-term north direction, but the movement may be limited by the first resistance level. The MACD is still near zero, and the ADX has suddenly reacted to the southern pullback. At the same time, the price is above the moving averages. Mixed technical indicators show a slowdown in growth or a temporary halt in price movement.

Alternative scenario: if the price manages to consolidate below 1.2608, the pair may resume its decline to 1.2450.

USD/CAD
News feed for 2021.03.02:
  • – The GDP of Canada (q/q) (4q) at 15:30 (GMT+2);
  • – The FOMC Member Governor Lael Brainard Speech at 20:00 (GMT+2).

by JustForex


This article reflects a personal opinion and should not be interpreted as an investment advice, and/or offer, and/or a persistent request for carrying out financial transactions, and/or a guarantee, and/or a forecast of future events.
The growth of the dollar index continues against the background of positive data from the manufacturing sector

by JustForex

On Monday, the foreign exchange market lost Friday’s synchronicity. If the European currencies were decreasing against the dollar, commodities were growing. Nevertheless, the dollar index was close to the daily moving average SMA 100 at 91.30. The market is keeping a close eye on this mark, as in the case of fixing the indicator above, there will be a signal to the market reversal.

The dollar continues to be supported by a fundamental background. There was data from the ISM manufacturing sector that gave rise to positive expectations for the labor market. The business activity index increased to 60.8 in February from 58.7 in January, exceeding market expectations of 58.8. The indicators point to the strongest growth in production activity since February 2018. New orders rose to 64.8 from 61.1 a month earlier. The employment index increased to 54.4 against 52.6, and the new export orders showed 57.2 against 54.9.

Supplies remain a problem in the sector. This indicator rose to 72 against 68.2. The price pressure also increased: 86 against 82.1, which is the highest indicator since July 2008. According to ISM Chairman Timothy R. Fiore, problems due to work constraints, short-term breaks for disinfection of facilities, and difficulties in hiring workers continue to cause tensions that limit the growth potential of production.

The market positively reacted to the data. American treasuries yield increased slightly and stabilized at about 1.43%. In Australia, bond yields rose after the central bank left its asset purchase plan unchanged. The stock market has increased slightly, although trading was varying. The Dow Jones and S&P 500 added about 2%. But in the Asian session, there is a decline again.

Investors continue to argue about whether the government and central bank stimulus is excessive. The possibility of accelerating inflation as the global economy recovers has raised fears that monetary policy may need to be tightened sooner than expected. This has led to the rising of sovereign bond yields this year and stopping the bullish rally on stock exchanges.

Main market quotes:

S&P 500 (F) 3,881.50 -17.25 (-0.44%)

Dow Jones 31,535.51 +603.14 (+1.95%)

DAX 14,025.82 +13.00 (+0.09%)

FTSE 100 6,610.75 +22.22 (+0.34%)

USD Index 91.260 +0.224 (+0.25%)

Important events:
  • – RBA Interest Rate Decision (Mar) at 02:30 (GMT+2);
  • – Germany Unemployment Change (Feb) at 10:55 (GMT+2);
  • – Eurozone CPI (y/y) (Feb) at 09:00 (GMT+2);
  • – Canadian GDP (q/q) at 15:30 (GMT+2);
  • – FOMC Member Brainard Speech at 20:00 (GMT+2).

by JustForex


This article reflects a personal opinion and should not be interpreted as an investment advice, and/or offer, and/or a persistent request for carrying out financial transactions, and/or a guarantee, and/or a forecast of future events.

Technical Outlook: EURUSD poised to breach 1.20

By Lukman Otunuga Research Analyst, ForexTime

The euro is not looking too pretty this morning. 

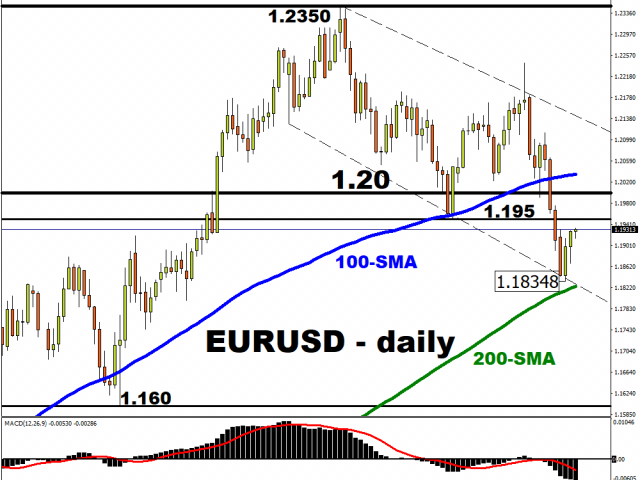
It has weakened against the dollar and Japanese yen but gained some ground against the New Zewland dollar. Over the past few weeks, the EURUSD has found itself within a very wide range with resistance at 1.2200 and support at 1.2000. Given how prices have cut below the 100 Simple Moving Average and pressing down fiercely against the 1.2000, the path of least resistance certainly points south.


The technicals swing in favour of bears on the daily timeframe. Prices are trading well below the 20 & 50 Simple Moving Average while the MACD trades to the downside. A solid daily close below 1.2000 could inspire a decline towards 1.9500 and 1.1920. Should 1.2000 prove to be reliable support, a rebound back towards 1.2050 and 1.2130 could be on the table.


Although the technicals are turning increasingly bearish, the fundamentals could still throw a proverbial wrench in the works for sellers. Later this morning, the Eurozone inflation reading and Germany’s unemployment rate will be published. Markets are expecting inflation to hold steady at 0.9% while the core reading is forecast to cool from 1.4% to 1.1%. The unemployment rate in Europe’s largest economy to projected to hold steady at 6%, unchanged from January. 

Back to the technicals…

It is a different story on the weekly charts for the EURUSD. Prices respecting a bullish weekly channel and there have been consistently higher highs and lows. This is bull territory with bears under threat if prices trade back above 1.2150. A strong weekly close below 1.2000 could give the thumbs up for sellers to target 1.1900 and 1.1700. 


1.20 pivotal on monthly timeframe 

It is safe to say that the EURUSD remains bullish on the monthly timeframe. Prices are trading above the 100 SMA while the Relative Strength Index has yet to hit overbought levels above 70.00. If 1.2000 can hold the fort and keep bears out, prices could rebound back towards 1.2348. However, a solid monthly close below 1.2000 is likely to spell trouble for the bullish trend with the next key point of interest around 1.1600.


Disclaimer: The content in this article comprises personal opinions and should not be construed as containing personal and/or other investment advice and/or an offer of and/or solicitation for any transactions in financial instruments and/or a guarantee and/or prediction of future performance. ForexTime (FXTM), its affiliates, agents, directors, officers or employees do not guarantee the accuracy, validity, timeliness or completeness, of any information or data made available and assume no liability as to any loss arising from any investment based on the same.


Forex-Time-LogoArticle by ForexTime

ForexTime Ltd (FXTM) is an award winning international online forex broker regulated by CySEC 185/12 www.forextime.com

Technical Outlook: G10 Currencies In Focus

By Lukman Otunuga Research Analyst, ForexTime

Over the past few days, we have been talking about bond markets, soaring yields, the great reflation trade, and other key developments moving markets.

Today, our focus will be directed towards the G10 space and our weapon of choice…technical analysis.

Dollar rebound or dead cat bounce?

Last Friday, we questioned whether the Dollar was experiencing a dead cat bounce.

After flirting around the 50-day simple moving average (SMA) for weeks, the Dollar Index pushed higher thanks to rising US Treasury yields. Prices are trading marginally below the 91.00 level while the MACD is flat. Interestingly, the Relative Strength Index (RSI) is venturing towards 70.00 – overbought territory. A solid close above 91.00 could open a path towards 91.60 and 92.00. A decline back below 90.50 may invite a selloff towards 90.00 and 89.30.

Pound experiencing a technical pullback?

Sterling collapsed like a house of cards last week after punching above 1.4200 for the first time since April 2018.

It looks like a pullback could be in play but this will depend on how prices behave below 1.4000. Sustained weakness under this resistance could encourage a steeper decline towards 1.3830 and 1.3760. Should 1.4200 prove to be unreliable resistance, prices may rebound towards 1.4140 and 1.4200.

Euro poised for further downside

A lot is going on with the EURUSD.

Prices are trading below the 50 SMA but above the 100 SMA. The MACD is flat but the recent selloff suggests another decline on the horizon. A solid daily close below 1.2050 could trigger a decline towards 1.2000 and 1.9050. For bulls to jump back into the game, a strong daily close above 1.2130 will be required.

AUDUSD respects bullish channel

As the title says, the AUDUSD remains in a bullish channel on the daily timeframe. However, prices have cut below the previous higher low of 0.7724, offering an opportunity for bears to re-enter the scene. If prices are unable to break above 0.7820, this may result in a decline towards 0.7660 and 0.7563.

EURGBP capped under 0.8700?

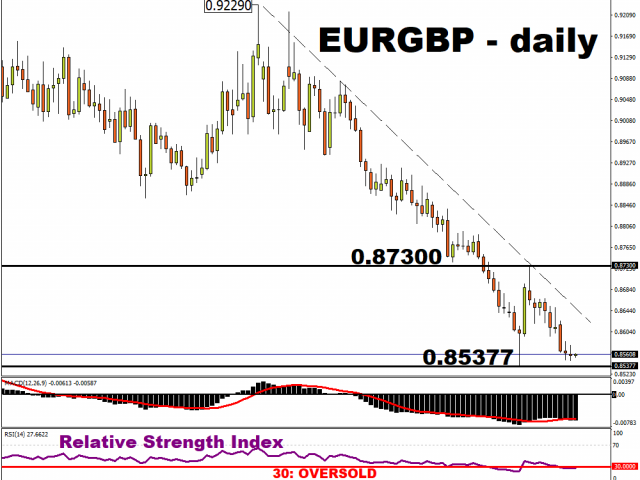
Is the EURGBP in the process of a technical rebound or a dead cat bounce? After rebounding from the 0.8538 level last week, prices failed to secure a daily close above 0.8700.

Where the EURGBP trades in the medium to long term may depend on whether the current range can be broken. Sustained weakness under 0.8700 may trigger a decline towards 0.8596 and 0.8538. Should bulls take prices back above 0.8700, the next key level of interest may be found around 0.8780.

USDJPY eyes 107.00

The USDJPY is firmly bullish on the daily charts. Bulls remain in the control as long as the 105.838 higher low proves to be reliable support. Prices are trading above the 20 Simple Moving Average (SMA) while the MACD trades to the upside.  A weaker Dollar or intraday breakout above 106.80 could elevate the USDJPY towards 107.00 in the week ahead.

Disclaimer: The content in this article comprises personal opinions and should not be construed as containing personal and/or other investment advice and/or an offer of and/or solicitation for any transactions in financial instruments and/or a guarantee and/or prediction of future performance. ForexTime (FXTM), its affiliates, agents, directors, officers or employees do not guarantee the accuracy, validity, timeliness or completeness, of any information or data made available and assume no liability as to any loss arising from any investment based on the same.


Forex-Time-LogoArticle by ForexTime

ForexTime Ltd (FXTM) is an award winning international online forex broker regulated by CySEC 185/12 www.forextime.com

What To Expect In A Busy Week For AUD

By Orbex

Australia has been riding the recent commodities boom. And if a supercycle does develop, it could be in for some substantial growth.

But, there is a particular challenge that they have to overcome in the short term, which might put it behind other countries during the recovery.

Australia was one of the slowest countries in the developed world to begin their covid vaccination program. In fact, the first jabs only started on Feb 22.

Australia has secured orders for more than enough vaccines for their population. However, their schedule is more extensive than other nations.

They plan to have everyone vaccinated by October of this year (compared to May, in the UK). The schedule is almost as long as the highly-criticized EU vaccine rollout.

Although Australia is now heading towards winter, instead. And it doesn’t rely as much on tourism as its neighbors.

What we are looking for

We need to look at data releases from Australia in the context that the country is likely to remain closed to travel for quite a few months more. This is despite the domestic economy largely remaining open.

Still, the risk of lockdowns appearing at any moment is likely to persist, keeping businesses and investors on edge.

Probably the biggest event, though not likely to rile up the markets all that much, is the RBA Interest Rate decision. It’s the first time the reserve bank has gotten together this year.

But everyone agrees that they will keep rates on hold.

The outlook remains key

Most of the focus for the RBA is likely to be on the rate statement to see if there is any change in forward guidance. In the latest survey, all but one economist said that the RBA is likely to keep rates steady until at least the end of the year.

The next major bit of data is the Q4 GDP change. Projections indicate that it will show an acceleration of quarterly growth to 4.1% compared to 3.3% in the prior quarter.

Expectations are for Australia to definitely miss a “second dip”. However, we don’t expect the growth to offset the initial impact of the pandemic, as the annual GDP looks likely to come in at -4.3% compared to -3.8% in the prior measurement.

What’s needed to get the economy to take off

Finally, on Thursday we have the release of January Retail Sales.

Expectations are for this to stay steady with 0.6% monthly growth compared to 0.6% in December. Consumer activity is the most sensitive to the threat of lockdowns, and has been behaving erratically since the start of the pandemic.

Although above-average retail sales might be seen as a good for businesses, they still highlight the unsteady nature of the market.

Recently PM Morrison announced that job support programs will be allowed to expire in March. This is long before a significant portion of the population will receive their vaccines.

The implication is that the jobs market might come under pressure heading into the autumn, keeping retailers on edge.

By Orbex

Fibonacci Retracements Analysis 01.03.2021 (GOLD, USDCHF)

Article By RoboForex.com

XAUUSD, “Gold vs US Dollar”

In the daily chart, the long-term correction continues; the previous descending impulse has reached 38.2% fibo. After a slight pullback, the price may continue falling towards 50.0% and 61.8% fibo at 1617.50 and 1509.85 respectively. However, there is a convergence on MACD, which may hint at a possible reversal and a new ascending wave after the instrument reaches one of its key downside targets. The key resistance is the high at 2074.75.

GOLD_D1
Risk Warning: the result of previous trading operations do not guarantee the same results in the future

In the H4 chart, a local convergence made the pair start a new pullback after reaching the long-term 38.2% fibo. The possible correctional targets are 23.6%, 38.2%, and 50.0% fibo at 1774.20, 1809.80, and 1838.45 respectively. However, if the price breaks the local low at 1717.15, XAUUSD may continue falling to reach the long-term 50.0% fibo at 1617.50.

GOLD_H4
Risk Warning: the result of previous trading operations do not guarantee the same results in the future

USDCHF, “US Dollar vs Swiss Franc”

The daily chart shows that a convergence made start a new rising wave, which has already broken 23.6% fibo and may later continue growing to reach 38.2% fibo at 0.9323. The key upside target is 50.0% fibo at 0.9496. However, if the asset breaks the support at 0.8758, the correction may be over.

USDCHF_D1
Risk Warning: the result of previous trading operations do not guarantee the same results in the future

As we can see in the H4 chart, after correcting by almost 50.0%, USDCHF has broken the high 0.9046 to enter the post-correctional extension area between 138.2% and 161.8% fibo at 0.9113 and 0.9154 respectively. the support is the local low at 0.8871.

USDCHF_H4
Risk Warning: the result of previous trading operations do not guarantee the same results in the future

Article By RoboForex.com

Attention!
Forecasts presented in this section only reflect the author’s private opinion and should not be considered as guidance for trading. RoboForex LP bears no responsibility for trading results based on trading recommendations described in these analytical reviews.

Ichimoku Cloud Analysis 01.03.2021 (EURUSD, EURJPY, USDCAD)

Article By RoboForex.com

EURUSD, “Euro vs US Dollar”

EURUSD is trading at 1.2084; the instrument is moving below Ichimoku Cloud, thus indicating a descending tendency. The markets could indicate that the price may test the cloud’s upside border at 1.2120 and then resume moving downwards to reach 1.1950. Another signal in favor of a further downtrend will be a rebound from the resistance level. However, the bearish scenario may be canceled if the price breaks the cloud’s upside border and fixes above 1.2030. In this case, the pair may continue growing towards 1.2115.

EURUSD
Risk Warning: the result of previous trading operations do not guarantee the same results in the future

EURJPY, “Euro vs Japanese Yen”

EURJPY is trading at 128.75; the instrument is moving above Ichimoku Cloud, thus indicating an ascending tendency. The markets could indicate that the price may test the cloud’s upside border at 128.35 and then resume moving upwards to reach 130.80. Another signal in favor of a further uptrend will be a rebound from the rising channel’s downside border. However, the bullish scenario may no longer be valid if the price breaks the cloud’s downside border and fixes below 127.45. In this case, the pair may continue falling towards 126.65.

EURJPY
Risk Warning: the result of previous trading operations do not guarantee the same results in the future

USDCAD, “US Dollar vs Canadian Dollar”

USDCAD is trading at 1.2698; the instrument is moving above Ichimoku Cloud, thus indicating an ascending tendency. The markets could indicate that the price may test the cloud’s upside border at 1.2645 and then resume moving upwards to reach 1.2890. Another signal in favor of a further uptrend will be a rebound from the descending channel’s upside border. However, the bullish scenario may no longer be valid if the price breaks the cloud’s downside border and fixes below 1.2505. In this case, the pair may continue falling towards 1.2415. To confirm further growth, the asset must break the descending channel’s upside border and fix above 1.2795.

USDCAD
Risk Warning: the result of previous trading operations do not guarantee the same results in the future


Article By RoboForex.com

Attention!
Forecasts presented in this section only reflect the author’s private opinion and should not be considered as guidance for trading. RoboForex LP bears no responsibility for trading results based on trading recommendations described in these analytical reviews.

The growth of the dollar index continues in expectation of the report on the labor market this week

by JustForex

On Friday, the market moved synchronously in favor of the dollar. Gold broke through the lows on November 30 and consolidated below $1,760 per troy ounce. The Bloomberg Commodity Index, which consists of 23 commodities, decreased the most since April, as the dollar’s strength reduced the interest in commodities valued in that currency. Meanwhile, last week, a spike in US government bonds yield heightened fears that the accelerating inflation could weaken the support of the monetary policy. Against this backdrop, the stock prices happened to be under pressure. The S&P 500 fell to a fresh low on February 23.

No one expected such a rapid collapse of bonds in the market. The general picture of the situation is more associated with panic selling. Investors are concerned that accelerated inflation could trigger a reduction of stimulus from central banks, although the Fed emphasizes that there are no plans to tighten the policy prematurely.

Oil showed its resilience at the opening of the week, rebounding from its lows on February 24 shortly before the key OPEC+ meeting, at which some proposals could stop the trend. Brent oil rose above $65.50 p/b again after decreasing by 3.2% on Friday. The alliance will hold a meeting on Thursday.

The credit market is showing a rebound. Bond prices are correcting after last week’s nosedive. Nevertheless, the profitability remains high. German Bonds are at -0.31%, which is June’s maximum of the last year. Last week, these securities were able to reach the level of -0.20%, which is the best result since December 2019.

US Treasuries decreased to 1.40% after hitting 1.61% last week. 2-year bonds returned to their previous range at 1.13% after a sharp spike to 1.19%. At the same time, the Fed’s futures contracts for an increase in rates remain unchanged.

Main market quotes:

S&P 500 (F) 3,854.38 +45.13 (+1.18%)

Dow Jones 30,932.37 -469.64 (-1.50%)

DAX 13,967.35 +181.06 (+1.31%)

FTSE 100 6,604.43 +121.00 (+1.87%)

USD Index 91.028 +0.146 (+0.16%)

Important events:
  • – China Caixin Manufacturing PMI (Feb) at 03:45 (GMT+2);
  • – Germany Manufacturing PMI (Feb) at 10:55 (GMT+2);
  • – Eurozone Manufacturing PMI (Feb) at 11:00 (GMT+2);
  • – UK Manufacturing PMI (Feb) at 11:30 (GMT+2);
  • – US ISM Manufacturing PMI (Feb) at 17:00 (GMT+2)

by JustForex


This article reflects a personal opinion and should not be interpreted as an investment advice, and/or offer, and/or a persistent request for carrying out financial transactions, and/or a guarantee, and/or a forecast of future events.

The Analytical Overview of the Main Currency Pairs on 2021.03.01

by JustForex

The EUR/USD currency pair

Technical indicators of the currency pair:
  • Prev Open: 1.2174
  • Prev Close: 1.2073
  • % chg. over the last day: -0.83%

Friday saw the pair’s largest intraday fall since March last year. The weekly candle closed in the red, forming a bearish engulfing. On the daily chart, the price has returned to the range between the moving averages. The dynamics in the market indicate at least a halt in the northern trend.

Trading recommendations
  • Support levels: 1.2062, 1.2023
  • Resistance levels: 1.2179, 1.2222

The main scenario for trading EUR/USD is selling. Friday’s bearish momentum completely changed the picture for the pair. The moving averages are heading down, and the ADX indicates a reversal in the mid-term trend. The potential for further decline remains high.

Alternative scenario: if the price gains a foothold above the level of 1.2146, the pair may return to growth up to 1.2179.

EUR/USD
News feed for 2021.03.01:
  • – The German Manufacturing Purchasing Managers’ Index (PMI) (Feb) at 10:55 (GMT+2);
  • – The Eurozone Manufacturing Purchasing Managers’ Index (PMI) (Feb) at 11:00 (GMT+2);
  • – The US ISM Manufacturing Purchasing Managers’ Index (PMI) (Feb) at 17:00 (GMT+2).

The GBP/USD currency pair

Technical indicators of the currency pair:
  • Prev Open: 1.4006
  • Prev Close: 1.3926
  • % chg. over the last day: -0.57%

On Friday, the pair continued to decline, though at a slower pace. The sterling, unlike the euro, continues to show strength. Despite the strong momentum of the last week, medium and long-term technical indicators remained on the side of the bulls. In the Asian session, the sterling almost completely recovered from the losses of February 26.

Trading recommendations
  • Support levels: 1.3886, 1.3819
  • Resistance levels: 1.4224, 1.4300

The main scenario for GBP/USD is trading sideways between 1.3886 and 1.4065. The market is currently experiencing a short-term correction, which should not exceed the average SMA 100. The ADX has not yet shown a reaction to the pullback.

Alternative scenario: if the pair consolidates above 1.4065, it may resume its growth.

GBP/USD
News feed for 2021.03.01:
  • – The UK Manufacturing Purchasing Managers’ Index (PMI) (Feb) at 11:30 (GMT+2);
  • – The US ISM Manufacturing Purchasing Managers’ Index (PMI) (Feb) at 17:00 (GMT+2).

The USD/JPY currency pair

Technical indicators of the currency pair:
  • Prev Open: 106.22
  • Prev Close: 106.55
  • % chg. over the last day: +0.32%

The dollar-yen pair continues to grow steadily following the dollar index. Defensive assets such as gold, Swiss franc, and yen continue to sell heavily. But at the same time, the demand for risky assets also fell. This could cause a bullish rally in the pair to stop.

Trading recommendations
  • Support levels: 104.92, 104.40
  • Resistance levels: 106.70, 106.94

The main scenario is trading in a sideways range between 106.70 – 105.93. The dollar-yen pair has formed an upward channel. But the price is already near its upper border, which may cause a pullback. Also, the ADX and MACD indicate the southern correction. On the MACD, a divergence is formed.

An alternative scenario implies the price-fixing below 105.95. In this case, the pair may return to decline to 104.92. A break at 106.70 could indicate further gains.

USD/JPY
News feed for 2021.03.01:
  • – The US ISM Manufacturing Purchasing Managers’ Index (PMI) (Feb) at 17:00 (GMT+2).

The USD/CAD currency pair

Technical indicators of the currency pair:
  • Prev Open: 1.2601
  • Prev Close: 1.2734
  • % chg. over the last day: +1.06%

The pair accelerated its gains on Friday, showing the fastest pace since November last year. The growth was facilitated by a decrease in quotations on the oil market. However, there is no significant decline in the oil market, which indicates that the northern rally in USD/CAD will stop shortly.

Trading recommendations
  • Support levels: 1.2608, 1.2467
  • Resistance levels: 1.2745, 1.2763

The main scenario is cautious buying. Technically, the pair is showing a mid-term north direction, but the February highs have not been broken. This indicates a probable stop near the current levels, and in the medium term, the price may get stuck in the range between the first support and resistance level.

Alternative scenario: if the price consolidates below 1.2608, the pair may resume its decline to 1.2450.

USD/CAD

by JustForex


This article reflects a personal opinion and should not be interpreted as an investment advice, and/or offer, and/or a persistent request for carrying out financial transactions, and/or a guarantee, and/or a forecast of future events.